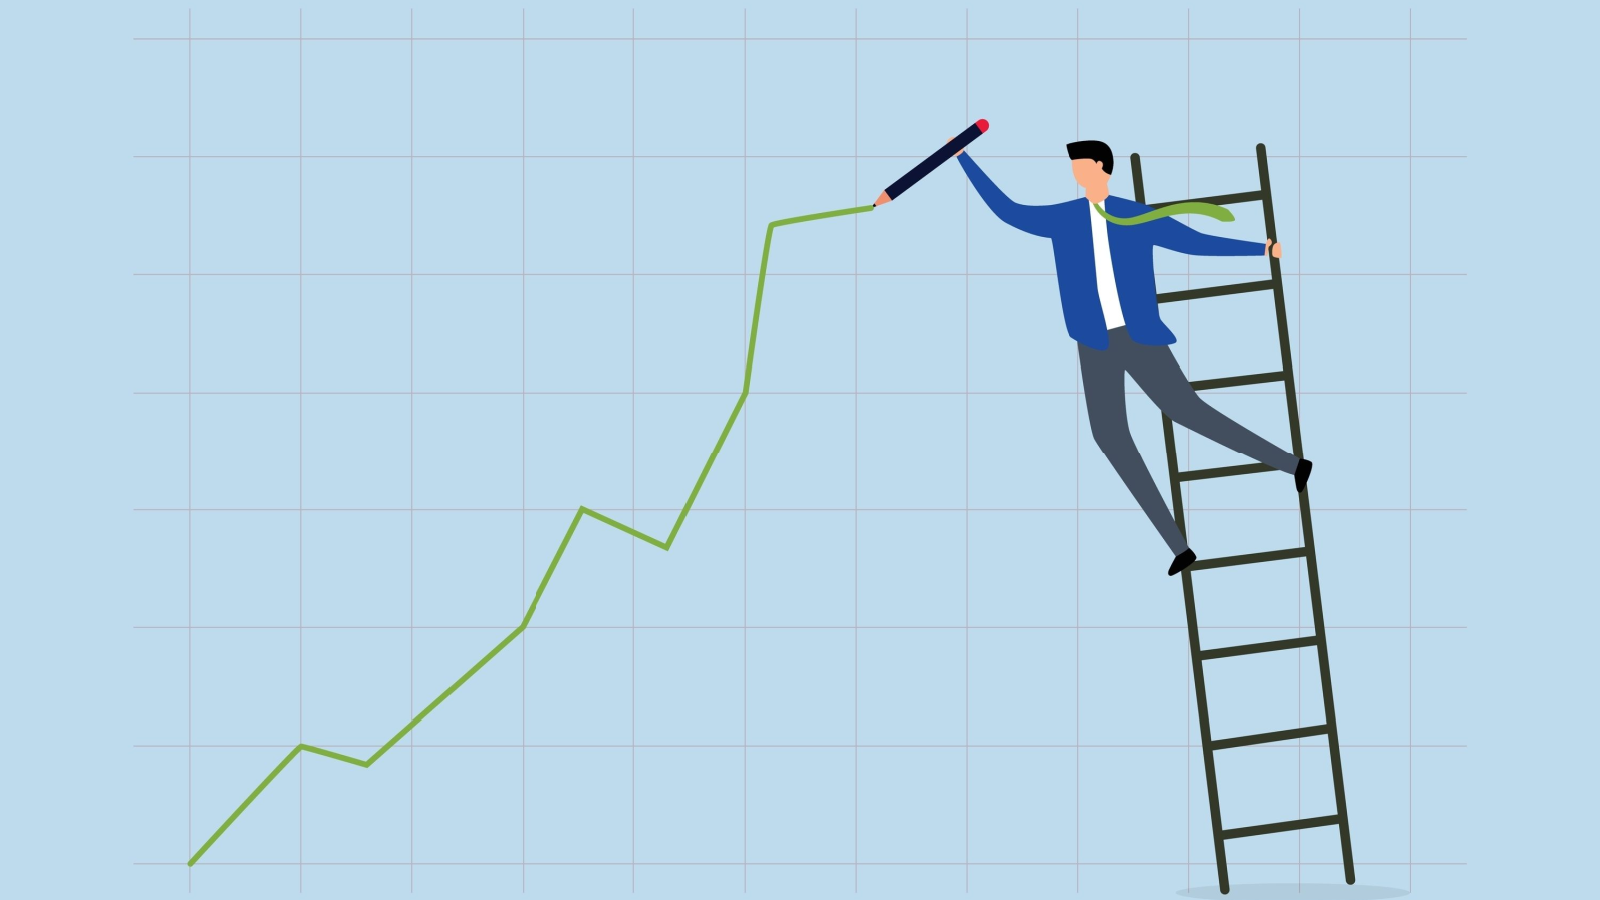
How to Stay Ahead as Tariffs and Consumer Confidence Hit Stocks


Trump tariffs and consumer confidence weigh on Wall Street … hope you didn’t sell your AI energy stocks … how to adjust your risk with position sizing

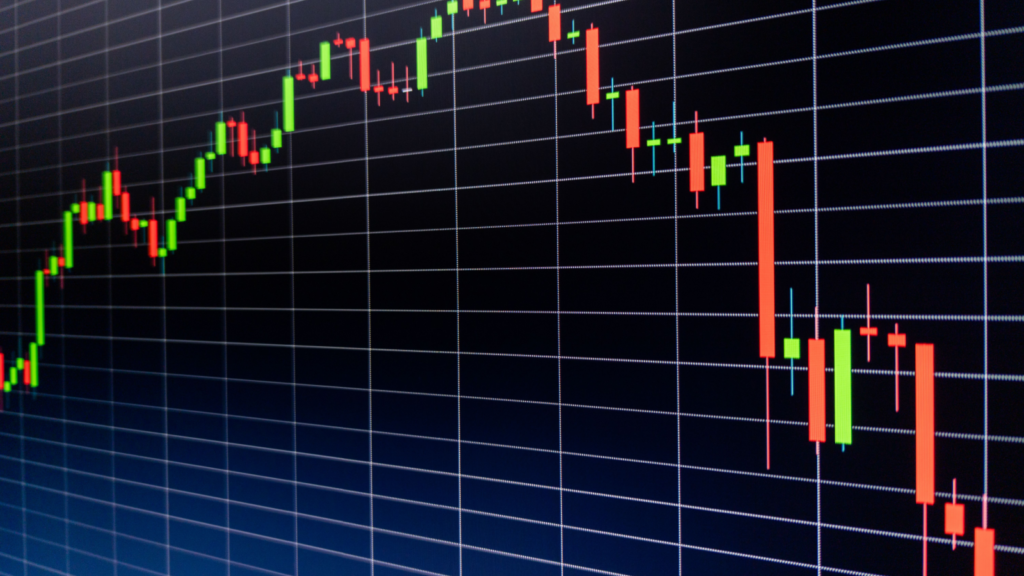
This morning, Wall Street moved lower after two headlines weighed on investors.

First, President Trump announced that tariffs on products from Mexico and Canada are back on.

Here’s CNBC:

President Donald Trump said that sweeping U.S. tariffs on imports from Canada and Mexico “will go forward” when a monthlong delay on their implementation expires next week.

“The tariffs are going forward on time, on schedule,” Trump said when asked at a White House press conference if the postponed tariffs on the two U.S. trading partners would soon go back into effect.

Products from Mexico and Canada will face a 25% levy, plus 10% duties on Canadian energy.

For investors and consumers, tariffs raise fears of a resurgence of inflation. And that dovetails into our next story – February’s downbeat consumer confidence report.

Here’s MarketWatch:

Consumer confidence [has sunk to an] 8-month low on worries about inflation and Trump tariffs. The decline was the third in a row since the index hit a 16-month peak of 112.8 in November…

Americans also said it was harder to get a job and they were more worried about their incomes.

Put these headlines together and Wall Street is unhappy. All three major indexes were down sharply earlier today with the Nasdaq off nearly 2% at one point.

The good news is that stocks are well off their lows of the morning.

Consider using this tech selloff as a shopping opportunity

I hope you didn’t sell your AI energy stocks back in January when the news of DeepSeek broke…

As you’ll recall, the emergence of the Chinese low-cost AI platform sent Wall Street into a panic.

The fear was that DeepSeek’s groundbreaking low-cost technology meant that the tsunami of AI investment capital that everyone anticipated wouldn’t materialize. And that meant saying “goodbye” to all those earnings-juiced, super-bullish stock price projections.

Not so much.

Here’s the Wall Street Journal:

Despite a brief period of investor doubt, money is pouring into artificial intelligence from big tech companies, national governments and venture capitalists at unprecedented levels.

Before we dive into why, let’s back up.

In the days following DeepSeek’s arrival, our experts Louis Navellier, Eric Fry, and Luke Lango urged investors not to bail on AI

While they believed the leaderboard could change slightly, they agreed that DeepSeek’s low-cost technology would be bullish for AI, not bearish, thanks to Jevons Paradox.

This economic principle suggests that AI at lower cost will result in more total AI spending, not less, because more companies will be able to pay for AI. So, while the cost-per-unit of AI could drop dramatically, total AI spend would explode higher.

Now, Jevons Paradox is happening. We are seeing certain AI costs drop dramatically, leading to greater demand.

But at the same time, the bleeding edge of AI technologies are still coming at a high price tag along with enormous energy demand. To understand why, it’s important to recognize that technology is moving away from traditional large language models (LLM); it’s now moving toward reasoning models and AI agents.

For a good explanation, let’s go back to the WSJ:

Reasoning models, which are based on large language models, are different in that their actual operation consumes many times more resources, in terms of both microchips and electricity…

DeepSeek caused a panic of sorts because it showed that an AI model could be trained for a fraction of the cost of other models, something that could cut demand for data centers and expensive advanced chips.

But what DeepSeek really did was push the AI industry even harder toward resource-intensive reasoning models, meaning that computing infrastructure is still very much needed.

So, how much more “resource-intensive” are these reasoning models?

Here’s Kari Briski, Nvidia’s vice president of product management:

On tasks like generating complex, customized code for developers, this AI reasoning process can take multiple minutes, or even hours — and can easily require over 100x compute for challenging queries compared to a single inference pass on a traditional LLM.

Back to the WSJ for how this is likely to affect overall demand:

In January, it appeared that the cost per token [of AI development] —in both computing power and dollars—would crash in the wake of the release of DeepSeek R1…

On its face, this would seem to indicate that AI’s future demand for computing power would be some fraction of its current amount—say, a tenth, or even less.

But the increase in demand from reasoning models…could more than make up for that.

If…reasoning models become the standard and increase demand for those models by a factor of 100, that’s still a 10-fold increase in future demand for power for AI.

This is just the starting point. As businesses are discovering that the new AI models are more capable, they’re calling on them more and more often. This is shifting demand for computing capacity from training models toward using them.

The WSJ goes on to profile a company that provides AI computing resources to other companies. Here’s its CEO commenting on AI costs and overall demand:

For one customer, we brought their costs down probably 60% six months ago, and within three months, they were already consuming at a higher level than they were consuming initially.

Bottom line: Unless your investment time horizon is less than a year or so (we’ll circle back to you in a moment), ignore the risk of a market correction. Diversify your picks (chipmakers, components suppliers, energy plays, and so on) but invest and then just hang on.

If you’re more risk averse, consider investing a small starter position from which you’ll dollar-cost-average over time (adding to your position in equal dollar increments at regular intervals going forward so that you average out your overall cost basis).

If you’d like help with which stocks to add to your portfolio, our macro expert Eric just identified several that are set to benefit from artificial general intelligence. They’re in his special reports: My 3 Top AGI Stocks for 1,000%Gains and The AI Dominators. To learn how to access these reports, click here.

I’ll wrap up this section with the following quote from Tomasz Tunguz, venture capitalist and the founder of Theory Ventures:

Every keystroke in your keyboard, or every phoneme you utter into a microphone, will be transcribed or manipulated by at least one AI.

And if that’s the case, the AI market could soon be 1,000 times larger than it is today.

How to remain in the AI trend if you can’t stomach the coming ups and downs

In Friday’s Digest, I noted that not everyone has a decade-long investment horizon.

Frankly, not everyone has a one-year investment horizon.

If you’re in that boat – or if you’re a more conservative investors – how do you invest in AI without too much exposure to market risk?

In Friday’s Digest, I highlighted an entry/exit timing tool from our corporate partner, TradeSmith. It uses historical market data to create a unique volatility thumbprint for any given stock.

This proprietary “Volatility Quotient” (VQ) reading helps investors know how much volatility is normal and to be expected. And that can inform an investor about when it’s time to get out of a position… and eventually, back in.

But you can use this VQ reading in a second way – to detail exactly how much money to invest based on your specific risk tolerance.

Circling back to today’s AI megatrend, let’s say you find a stock you want to buy, but you have a fixed amount of money you’re willing to risk losing. We can use the VQ reading again, yet with another tool – a Position Size Calculator.

Here’s TradeSmith’s CEO Keith Kaplan:

In our TradeSmith system, we offer something called a Position Size Calculator. It has three different scenarios for how to buy a stock.

  1. You could say, “I want to risk $1,000; how much of this stock should I buy?”
  2. Or let’s say you have a $100,000 portfolio. You could say, “I’d like to risk 2% of my portfolio; how much should I buy?”
  3. And finally, you could say, “I want to buy this stock with equal risk to the stocks in my portfolio; how much should I buy?”

This tool is VERY user friendly, and it’s set to walk you through the perfect position sizing for your portfolio in less than a minute.

Based on the amount of money you’re willing to risk on an AI stock, the Position Size Calculator would tell you the exact position size to take relative to the unique volatility of your chosen stock.

Many investors don’t realize how much these details affect your market performance. Here’s Keith:

Your position size matters a LOT. Don’t get it wrong.

Don’t buy too much of a risky stock and not enough of a low-risk stock.

You must find (and keep!) the right blend to maximize your potential gains while lowering your risk.

Keith is holding a live event this Thursday at 8 PM ET that provides a walk-through of these TradeSmith market tools.

He’ll also introduce a new technological breakthrough, demoing it for the first time. This “MQ Algorithm” is designed to detect and model market melt-ups mathematically. And even though the market is selling off as I write, this MQ algorithm is signaling a melt-up for a subset of stocks.

From Keith:

To be clear, I do think now is the time to buy stocks – but you want to make sure you’re buying the right ones at the right time.

On Thursday at 8 p.m. Eastern, I’m going to share the biggest prediction in my company’s 20-year history. One that will likely have you eager to buy stocks as well.

It’s free to attend. All you have to do is register for The Last Meltup, right here.

We’ll keep you updated on all these stories here in the Digest.

Have a good evening,

Jeff Remsburg


Source link

This Low-Risk Strategy Could Deliver Big Gains Now


A rare market signal is flashing—here’s how to profit from it quickly.

Editor’s Note: Geopolitical uncertainty, tariffs, mixed earnings results, and stalled-out price action has been throwing a wrench into the works this year.

But our partners at TradeSmith couldn’t be more certain about what’s coming.

And what’s coming is the continuation of an epic melt-up that officially began in April of last year… and will likely only accelerate over the next 12 months.

Today, TradeSmith CEO Keith Kaplan is joining us today to brief you on exactly how they reached that conclusion… and the strategy he uses to take advantage of stocks in sharp downtrends.

Take it away, Keith…

They say you should never try to catch a falling knife.

That’s certainly true… if you’re doing it without a plan.

But if you do it with the right stocks, buying into a downtrend and banking on a reversal can be quite lucrative.

A couple months back, we got the idea of designing a system that’s like catching a falling knife with Kevlar gloves on… where we minimize the risk and trade only the rarest setups with a strong track record of working.

We tested tons of different variables, and eventually we found one combination that produces a rare but quite reliable trading signal.

By targeting quality stocks in sudden, steep downtrends… You can bank on a quick reversion to the mean that sends the shares much higher from your entry.

Why talk about it now?

First off, it’s about to go live in TradeSmith Finance for Trade360Ideas by TradeSmith, and Platinum subscribers. We wanted folks to be ready to grab some serious gains, as TradeSmith is picking up an ultra-rare bullish signal in the markets right now that only comes around every few decades.

And that signal is really key to this whole strategy.

You see, our data shows that we’re in a rare kind of market that we previously only saw in 1996… and then 70 years earlier, in 1926.

If your market history is sharp, you know those were the early stages of massive investment manias that went far further and lasted much longer than anyone expected.

Both were powered by technological breakthroughs… financial institutions lowering the barrier for smaller investors to participate… and a consumer credit revolution that spurred the economy higher.

These are all things we’re seeing the beginnings of today. And what we’ve found is that these specific conditions signal the start of a “mega melt-up.”

In markets like this, stocks can post monumental gains, year after year.

For example, the S&P 500 rose more than 20% every single year from 1996 to 1999, until the bubble popped in September of 2000. The Nasdaq did even better, returning 42%, 20%, 83%, and 102% in that four-year period.

Individual stocks did even better, with companies like Microsoft (MSFT) returning more than 1,000%… Oracle (ORCL) returning more than 1,200%… and Amazon (AMZN) hitting a peak of 8,509% from ’97 to ’99.

But of course, every melt-up eventually turns into a meltdown.

That was true 100 years ago, as the Roaring  ‘20s gave way to the Great Depression.

And it was true 30 years ago, when the dot-com boom turned into a bubble and a bust.

But no matter if we’re in the boom, bubble, or bust phase of a melt-up, this strategy is perfectly suited to catching quick gains as stocks recover from quick sell-offs.

More on all this in a brand-new presentation later this week.

But today, let’s focus on the strategy…

How This New Strategy Delivers Rare, Powerful Gains

Setups from our new strategy don’t happen often, and they rarely happen in stocks with a low Volatility Quotient (VQ). For new readers, VQ is our measure of a stock’s individual volatility. The higher the score, the more volatile in the name – and vice versa.

That makes sense – high-quality stocks don’t tend to make big drops. The market rewards great businesses with higher share prices.

But every so often, a bad earnings report or a shock macro event can throw these stocks off their game. And that’s when we want to buy them.

We tested this new strategy on the S&P 500 going back 10 years.

Of the 339 cases we found – roughly a third of which were during the initial panic sell-off of March 2020 – just under 80% saw positive returns 21 trading days later. And the average return, counting wins and losses, was about 16%.

That’s a strong signal… with great returns for such a short period. It makes for a great swing-trading strategy.

Now, I can’t tell you the exact parameters of the newest version of this strategy. If I did that, anyone could go and set it up and trade it for themselves… which wouldn’t be right to our subscribers.

But I can show you a couple examples… like this one.

In our backtest of this strategy, we spotted a trade on Humana (HUM) during the pandemic crash.

The Snapback signal triggered on HUM at $206.99 on March 23, 2020. Buying it then and holding for the next 21 trading days probably sounded like a horrible idea at the time.

But you would’ve walked away with a 71.6% return as the stock recovered to $355.18:

This was the pandemic, though. A lot of stocks pulled moves like this.

Let’s look at a more isolated incident involving insurance company Globe Life (GL) from last year.

GL was the target of a short report that accused insurance fraud. The stock dropped more than 50% in a single session, and that was enough to trigger the Snapback signal on April 15 at a price of $55.52.

Twenty-one trading days later, the stock recovered to $88.10. returning 58.7%, as you see in the chart below:

Then there’s one of the cleanest examples I’ve found – a case from 2022, in Caesars Entertainment (CZR).

The signal triggered at $32.36 on Sept. 30… and would’ve led to a 35.5% gain if you’d sold it 21 trading days later (on Oct. 31) for $43.73:

These are some of the best performers the system found over the last 10 years.

To be clear, there were losers, too. But in our study, only one-fifth of the signals lost money.

So, I’m guessing you want to try it out?

Good news: There’s a live signal right now.

A Tradable Signal on FMC

Check out this chart of chemical manufacturer FMC Corp. (FMC):

On Feb. 11, this strategy flashed a new trade on FMC.

The rules are, the system were to have bought on Feb. 11 and held through March 13 (21 trading days). We’re a bit late to this trade, but it is currently the most recent signal in our system.

Luckily, the price hasn’t moved much. But it has trended a bit higher.

You could buy FMC on Monday and look to sell it as it reaches the average gain the system achieved in our backtest – about 16%. Even now, that’d be a very respectable return for the remaining 12 trading days.

Now, it’s important to understand that FMC is currently in the Red Zone, meaning it would not (yet) be a candidate for a long-term buy and hold.

But we’re talking about something different here. We’re talking about trading FMC for a short time as it recovers from its beaten-down price, only 21 trading days.

We’ll be rolling this strategy out to our Trade360, Ideas by TradeSmith, and TradeSmith Platinum subscribers very soon. When we integrate it into TradeSmith, they’ll be able to see new entry signals on this strategy and follow along if they wish. We’re finally in another “Roaring ‘20s” for the stock market, and I expect there to be tons of really exciting opportunities as long as this melt-up persists.

Ahead of that launch, I’ll be holding a free demo where I’ll show how to find 10 “melt-up stocks” for the historic market conditions TradeSmith is picking up now. Click here to save your seat for my Last Melt-Up event on Thursday, Feb. 27, at 8 p.m. Eastern.

All the best,

Keith Kaplan

CEO, TradeSmith

Frequently Asked Questions (FAQs)

1. What is this low-risk, high-reward strategy?

It’s a system that identifies high-quality stocks in steep downtrends with a history of quick rebounds.

2. How reliable is this trading approach?

Backtests show nearly 80% of trades were profitable, with an average return of 16% in 21 days.

3. Why is this market signal significant now?

It has only appeared twice in the last century—both times preceding historic market booms.

4. What stocks have worked with this strategy before?

Humana (HUM), Globe Life (GL), and Caesars Entertainment (CZR) all delivered strong returns.

5. How can I access real-time signals for this strategy?

TradeSmith will soon integrate it for subscribers, providing live trade opportunities.


Source link

How to Find Success in Today’s Volatile Stock Market


Another day, another crazy roller-coaster ride for the stock market…

This has been the trend since Halloween. 

That is, in November, the S&P 500 rose 5.73%, achieving one of its best months in a year on optimism about potential deregulation and tax cuts under the Trump administration.

Then, as investors began to fear that the U.S. Federal Reserve wouldn’t cut interest rates anymore, stocks crashed 2.5% in December. It turned out to be one of their worst months in a year. 

As we moved into 2025, stocks rebounded throughout January and early February thanks to renewed economic optimism… 

But they’ve since crashed over the past few weeks as uncertainty about tariffs, federal spending cuts, and an economic slowdown weighs heavy on Wall Street. Indeed, since Feb. 10, the S&P has slid nearly 1.2%. 

Stocks have swung violently higher and lower many times over the past several months. In that time, we’ve seen just 5% gains in the S&P 500 and a negative return from the small-cap Russell 2000

Is this intense volatility Wall Street’s ‘new normal’?

It may be… 

A Bumpy Ride Higher?

Don’t get me wrong; I still think stocks are going higher in 2025. 

Despite renewed concerns about inflation and a consumer spending slowdown, the economy still appears to be on stable footing. It should benefit from deregulation and maybe even tax cuts over the next few months. Plus, the AI Boom remains alive and well, which should continue to create growth through the economy. 

We’re also nearing the end of the fourth-quarter earnings season, and broadly speaking, it was a strong one.

As we mentioned in a recent issue on earnings, more than 75% of the companies in the S&P 500 (as of Feb. 18) have beaten Wall Street’s profit estimates, meaning they made more money last quarter than analysts expected. 

Meanwhile, the blended earnings growth rate is nearly 17%, which marks the index’s highest profit growth rate since 2021.

And trends are expected to stay strong for the foreseeable future. That is, next quarter, earnings are projected to rise about 8%, then another 9% in Q2. They are expected to rise almost 15% in the third quarter and about 13% in the fourth.

In other words, corporate earnings should keep rising for the rest of the year. Stock prices should follow suit. 

However… I don’t think it’ll be a smooth ride higher…  

Largely because of U.S. President Donald Trump.


Source link

The S&P is About to Breakout…or Break Down


A technical look at the S&P … the crypto pain-train rolls on … at least the 10-year Treasury yield is down … tomorrow’s big event with Keith Kaplan of TradeSmith

The S&P is about to make an exaggerated move.

Early clues suggest the direction will be “up,” but “down” is very much in play.

If the move is higher, we’re likely in for a rebound that our hypergrowth expert Luke Lango plans on buying. It could be a 3%+ surge back to all-time highs and beyond.

But if the move is lower, the S&P could fall another 3% to 5% by mid-March.

Behind this binary is the S&P’s 100-day moving average, an important technical support level

Yesterday, the S&P fell to this level, bounced slightly, and it’s sitting barely above it as I write Wednesday mid-morning.

For newer Digest readers, a moving average (MA) is a line on a price chart that shows the average price of an asset over some stated period. Moving averages provide investors and traders helpful perspective on market momentum.

These MA lines are important because they often trigger “buy” and “sell” decisions from the quantitative trading algorithms that drive so many professional portfolios these days.

So, if the S&P begins breaking either “up” or “down” from a key MA – like the 100-day MA – those quant programs are likely to amplify the move as they join in the buying or selling.

As I’ll show you below, the S&P has just bounced off its 100-day MA (the purple line) and is trying to retake its 50-day MA (in red).

(The 200-day MA is in blue. More on that shortly.)

Chart showing the S&P has just bounced off its 100-day MA (the purple line) and is trying to retake its 50-day MA (in red).

Source: TradingView

If we pull back to get a longer timeline, you’ll see that the 100-day MA has been the strongest support “backbone” of the S&P’s climb since late 2023.

With one exception, each time the S&P has fallen to this level, the 100-day MA has served as a springboard, bouncing it higher.

Chart showing the 100-day MA has been the strongest support “backbone” of the S&P’s climb since late 2023.

Source: TradingView

Beginning with the potential for a continuation of this bounce-and-rally, let’s jump to Luke. From his Innovation Investor Daily Notes earlier this week:

Since late 2023, the S&P 500’s big technical support line has been the 100-day moving average (MA).

In that time – about 15 months – the S&P 500 has only lost its 100-day once (August 2024), and when it did, the market briefly fell below that level, only to rebound sharply within days.

That means the 100-day moving average has essentially been the “bottom” for the stock market in all of its selloffs since late 2023. And that MA is just below where we trade today…

If we [hold here] and bounce… that would be a very bullish technical signal.

That’s why, [Monday] morning, I told my team to get their Buy Lists ready.

If the S&P’s bounce fizzles and it slips below the 100-day MA, it’s likely to fall roughly 3% or 5%

Falling 3% represents a pullback to 5,800 – about halfway between the S&P’s 100- and 200-day MAs. It’s also where the S&P found support in January.

If we look at the last time the S&P lost its 100-day MA (which Luke referenced), it reversed north about halfway between these two MAs at the big, round number of 5,200.

Such big, round numbers carry extra weight with traders. That’s why I’ve flagged a similar big, round number (5,800) that’s also about halfway between these MAs.

A drop of 5% would take the S&P all the way to its 200-day MA. This hasn’t happened since October of 2023.

What clues might give us a heads-up about upcoming direction?

The S&P’s Relative Strength Index (RSI) and Moving Average Convergence/Divergence Indicator (MACD) are both trading at levels from which rebounds have occurred over the last year.

The RSI has already U-turned and is headed higher. The MACD (which moves slower) hasn’t turned north yet but is inflecting, something called “bullish convergence.”

Chart showing the S&P’s Relative Strength Index (RSI) and Moving Average Convergence/Divergence Indicator (MACD) are both trading at levels from which rebounds have occurred over the last year.

Source: TradingView

Put it altogether and we’re giving the edge to a continuation of this bounce…yet it comes with an enormous asterisk (read on for what that is) …

In the meantime, get your buy list ready…and your stop-losses identified.

Speaking of buying versus following your stop-losses…

Bitcoin and altcoins are dropping fast.

This means one of two things:

  • If you’re a short-term trader who bought a couple months ago, check your stop losses and protect your capital.
  • If you’re a long-term believer who’s been adding to your position over time, get some dry powder ready to deploy.

As I write, Bitcoin trades beneath $88,000. Yesterday, it notched a three-month low.

Behind the decline are two primary contributors:

  • A broad “risk off” sentiment, which has gripped Wall Street recently, has disproportionately affected Bitcoin (the poster child for risk).
  • A lack of short-term catalysts to get crypto investors bullish.

On that second note, here’s CNBC:

Bitcoin kicked off the year in rally mode, fueled by optimism about the positive changes the new Trump administration was expected to make for the crypto industry.

However, since the President issued his widely anticipated executive order on crypto at the end of January – the contents of which were well received by the industry despite its tamer than hoped for language on a strategic bitcoin reserve – the market has had little to look forward to.

Below, we look at Bitcoin’s chart, including its RSI and MACD indicators referenced above

Bitcoin’s RSI level (circled in red) is 28. This is officially “oversold” territory, as well as its lowest level since August.

Similarly, Bitcoin’s MACD (also circled in red) is deeply negative, signifying oversold conditions. It too is trading at its lowest level since last summer.

Chart showing Bitcoin’s RSI level (circled in red) is 28. This is officially “oversold” territory, as well as its lowest level since August. Similarly, Bitcoin’s MACD (also circled in red) is deeply negative, signifying oversold conditions. It too is trading at its lowest level since last summer.

Source: TradingView

The silver lining is that these depressed levels heighten the odds of a mean reversion rally.

That said, you never want to try to catch a falling knife. So, if you’re looking to add to your Bitcoin position, the safer move would be to wait until there’s more obvious strength in these technical charts.

After all, the bottom could be closer to $70,000 – $75,000.

We’ll continue monitoring and will report back.

The falling 10-year Treasury yield is good news

As regular Digest readers know, the 10-year Treasury yield is single most important number in the global financial market. The higher it climbs, the more pressure it puts on most stock prices (and Bitcoin’s price) because a higher yield means a higher discount rate, which lowers the current valuation of a stock.

This week, as scared investors rotated out of stocks into bonds, all that buying pressure pushed prices higher…which drove yields lower.

Yesterday, the 10-year Treasury yield touched 4.28%, its lowest level since December. It’s only slightly higher at 4.30% as I write. And if legendary investor Louis Navellier is right, it will be heading even lower when the Fed cuts rates more than expected later this year.

From Louis’ Growth Investor Flash Alert podcast:

The 10-year Treasury yield is down under 4.3%, so that’s very bullish.

So, now everybody’s expecting at least two Fed rate cuts. You’re going to have four this year, folks, because things are so bad in Europe that the central banks there are going to be cutting at least four to five more times, in addition to the rate cuts they’ve already had this year.

In past podcasts, Louis has clarified that global central banks often move in parallel fashion. So, Louis believes outsized cuts from the ECB is likely to put pressure on the Fed to make similar cuts.

Now, as you’ll see below, this is not what Wall Street currently predicts.

The CME Group’s FedWatch Tool puts the heaviest odds (33.2%) on just two quarter-point rate cuts by December.

Chart showing the CME Group’s FedWatch Tool puts the heaviest odds (33.2%) on just two quarter-point rate cuts by December.

Source: CME Group

So, four quarter-point cuts would certainly surprise Wall Street.

The question is “would that be a good or bad surprise?”

After all, while one interpretation is bullish…

“Four quarter-point rate-cuts? Wow, this will juice the economy and take pressure off stock valuations! Time to buy stocks.”

But a second interpretation is bearish…

“Four quarter-point rate-cuts? Wow, how bad is the economy that the Fed is slashing rates 100 basis points despite the lingering threat of reinflation? Time to sell stocks.”

We’ll be watching.

Returning to that asterisk from above…

How did Nvidia earnings come in?

Depending on when you read this, Nvidia may have already reported earnings after the closing bell.

Did they beat? Is guidance bullish?

If so, coming full circle to the top of today’s Digest, we’re likely in for a continuation of the bounce off the 100-day MA tomorrow.

But if earnings disappoint, we’re likely losing the 100-day MA.

Now, even if Nvidia stumbles and the market falls in the morning, Keith Kaplan, the CEO of our corporate partner, TradeSmith, believes a melt-up is coming over the next 12 months. And that would mean a pullback tomorrow could present some fantastic buying opportunities.

From Keith:

The markets today are frothy, to be sure, but our indicators are still very much bullish.

So, I’m staying fully invested, but I’m much more regimented than I’ve ever been when it comes to investing.

As we’ve been covering here in the Digest over the last week, tomorrow evening at 8 PM Eastern, Keith is holding a live event called The Last Meltup.

He’ll be explaining why he sees stocks moving higher over the coming months, as well as a suite of investment tools we’ve profiled this week that have helped Keith be “much more regimented,” as he just noted.

As to the possibility of a melt-up, TradeSmith uses algorithms to spot repeating patterns in decades worth of stock market data. And today, it’s flagging a rare pattern that hasn’t been seen in 30 years.

It’s only been seen twice before going back to 1900 – in 1966 and 1925. And it signals a type of melt-up that creates hyper-exaggerated gains (though brutal losses when the fireworks are over).

The last time this happened, you could have made 9,731% from a leading software company… 28,894% from a robotic visionary… 70,626% from an internet services company… and 91,863% from a consumer electronics stock.

But on the other side of those gains was a market freefall that you wanted to avoid.

Keith will cover all this tomorrow, illustrating how to benefit from the ride up while sidestepping the worst of the elevator shaft down.

We’ll keep you updated on all these stories here in the Digest.

Have a good evening,

Jeff Remsburg


Source link