Investors Are Gripped by Fear and Distrust, But Hold Onto Favorite Stocks


A stock market correction, mixed messages on the future of economic policy from the White House, and a plunge in consumer confidence have driven individual investor sentiment and expectations to their lowest levels in years.

According to our recent survey of individual investors, 61% of respondents are either “worried” or “somewhat worried” about recent market events, with over 40% expecting another significant drop of 10% or more for the S&P 500 in the next three months. One-third of respondents are responding to recent market events by investing less in the stock market and 26% are investing more in money market funds

While the fear is real, our readers report they still own their favorite stocks, including popular names like Nvidia (NVDA), Apple (AAPL), Amazon (AMZN), and Microsoft (MSFT). Retail investors have pumped close to $70 billion into U.S. equities and exchange-traded funds so far this year, according to VandaTrack data cited by the Financial Times. That’s way above their monthly average, even as the S&P 500 fell into a correction, and some of the largest stocks lost trillions of dollars in value.

Tariff Uncertainty and Recession Fears Top Worries

Tariffs and reciprocal tariffs against the U.S. lead the long list of investor worries, with nearly three-quarters of respondents listing them as their top concern. The lack of clear and consistent economic and foreign policy from the White House permeates investors’ concerns, as worries about a potential recession, inflation, U.S. relations with China, and weaker corporate profits round out the top five, according to the survey. While the president, the Treasury secretary and even the Federal Reserve have suggested any impact from tariffs could be transient, and create a one-time price adjustment, many investors fear the worst. Three-quarters of respondents now think there is at least a 50/50 chance of a recession in the next 12 months. 

Trust in Government and the Stock Market Plunges

At the heart of investors’ concerns about the safety of their investments is their trust in the current administration. Half of respondents expect the policies enacted and proposed by the Trump administration will hurt their investments over the next four years, while just 25% believe they will benefit. Nearly half, or 48%, say they trust the stock market less under the current administration, and just 37% believe the stock market will deliver returns of 5% or better over the next four years. That’s a drop of twenty percentage points from our survey results in February.

Where Are Fearful Investors Retreating?

Investors seeking safety or diversification amid the recent selloff found it in money market funds, where 26% of respondents say they have been investing more, followed by ETFs, stocks outside the U.S., and Certificates of Deposit.

Looking out over the next four years, one-third of respondents favor U.S. stocks as the asset with the best potential, followed by stocks outside the U.S., gold, private equity, and cryptocurrencies. 

What Would You Do With an Extra $10,000?

If our readers had an extra $10,000 on hand, individual stocks still remain their top investment choice, followed by ETFs. But enthusiasm for both has waned since February, while money market funds and CDs have gained in popularity as yields have remained strong. 

Paying down debt also climbed the list of what some readers would do with an extra $10,000, which may be another sign that individuals and households are feeling the burden of rising costs of living

Investopedia Readers’ Favorite Stocks

Individual investors remain fairly consistent with their equity portfolio holdings. Nvidia remains the most widely held stock among respondents, with over 40% indicating they still hold the chipmaker’s stock, which has fallen nearly 20% from its recent all-time high. Apple, Microsoft, Amazon, and Alphabet (GOOGL), round out the top five, which has been pretty consistent for several years. Tesla (TSLA) is no longer among their top ten as shares of the automaker have declined 40% from recent highs. 

Nvidia or Die!

Not only is Nvidia our readers’ top holding, it’s also the stock they would buy and hold for the next ten years. Warren Buffett’s Berkshire Hathaway (BRK.ABRK.B), is their second choice, proving that diversification and value investing are still alive and well today. It’s also the stock readers would buy today and hold long-term. 


Source link

20 Undervalued High-Dividend Stocks With P/E Ratios As Low As 4.0


Updated on March 25th, 2025 by Bob Ciura

Stocks with low P/E ratios can offer attractive returns if their valuation multiples expand.

And when a low P/E stock also has a high dividend yield, investors get ‘paid to wait’ for the valuation multiple to increase.

We define a high-yield stock as one with a current dividend yield of 5% or higher.

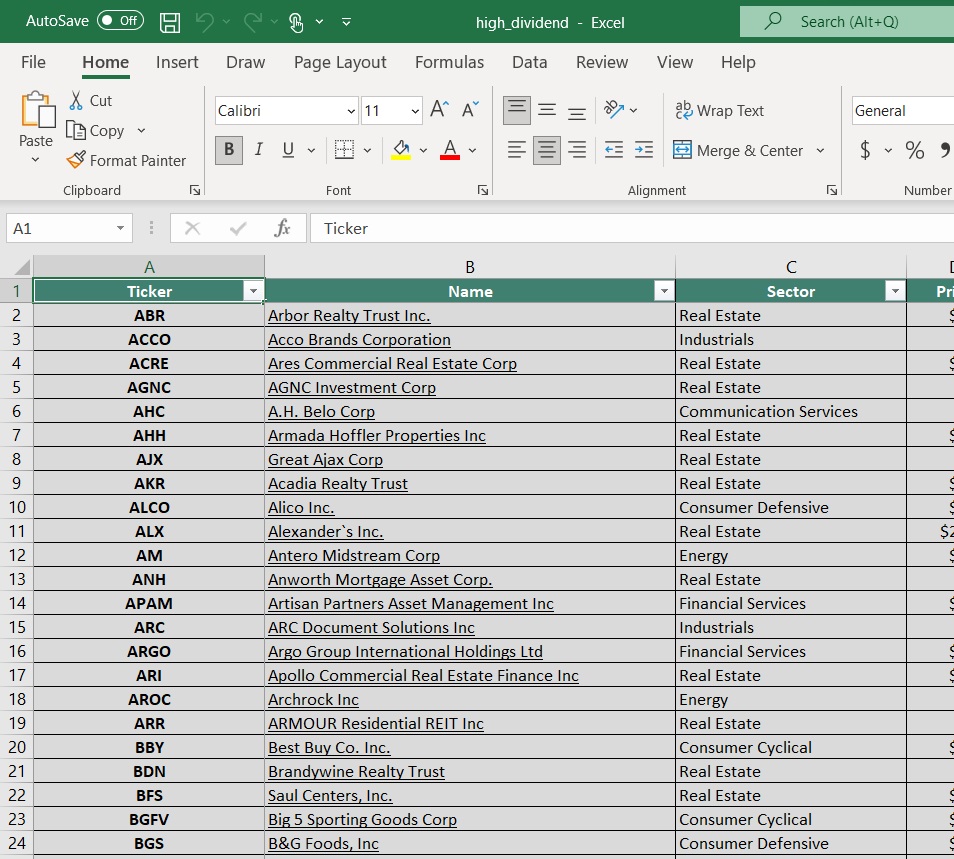
The free high dividend stocks list spreadsheet below has our full list of individual securities (stocks, REITs, MLPs, etc.) with with 5%+ dividend yields.

You can download a free copy by clicking on the link below:


In this research report, we discuss the prospects of 20 undervalued high dividend stocks, which are currently trading at P/E ratios under 10 and are offering dividend yields above 5.0%.

International stocks were excluded from this report.

We have ranked the stocks by P/E ratio, from lowest to highest. For REITs, we use P/FFO in place of the P/E ratio. And for MLPs, we use P/DCF (which is distributable cash flows).

These are comparable metrics similar to earnings for common stocks.

These 20 dividend stocks have not been screened for dividend safety. Instead, these are the 20 most undervalued stocks in the Sure Analysis Research Database with high dividend yields.

Table of Contents

Keep reading to see analysis on these 20 undervalued high dividend stocks.

Undervalued High Dividend Stock #1: Shutterstock, Inc. (SSTK) – P/E ratio of 4.0

Shutterstock sells high-quality creative content for brands, digital media and marketing companies through its global creative platform.

Its platform hosts the most extensive and diverse collection of high-quality 3D models, videos, music, photographs, vectors and illustrations for licensing. The company reported $935 million in revenues last year.

On January 7th, 2025, Shutterstock announced it entered a merger agreement with Getty Images through a merger of equals. The combined company will retain the name Getty Images Holdings, Inc and trade on the NYSE under ticker GETY.

Getty Images shareholders will own roughly 54.6% of the entity and Shutterstock shareholders will own the remaining 45.3%. Shareholders of SSTK will receive $28.84870 of cash, or 9.17 shares of Getty Images plus $9.50 in cash per share.

The combined company would have revenue between $1,979 million and $1,993 million, 46% of it being subscription revenue. About $175 million of annual cost savings is forecast by the third year, with most of this expected after 1 to 2 years.

On January 27th, 2025, Shutterstock announced a $0.33 quarterly dividend, a 10% increase over the prior year.

On February 25th, 2025, Shutterstock published its fourth quarter results for the period ending December 31, 2024. While quarterly revenue grew by a solid 15% year-on-year, it missed analyst estimates by nearly $4 million.

Adjusted EPS of $0.67 decreased by 7%, and also missed analyst estimates by $0.18.

Click here to download our most recent Sure Analysis report on SSTK (preview of page 1 of 3 shown below):

Undervalued High Dividend Stock #2: ARMOUR Residential REIT (ARR) – P/E ratio of 4.4

ARMOUR Residential invests in residential mortgage-backed securities that include U.S. Government-sponsored entities (GSE) such as Fannie Mae and Freddie Mac.

It also includes Ginnie Mae, the Government National Mortgage Administration’s issued or guaranteed securities backed by fixed-rate, hybrid adjustable-rate, and adjustable-rate home loans.

Unsecured notes and bonds issued by the GSE and the US Treasury, money market instruments, and non-GSE or government agency-backed securities are examples of other types of investments.

Source: Investor presentation

On October 23, 2024, ARMOUR Residential REIT announced its unaudited third-quarter 2024 financial results, reporting a GAAP net income available to common stockholders of $62.9 million, or $1.21 per common share. The company generated a net interest income of $1.8 million and distributable earnings of $52.0 million, equivalent to $1.00 per common share.

ARMOUR achieved an average interest income of 4.89% on interest-earning assets and an interest cost of 5.51% on average interest-bearing liabilities. The economic net interest spread stood at 2.00%, calculated from an economic interest income of 4.44% minus an economic interest expense of 2.44%.

During the quarter, ARMOUR raised $129.4 million by issuing 6,413,735 shares of common stock through an at-the-market offering program and paid common stock dividends of $0.72 per share for Q3.

Click here to download our most recent Sure Analysis report on ARMOUR Residential REIT Inc (ARR) (preview of page 1 of 3 shown below):

Undervalued High Dividend Stock #3: AGNC Investment Corporation (AGNC) – P/E ratio of 4.5

American Capital Agency Corp is a mortgage real estate investment trust that invests primarily in agency mortgagebacked securities (or MBS) on a leveraged basis.

The firm’s asset portfolio is comprised of residential mortgage passthrough securities, collateralized mortgage obligations (or CMO), and nonagency MBS. Many of these are guaranteed by governmentsponsored enterprises.

Source: Investor Presentation

AGNC Investment Corp. reported strong financial results for the third quarter ended September 30, 2024. The company achieved a comprehensive income of $0.63 per common share, driven by a net income of $0.39 and other comprehensive income of $0.24 from marked-to-market investments.

Net spread and dollar roll income contributed $0.43 per share. The tangible net book value increased by $0.42 per share to $8.82, reflecting a 5.0% growth from the previous quarter.

AGNC declared dividends of $0.36 per share, resulting in a 9.3% economic return on tangible common equity, which includes both dividends and the increase in net book value.

Click here to download our most recent Sure Analysis report on AGNC Investment Corp (AGNC) (preview of page 1 of 3 shown below):

Undervalued High Dividend Stock #4: NewtekOne Inc. (NEWT) – P/E ratio of 5.4

Newtek Business Services Corp. was a business development company (BDC) specializing in providing financial and business services to the small- and medium-sized business market in the United States.

What makes NewTek a unique company is that a good portion of its income is derived from subsidiaries that provide a wide array of business services to its large client base.

The company also gets a significant amount of its income from being an issuer of SBA (Small Business Administration loans), which only very few BDCs are licensed to do. This is not your typical BDC that only generates income from interest rate spreads, but also from a much wider range of small business services.

On February 26th, 2025, Newtek released its Q4 and full-year results for the period ending December 31st, 2024. For the quarter, Newtek reported net income of $18.3 million, or diluted earnings per share (EPS) of $0.69, representing a 62.8% increase over the prior year. Net interest income increased to $11.3 million, up 36.1% from Q4 2023.

Its total assets reached $2.1 billion, marking a 50% rise year-over-year, with loans held for investment growing 23% to $991.4 million.

Newtek’s net interest margin was 2.80%, a slight increase from the prior year.

Additionally, the company’s Alternative Loan Program loan closings skyrocketed by 199% to $91.4 million. Newtek also achieved significant improvements in return on tangible common equity (ROTCE) and return on average assets (ROAA), reaching 31.8% and 4.1%.

Click here to download our most recent Sure Analysis report on NEWT (preview of page 1 of 3 shown below):

Undervalued High Dividend Stock #5: Western Union Company (WU) – P/E ratio of 5.8

The Western Union Company is the world leader in the business of domestic and international money transfers. The company has a network of approximately 550,000 agents globally and operates in more than 200 countries.

About 90% of agents are outside of the US. Western Union operates two business segments, Consumer-to-Consumer (C2C) and Other (bill payments in the US and Argentina).

Western Union reported mixed Q4 2024 results on February 4th, 2025. Revenue increased 1% and diluted GAAP earnings per share increased to $1.14 in the quarter, compared to $0.35 in the prior year on higher revenue and a $0.75 tax benefit on reorganizing the international operations.

Revenue rose, despite challenges in Iraq on higher Banded Digital transactions and Consumer Services volumes.

CMT revenue fell 4% year-over-year even with 3% higher transaction volumes. Branded Digital Money Transfer CMT revenues increased 7% as transactions rose 13%. Digital revenue is now 25% of total CMT revenue and 32% of transactions.

Consumer Services revenue rose 56% on new products and expansion of retail foreign exchange offerings. The firm launched a media network business, expanded retail foreign exchange, and grew retail money orders.

Click here to download our most recent Sure Analysis report on WU (preview of page 1 of 3 shown below):

Undervalued High Dividend Stock #6: AES Corp. (AES) – P/E ratio of 5.8

The AES (Applied Energy Services) Corporation was founded in 1981 as an energy consulting company. It now has businesses in 14 countries and a portfolio of approximately 160 generation facilities.

AES produces power through various fuel types, such as gas, renewables, coal, and oil/diesel. The company has more than 36,000 Gross MW in operation.

Source: Investor Presentation

The company is actively engaged in developing and acquiring new energy projects.

It currently has a backlog of 12.7 GW of renewables. AES expects to complete the majority of these projects through 2027.

AES Corporation reported fourth quarter results on February 28th, 2025, for the period ending December 31, 2024. Adjusted EPS decreased 26% to $0.54 for Q4 2024, but this still beat analyst estimates by $0.19.

For the full year, AES’ adjusted EPS rose 22% to $2.14 from $1.76 in 2023. The company constructed and acquired 3 GW of renewable energy in 2024, as well as constructed a 670 MW combined cycle gas plant in Panama.

Leadership initiated its 2025 guidance, expecting adjusted EPS of $2.10 to $2.26 for the full fiscal year.

Additionally, the company reaffirms its expectation it can grow EPS on average 7% to 9% through 2025 from a base year of 2020. It also expects annual EPS growth of 7% to 9% from 2023 through 2027.

Click here to download our most recent Sure Analysis report on AES (preview of page 1 of 3 shown below):

Undervalued High Dividend Stock #7: Ellington Credit Co. (EARN) – P/E ratio of 5.9

Ellington Credit Co. acquires, invests in, and manages residential mortgage and real estate related assets. Ellington focuses primarily on residential mortgage-backed securities, specifically those backed by a U.S. Government agency or U.S. governmentsponsored enterprise.

Agency MBS are created and backed by government agencies or enterprises, while non-agency MBS are not guaranteed by the government.

On March 12th, 2025, Ellington Residential reported its fourth quarter results for the period ending December 31, 2024. The company generated a net loss of $(2.0) million, or $(0.07) per share.

Ellington achieved adjusted distributable earnings of $7.8 million in the quarter, leading to adjusted earnings of $0.27 per share, which covered the dividend paid in the period.

Ellington’s net interest margin was 5.07% overall. At quarter end, Ellington had $31.8 million of cash and cash equivalents, and $79 million of other unencumbered assets.

Click here to download our most recent Sure Analysis report on EARN (preview of page 1 of 3 shown below):

Undervalued High Dividend Stock #8: Sunoco LP (SUN) – P/E ratio of 6.2

Sunoco is a master limited partnership that distributes a range of fuel products (wholesale and retail) and that is active in some adjacent industries such as pipelines.

The wholesale unit purchases fuel products from refiners and sells those products to both its own and independently owned dealers.

Source: Investor Presentation

Sunoco reported its fourth quarter earnings results in February. The company reported that its revenues totaled $5.3 billion during the quarter, which was 7% less than the revenues that Sunoco generated during the previous year’s quarter.

Fuel prices are mostly a flow through item for Sunoco, since Sunoco’s costs decline as well when fuel prices decline. Revenue changes thus do not necessarily impact profits to a large degree.

Sunoco reported that its adjusted EBITDA was up 86% year over year, improving to $439 million during the quarter. Distributable cash flows totaled $261 million during the quarter, which was higher compared to the previous year’s quarter, and which equated to DCF of $2.19 per share.

Click here to download our most recent Sure Analysis report on SUN (preview of page 1 of 3 shown below):

Undervalued High Dividend Stock #9: Macy’s Inc. (M) – P/E ratio of 6.4

Macy’s is a department store company that operates brick and mortar stores, as well as online stores under the Macy’s, Bloomingdale’s, and Bluemercury brands.

Macy’s reported its fourth quarter earnings results on March 6. The company reported that its revenues totaled $7.77 billion during the quarter, which was above what the analyst community forecasted, with the consensus estimate being beaten by $13 million. Macy’s revenues were down by 4% versus the previous year’s quarter.

Macy’s generated earnings-per-share of $1.80 during the fourth quarter, which represents a weaker result compared to the previous year’s period. Results faded in 2023 and 2024, relative to the two strong years we saw in 2021 and 2022.

For 2025, earnings-per-share are now forecasted to be between $2.05 and $2.25 according to management’s current guidance, which indicates that the company’s earnings-per-share will likely continue to pull back this year on the back of weaker consumer sentiment that hurts Macy’s business outlook.

Click here to download our most recent Sure Analysis report on M (preview of page 1 of 3 shown below):

Undervalued High Dividend Stock #10: Virtus Investment Partners (VRTS) – P/E ratio of 6.4

Virtus Investment Partners, Inc. is a distinctive partnership of boutique investment managers, singularly committed to the long-term success of individual and institutional investors.

The firm offers a diverse range of investment strategies across asset classes, including equity, fixed income, multi-asset, as well as alternative investments.

These strategies are available in multiple product forms, such as open-end mutual funds, closed-end funds, ETFs, retail separate accounts, and institutional accounts.

Virtus operates through a multi-manager model, partnering with affiliated managers and select unaffiliated sub-advisers, each maintaining distinct investment philosophies and processes.

This structure allows Virtus to offer clients access to specialized expertise and a broad array of solutions tailored to meet various financial objectives.

On January 31st, 2025, Virtus reported its Q4 and full-year results for the period ending December 31st, 2024. Total AUM fell by 5% sequentially to $175.0 billion due to net outflows in institutional accounts and U.S. retail funds, and negative market performance, partially offset by inflows in ETFs, global funds, and retail separate accounts.

Net outflows of ($4.8) billion worsened from ($1.7) billion in Q3, primarily due to a $3.3 billion lower-fee partial redemption of an institutional mandate.

However, adjusted EPS rose 8% to $7.50, driven by higher investment management fees and a soft increase in operating expenses. For FY2025, we expect adjusted EPS of $26.81.

Click here to download our most recent Sure Analysis report on VRTS (preview of page 1 of 3 shown below):

Undervalued High Dividend Stock #11: Horizon Technology Finance (HRZN) – P/E ratio of 7.0

Horizon Technology Finance Corp. is a BDC that provides venture capital to small and mediumsized companies in the technology, life sciences, and healthcareIT sectors.

The company has generated attractive riskadjusted returns through directly originated senior secured loans and additional capital appreciation through warrants.

Source: Investor Presentation

On March 4th, 2025, Horizon released its Q4 and full-year results for the period ending December 31st, 2024. For the quarter, total investment income fell 16.7% year-over-year to $23.5 million, primarily due to lower interest income on investments from the debt investment portfolio.

More specifically, the company’s dollar-weighted annualized yield on average debt investments in Q4 of 2024 and Q4 of 2023 was 14.9% and 16.8%, respectively.

Net investment income per share (IIS) fell to $0.27, down from $0.45 compared to Q4-2023. Net asset value (NAV) per share landed at $8.43, down from $9.06 sequentially.

Click here to download our most recent Sure Analysis report on HRZN (preview of page 1 of 3 shown below):

Undervalued High Dividend Stock #12: Energy Transfer LP (ET) – P/E ratio of 7.0

Energy Transfer owns and operates one of the largest and most diversified portfolios of energy assets in the United States.

Operations include natural gas transportation and storage along with crude oil, natural gas liquids, refined product transportation, and storage totaling 83,000 miles of pipelines.

Energy Transfer operates with a primarily fee-based model, which somewhat mitigates the sensitivity of the MLP to commodity prices.

In mid-February, Energy Transfer reported (2/11/25) financial results for the fourth quarter of fiscal 2024. The MLP continued to grow its volumes in all the segments. As a result, adjusted EBITDA grew 8% over the prior year’s quarter.

Energy Transfer maintained a healthy distribution coverage ratio of 1.8 and raised the quarterly distribution by 0.8%, on top of the distribution hikes in each of the twelve previous quarters.

Thanks to strong growth in the demand for its networks, Energy Transfer provided positive guidance for 2025, expecting adjusted EBITDA $16.1 to $16.5 billion. This guidance implies 5% growth at the mid-point.

Click here to download our most recent Sure Analysis report on ET (preview of page 1 of 3 shown below):

Undervalued High Dividend Stock #13: Ford Motor Company (F) – P/E ratio of 7.2

Ford Motor Company was first incorporated in 1903 and in the past 120 years, it has become one of the world’s largest automakers. It operates a large financing business as well as its core manufacturing division, which produces a popular assortment of cars, trucks, and SUVs.

Ford posted fourth quarter and full-year earnings on February 5th, 2025, and results were better than expected. Adjusted earnings-per-share came to 39 cents, which was seven cents ahead of estimates.

Revenue was up almost 5% year-over-year for the quarter to $48.2 billion, which also beat estimates by $5.37 billion. The fourth quarter was the highest revenue total the company has ever produced.

Ford Blue increased 4.2% to $27.3 billion in revenue for the fourth quarter, beating estimates of $25.9 billion. Model e revenue was down 13% year-over-year to $1.4 billion, $400 million less than expected.

Ford Pro revenue was up 5.3% to $16.2 billion, beating estimates for $15.6 billion.

For this year, Ford expects full-year adjusted EBIT of $7 to $8.5 billion, and for adjusted free cash flow of $3.5 billion to $4.5 billion, with capex of $8 to $9.5 billion.

Click here to download our most recent Sure Analysis report on Ford (preview of page 1 of 3 shown below):

Undervalued High Dividend Stock #14: Canandaigua National Corporation (CNND) – P/E ratio of 7.2

Canandaigua National Corporation (CNC) is the parent company of The Canandaigua National Bank & Trust Company (CNB) and Canandaigua National Trust Company of Florida (CNTF).

The company offers a wide range of financial services, including banking, lending, mortgage services, trust, investment management, and insurance.

With 23 branches across its service areas, CNC is focus on serving local communities by providing personalized financial solutions to individuals, businesses, and municipalities. CNC emphasizes community banking, focusing on reinvesting in the local economy through a diverse lending portfolio.

Moving forward, we expect CNC’s EPS to grow at a CAGR of 5%. Note that the company has increased its dividend every year since 2002, marking 22 years of consecutive annual dividend increases.

Click here to download our most recent Sure Analysis report on CNND (preview of page 1 of 3 shown below):

Undervalued High Dividend Stock #15: Midland States Bancorp (MSBI) – P/E ratio of 7.2

Midland States Bancorp (MSBI) is the holding company of Midland States Bank, a community bank that was founded in 1881 and is headquartered in Effingham, Illinois.

It operates 53 branches in Illinois and Missouri and provides a wide range of banking products and services to individuals, businesses, municipalities and other entities. Midland States Bancorp has total assets of $7.5 billion.

In late January, Midland States Bancorp reported (1/23/25) results for the fourth quarter of fiscal 2024. Its net interest margin expand sequentially from 3.10% to 3.19% and its net interest income grew 2%.

However, the bank incurred massive charge-offs on loans ($103 million) and provisions for loan losses ($93.5 million).

As a result, it switched from earnings-per-share of $0.74 to an excessive loss per share of -$2.52, missing the analysts’ consensus by $3.19.

Midland States Bancorp has acquired seven smaller banks since 2009. As a result, it grew its asset base by 12% per year on average over the last nine years.

It had also grown its earnings-per-share by 6.9% per year on average during 2015-2023 but it incurred a loss in 2024 due to massive loan charge-offs and high deposit costs, which resulted from high interest rates.

Click here to download our most recent Sure Analysis report on MSBI (preview of page 1 of 3 shown below):

Undervalued High Dividend Stock #16: Plains All American LP (PAA) – P/E ratio of 7.6

Plains All American Pipeline, L.P. is a midstream energy infrastructure provider. The company owns an extensive network of pipeline transportation, terminaling, storage, and gathering assets in key crude oil and natural gas liquids-producing basins at major market hubs in the United States and Canada.

Source: Investor Presentation

On February 7th, 2025, Plains All American posted its Q4 and full-year results for the period ending December 31st, 2024.

For the quarter, revenues came in at $12.4 billion, down 2.3% compared to last year. Adjusted EBITDA from crude oil increased by 1% year-over-year, primarily due to higher tariff volumes on its pipelines, tariff escalations and contributions from acquisitions.

Adjusted EBITDA from NGL declined 9% year-over-year results primarily due to lower weighted average frac spreads in the fourth quarter of 2024.

Click here to download our most recent Sure Analysis report on PAA (preview of page 1 of 3 shown below):

Undervalued High Dividend Stock #17: Peoples Financial Services (PFIS) – P/E ratio of 7.8

Peoples Financial Services (PFIS) is the holding company of Peoples Security Bank and Trust Company, a community bank that was founded in 1905 and is headquartered in Scranton, Pennsylvania.

It operates 44 branches in Pennsylvania and provides various banking products and services to consumers, municipalities and businesses.

On July 1st, 2024, Peoples Financial Services completed its acquisition of FNCB Bancorp in an all-stock deal. As per the terms of the deal, the shareholders of FNCB now own ~29% of the combined entity.

Thanks to the merger, the bank grew its total assets from $3.7 billion to $5.5 billion and thus it became the 5th largest community bank in Pennsylvania.

In early February, Peoples Financial Services reported (2/6/24) financial results for the fourth quarter of fiscal 2024. Loans and deposits grew 40% and 28%, respectively, over the prior year’s quarter, thanks to the acquisition of FNCB Bancorp.

Net interest margin expanded impressively, from 2.30% in the prior year’s quarter to 3.25% thanks to the much higher net interest margin of the acquired bank.

Click here to download our most recent Sure Analysis report on PFIS (preview of page 1 of 3 shown below):

Undervalued High Dividend Stock #18: Prospect Capital (PSEC) – P/E ratio of 7.9

Prospect Capital Corporation is a Business Development Company, or BDC, that provides private debt and private equity to middlemarket companies in the U.S.

The company focuses on direct lending to owneroperated companies, as well as sponsorbacked transactions. Prospect invests primarily in first and second lien senior loans and mezzanine debt, with occasional equity investments. 

Source: Investor Presentation

Prospect posted second quarter earnings on February 10th, 2025, and results were somewhat weak. Net investment income per-share acme to 20 cents, while total investment income fell from $211 million to $185 million year-over-year.

NII per-share fell from 21 cents in Q1, and 24 cents from the year-ago period. Total interest income was $169 million for the quarter, down from $185 million in the prior quarter, and $195 million a year ago. It also missed estimates by about $2 million.

Click here to download our most recent Sure Analysis report on PSEC (preview of page 1 of 3 shown below):

Undervalued High Dividend Stock #19: Delek Logistics Partners LP (DLK) – P/E ratio of 7.9

Delek Logistics Partners, LP is a publicly traded master limited partnership (MLP) headquartered in Brentwood, Tennessee.

Established in 2012 by Delek US Holdings, Inc. (NYSE: DK), Delek Logistics owns and operates a network of midstream energy infrastructure assets.

These assets include approximately 850 miles of crude oil and refined product transportation pipelines and a 700-mile crude oil gathering system, primarily located in the southeastern United States and west Texas.

The company’s operations are integral to Delek US’s refining activities, particularly supporting refineries in Tyler, Texas, and El Dorado, Arkansas.

Delek Logistics provides services such as gathering, transporting, and storing crude oil, as well as marketing, distributing, and storing refined products for both Delek US and third-party customers.

On February 25, 2025, Delek Logistics Partners (DKL) reported its financial results for the fourth quarter of 2024. The company achieved an adjusted EBITDA of approximately $107.2 million, an increase from $100.9 million in the same period of the previous year.

Distributable cash flow was $69.5 million, with a coverage ratio of approximately 1.2 times. The Gathering and Processing segment saw an adjusted EBITDA of $66 million, up from $53.3 million in Q4 2023, primarily due to higher throughput from Permian Basin assets and contributions from the H2O Midstream acquisition.

Click here to download our most recent Sure Analysis report on DKL (preview of page 1 of 3 shown below):

Undervalued High Dividend Stock #20: Hooker Furnishings Corporation (HOFT) – P/E ratio of 7.9

Hooker Furnishings is a designer, marketer and importer of casegoods (wooden and metal furniture), leather furniture, fabric-upholstered furniture, lighting, accessories and home décor for residential, hospitality and contract markets.

The company also domestically manufactures premium residential custom leather and fabric-upholstered furniture.

Hooker Furnishings is the largest supplier of casegoods and upholstery in the U.S. and has access to more than 75% of all retail furniture distribution.

Source: Investor Presentation

In early December, Hooker Furnishings reported (12/5/24) financial results for the third quarter of fiscal 2025. Net sales decreased -11% over the prior year’s quarter due to sustained headwinds in the housing market and loss of sales due to the bankruptcy of a customer.

The combination of high interest rates and high home prices have been exerting pressure on the business of Home Furnishings over the last two years.

As a result, the company switched from earnings-per-share of $0.65 to a loss per share of -$0.39 and missed the analysts’ consensus by a massive $0.67.

Click here to download our most recent Sure Analysis report on HOFT (preview of page 1 of 3 shown below):

Final Thoughts

All the above stocks are trading at remarkably cheap valuation levels due to some business headwinds. Some of them have been hurt by high inflation or the latest economic slowdown whereas others are facing their own specific issues.

Moreover, all the above stocks are offering dividend yields above 5%. As a result, they make it much easier for investors to wait patiently for the business headwinds to subside.

If you are interested in finding high-quality dividend growth stocks and/or other high-yield securities and income securities, the following Sure Dividend resources will be useful:

High-Yield Individual Security Research

Other Sure Dividend Resources

Thanks for reading this article. Please send any feedback, corrections, or questions to [email protected].


Source link

Wynn Resorts Stock Rises as Billionaire Investor Tilman Fertitta Increases Stake


Key Takeaways

  • Shares of Wynn Resorts advanced Tuesday as billionaire and top stakeholder Tilman Fertitta purchased more shares.
  • A security filing showed that this week Fertitta picked up 16,500 shares, while one of the companies he owns, Hospitality Headquarters, added 1.68 million shares.
  • Fertitta’s Fertitta Entertainment has a wide-ranging portfolio of firms, as well as the Houston Rockets NBA team.

Wynn Resorts (WYNN) shares gained Tuesday as the hotel and casino operator’s largest shareholder, billionaire Tilman Fertitta, expanded his stake in the company.

A securities filing showed Fertitta purchased 16,500 shares of Wynn on March 21 and March 24, with a price range of $80.99 to $84.93 per share, totaling approximately $1.38 million.

In addition, Hospitality Headquarters, part of Fertitta’s Fertitta Entertainment conglomerate, bought 1.68 million shares for $85.73 each on March 24, valued at about $143.3 million, in a share option transaction.

Fertitta Owns Several Golden Nugget Casinos, NBA’s Houston Rockets

Fertitta, whose wide-ranging investments under the Fertitta Entertainment umbrella include several Golden Nugget casinos, reportedly became Wynn’s top shareholder last November, when he increased his ownership to 9.9%. Fertitta also owns Landry’s, Del Frisco’s, and several other restaurants, as well as the National Basketball Association’s (NBA) Houston Rockets. 

Shares of Wynn Resorts pared earlier gains and were up 2% in recent trading. They have lost about 13% of their value over the past year.

TradingView


Source link

Shell Plans to Boost Upstream, Gas Business, May Sell Chemical Assets


KEY TAKEAWAYS

  • Shell said it is planning to grow its upstream and integrated gas business by 1% annually through 2030, a month after rival BP announced it would invest more in oil and gas in a pivot away from its low-carbon strategy
  • Shell also raised the potential of selling its chemical assets as part of its efforts to improve returns.
  • Shell also said it wants to expand liquefied natural gas (LNG) sales by between 4% and 5% yearly through to 2030.

Shell (SHEL) said it is planning to grow its upstream and integrated gas business by 1% annually through 2030,  a month after rival  BP (BP) announced it would invest more in oil and gas in a pivot away from its low-carbon strategy.

Shell said the increase in its upstream and integrated gas business would allow it to sustain its “1.4 million barrels per day of liquids production to 2030 with increasingly lower carbon intensity.” The London-based company also said it wants to expand liquefied natural gas (LNG) sales by between 4% and 5% yearly through to 2030.

Shell also raised the potential of selling its chemical assets as part of its efforts to improve returns. The company said it would explore “strategic and partnership opportunities” for its U.S. chemicals operations and look into “high-grading and selective closures in Europe.”

‘‘We want to become the world’s leading integrated gas and LNG business and the most customer-focused energy marketer and trader, while sustaining a material level of liquids production,” CEO Wael Sawan said. 

Shell’s U.S.-listed shares are gaining more than 1.5% in premarket trading Tuesday and have risen almost 7% in the past 12 months through Monday.


Source link

Watch These MicroStrategy Price Levels as Stock Jumps After Latest Bitcoin Purchase


Key Takeaways

  • MicroStrategy shares jumped more than 10% on Monday, adding to recent gains following the stock’s recent correction.
  • The software firm purchased an additional 6,911 bitcoins between March 17 and March 23, takings its holding to over 500,000 BTC, according to a regulatory filing.
  • After initially finding buying interest at the 200-day moving average in recent weeks, the price closed above the 50-day MA on Monday, potentially setting the stage for a continuation of the stock’s longer-term trend higher.
  • Investors should watch major overhead areas on MicroStrategy’s chart around $383, $543, and $870, while also monitoring key support levels near $232 and $180.

MicroStrategy (MSTR) shares jumped more than 10% on Monday, adding to recent gains following the stock’s recent correction.

Shares in the company, which is the world’s largest corporate holder of bitcoin, received a boost after a regulatory filing on Monday revealed that the software firm had purchased an additional 6,911 bitcoins between March 17 and March 23, takings its holding to over 500,000 BTC. MicroStrategy’s accumulation of the digital currency, which began in 2020, has shown no signs of slowing.

Shares of MicroStrategy, which does business under the name Strategy, have gained 16% since the start of the year as of Monday’s close and have more than doubled over the past 12 months as investors turn to the stock as a leveraged Bitcoin bet. The stock rose 10.4% to $335.72 on Monday as the price of bitcoin moved higher.

Below, we break down the technicals on MicroStrategy’s chart and point out major price levels worth watching out for.

Buyers Emerge at 200-Day Moving Average

After retracing to the closely watched 200-day moving average, MicroStrategy shares traded sideways for several weeks before finding renewed buying interest.

More recently, the stock closed above the 50-day MA on Monday, potentially setting the stage for a continuation of the stock’s longer-term uptrend.

Meanwhile, the relative strength index (RSI) flashes a reading above 50 to signal bullish price momentum, but also sits below overbought levels, providing the stock with ample room to test higher prices.

Let’s apply technical analysis to identify major overhead areas on MicroStrategy’s chart that investors may be monitoring and also point out support levels worth watching during possible pullbacks in the stock.

Major Overhead Areas to Monitor

The first overhead area to eye sits around $383. The shares could run into selling pressure at this level near a series of peaks and troughs that formed on the chart between mid-November and late January.

Buying above this level could put the wheels in motion for a rally to the $543 area. Investors who accumulated shares during the stock’s retracement may look to lock in profits near the all-time high (ATH) set in November last year.

Investors can project an overhead target above the ATH by using the bars pattern tool. This works by extracting the stock’s trending move from September to November last year and repositioning it at the 200-day MA, the same indicator the prior move higher started from. This analysis forecasts a target of around $870 and indicates a new trend higher may last until late May if price action rhymes.

Key Support Levels Worth Watching

During pullbacks, investors should initially watch the $232 level, a location on the chart where the shares may encounter support near the early-November profit-taking low and recent troughs in February and March.

Finally, a more significant drop could see MicroStrategy shares revisit lower support around $180. Investors may seek buying opportunities at this level near a horizontal line that links multiple prominent peaks on the chart between March and July last year.

The comments, opinions, and analyses expressed on Investopedia are for informational purposes only. Read our warranty and liability disclaimer for more info.

As of the date this article was written, the author does not own any of the above securities.


Source link

2025 Microcap Stocks List | See The 10 Best Microcap Stocks Now


Published on March 24th, 2025 by Bob Ciura
Spreadsheet data updated daily

Micro-cap stocks are publicly-traded companies with market capitalizations between $50 million and $300 million. These represent the smallest companies in the stock market.

The total number of micro-cap stocks varies depending upon market conditions. Right now there are hundreds of micro-cap stocks, so there are plenty for investors to choose from.

As the smallest stocks, micro-caps could have stronger growth potential over the long run than large-cap stocks or mega-cap stocks.

At the same time, micro-cap stocks carry a number of unique risk factors to consider.

You can download a free spreadsheet of all 1400+ micro cap stocks right now (along with important financial metrics such as price-to-earnings ratios and dividend yields) by clicking on the link below:


The downloadable micro-cap stocks list above was curated from two leading micro-cap stock ETFs:

  1. iShares Micro-Cap ETF (IWC)
  2. First Trust Dow Jones Select Micro-Cap Index Fund (FDM)

This article includes a spreadsheet and table of all of our micro-cap stocks, as well as detailed analysis on our Top 10 micro-cap stocks today.

Keep reading to see the 10 best micro-cap stocks analyzed in detail.

The 10 Best Micro Cap Stocks Today

Now that we’ve defined what a micro-cap stock is, let’s take a look at the 10 best micro-cap stocks, as defined by our Sure Analysis Research Database.

The database ranks total expected annual returns, combining current yield, forecast earnings growth and any change in price from the valuation.

Note:  The Sure Analysis Research Database is focused on income producing securities. As a result, we do not track or rank securities that don’t pay dividends. Micro-cap stocks that don’t pay dividends were excluded from the Top 10 rankings below.

We’ve screened the micro-cap stocks with the highest 5-year expected returns and have provided them below, ranked from lowest to highest.

You can instantly jump to any individual stock analysis by using the links below:

Micro Cap Stock #10: ChoiceOne Financial Services (COFS)

  • 5-year expected annual returns: 14.5%

ChoiceOne Financial Services is the holding company for ChoiceOne Bank, which is headquartered in Sparta, Michigan.

Founded in 1898, ChoiceOne Bank has grown to a bank with a full range of financial services. It operates 37 offices and offers a variety of deposit, payment, credit and other financial services to all types of customers.

These services include time, savings, and demand deposits, safe deposit services, and automated transaction machine services. The bank also offers loans to consumers and corporations.

In late January, ChoiceOne Financial Services reported (1/22/25) results for the fourth quarter of 2024. Net interest income grew 16% over the prior year’s quarter, as net interest margin expanded from 2.66% to 2.98%, despite higher costs of deposits. In addition, the bank grew its loans and deposits by 8% and 4%, respectively.

As a result, earnings-per-share grew 19%, from $0.70 to $0.83, though they missed the analysts’ consensus by $0.01. We expect net interest margin to expand further and thus we expect all-time high earnings-per-share of $3.60 this year.

Click here to download our most recent Sure Analysis report on COFS (preview of page 1 of 3 shown below):

Micro Cap Stock #9: Midland States Bancorp (MSBI)

  • 5-year expected annual returns: 14.7%

Midland States Bancorp (MSBI) is the holding company of Midland States Bank, a community bank that was founded in 1881 and is headquartered in Effingham, Illinois.

It operates 53 branches in Illinois and Missouri and provides a wide range of banking products and services to individuals, businesses, municipalities and other entities. Midland States Bancorp has total assets of $7.5 billion.

In late January, Midland States Bancorp reported (1/23/25) results for the fourth quarter of fiscal 2024. Its net interest margin expand sequentially from 3.10% to 3.19% and its net interest income grew 2%.

However, the bank incurred massive charge-offs on loans ($103 million) and provisions for loan losses ($93.5 million).

As a result, it switched from earnings-per-share of $0.74 to an excessive loss per share of -$2.52, missing the analysts’ consensus by $3.19.

Midland States Bancorp has acquired seven smaller banks since 2009. As a result, it grew its asset base by 12% per year on average over the last nine years.

It had also grown its earnings-per-share by 6.9% per year on average during 2015-2023 but it incurred a loss in 2024 due to massive loan charge-offs and high deposit costs, which resulted from high interest rates.

Click here to download our most recent Sure Analysis report on MSBI (preview of page 1 of 3 shown below):

Micro Cap Stock #8: Oak Valley Bancorp (OVLY)

  • 5-year expected annual returns: 15.9%

Oak Valley Bancorp is a regional banking holding company based in Oakdale, California, operating through its subsidiary, Oak Valley Community Bank. It provides a range of financial services including commercial and consumer loans, deposit accounts, and investment services.

On January 24th, 2025, Oak Valley posted its Q4 and full-year results for the period ending December 31st, 2024. For the period, net interest income came in at $17.8 million, compared to $17.7 million in the previous quarter and $17.9 million last year.

The decline over last year was due to higher deposit interest expense, as the average cost of funds rose to 0.78% in 2024 from 0.28% in 2023. This higher interest expense was partly offset by year-over-year loan growth of $90.0 million (8.8%).

The net interest margin for the quarter was 4.00%, down from 4.07% in Q3-2024 and 4.15% in Q4-2023. Still, it remains quite high.

For the quarter, earnings per share (EPS) came in at $0.73, up one cent compared to last year. For the year, EPS was $3.04. For FY2025, we expect EPS of about $3.20.

Click here to download our most recent Sure Analysis report on OVLY (preview of page 1 of 3 shown below):

Micro Cap Stock #7: First United Corporation (FUNC)

  • 5-year expected annual returns: 15.9%

First United Corporation is a financial services holding company based in Oakland, Maryland. Through its subsidiary, First United Bank & Trust, it runs 22 branches located across Maryland, West Virginia, Virginia, and Pennsylvania.

The bank provides a full range of financial services, such as personal and commercial banking, wealth management, and insurance solutions.

Its lending portfolio spans residential and commercial real estate, construction, and small business loans. As at the end of the fourth quarter of 2024, the bank had $2.0 billion in assets and $1.6 billion in deposits. Last year, the bank generated $92.0 million in interest income.

On February 5th, 2025, First United reported its Q4 and full-year results for the period ending December 31st, 2024. The bank posted net income of $6.2 million, up from $1.8 million last year, while EPS came in at $0.95 up from $0.26 in Q4 2024. This was driven by strong loan growth, higher net interest income, and disciplined expense management.

Click here to download our most recent Sure Analysis report on FUNC (preview of page 1 of 3 shown below):

Micro Cap Stock #6: Peoples Financial (PFIS)

  • 5-year expected annual returns: 16.1%

Peoples Financial Services (PFIS) is the holding company of Peoples Security Bank and Trust Company, a community bank that was founded in 1905 and is headquartered in Scranton, Pennsylvania.

It operates 44 branches in Pennsylvania and provides various banking products and services to consumers, municipalities and businesses.

On July 1st, 2024, Peoples Financial Services completed its acquisition of FNCB Bancorp in an all-stock deal. As per the terms of the deal, the shareholders of FNCB now own ~29% of the combined entity.

Thanks to the merger, the bank grew its total assets from $3.7 billion to $5.5 billion and thus it became the 5th largest community bank in Pennsylvania.

In early February, Peoples Financial Services reported (2/6/24) financial results for the fourth quarter of fiscal 2024. Loans and deposits grew 40% and 28%, respectively, over the prior year’s quarter, thanks to the acquisition of FNCB Bancorp.

Net interest margin expanded impressively, from 2.30% in the prior year’s quarter to 3.25% thanks to the much higher net interest margin of the acquired bank.

Click here to download our most recent Sure Analysis report on PFIS (preview of page 1 of 3 shown below):

Micro Cap Stock #5: Orrstown Financial Services (ORRF)

  • 5-year expected annual returns: 16.4%

Orrstown Financial Services, Inc. is a community bank. ORRF serves as the holding company for its operating bank subsidiary, Orrstown Bank.

The company provides banking and financial advisory services to customers located in the south-central Pennsylvania counties of Berks, Cumberland, Dauphin, Franklin, Lancaster, Perry, and York. ORRF also serves customers in Anne Arundel, Baltimore, Howard, and Washington counties in Maryland.

Its savings products include money market accounts, savings accounts, certificates of deposit, and checking accounts. Loan products offered consist of residential mortgages, home equity lines of credit, commercial mortgages, construction loans, and commercial loans.

Financial advisory services provided include fiduciary, investment advisory, and brokerage services.

On January 31st, ORRF released its financial results for the fourth quarter ended December 31st. The company’s net interest income soared 94.4% over the year-ago period to $50.6 million during the quarter, which was mostly due to the acquisition of Codorus Valley Bancorp. The other tailwind for ORRF was a 34-basis point year-over-year expansion in the net interest margin to 4.05% in the quarter.

Thanks to the acquisition, the company’s noninterest income also surged 73.3% over the year-ago period to $11.2 million for the quarter. ORRF’s adjusted diluted EPS edged 4.8% higher year-over-year to $0.87 during the quarter.

Click here to download our most recent Sure Analysis report on ORRF (preview of page 1 of 3 shown below):

Micro Cap Stock #4: Hooker Furnishings (HOFT)

  • 5-year expected annual returns: 16.5%

Hooker Furnishings is a designer, marketer and importer of casegoods (wooden and metal furniture), leather furniture, fabric-upholstered furniture, lighting, accessories and home décor for residential, hospitality and contract markets.

The company also domestically manufactures premium residential custom leather and fabric-upholstered furniture.

Hooker Furnishings is the largest supplier of casegoods and upholstery in the U.S. and has access to more than 75% of all retail furniture distribution.

Source: Investor Presentation

In early December, Hooker Furnishings reported (12/5/24) financial results for the third quarter of fiscal 2025. Net sales decreased -11% over the prior year’s quarter due to sustained headwinds in the housing market and loss of sales due to the bankruptcy of a customer.

The combination of high interest rates and high home prices have been exerting pressure on the business of Home Furnishings over the last two years.

As a result, the company switched from earnings-per-share of $0.65 to a loss per share of -$0.39 and missed the analysts’ consensus by a massive $0.67.

Click here to download our most recent Sure Analysis report on HOFT (preview of page 1 of 3 shown below):

Micro Cap Stock #3: Ellington Credit Co. (EARN)

  • 5-year expected annual returns: 18.2%

Ellington Credit Co. acquires, invests in, and manages residential mortgage and real estate related assets. Ellington focuses primarily on residential mortgage-backed securities, specifically those backed by a U.S. Government agency or U.S. governmentsponsored enterprise.

Agency MBS are created and backed by government agencies or enterprises, while non-agency MBS are not guaranteed by the government.

On March 12th, 2025, Ellington Residential reported its fourth quarter results for the period ending December 31, 2024. The company generated a net loss of $(2.0) million, or $(0.07) per share.

Ellington achieved adjusted distributable earnings of $7.8 million in the quarter, leading to adjusted earnings of $0.27 per share, which covered the dividend paid in the period.

Ellington’s net interest margin was 5.07% overall. At quarter end, Ellington had $31.8 million of cash and cash equivalents, and $79 million of other unencumbered assets.

Click here to download our most recent Sure Analysis report on EARN (preview of page 1 of 3 shown below):

Micro Cap Stock #2: Clipper Realty (CLPR)

  • 5-year expected annual returns: 19.5%

Clipper Realty is a Real Estate Investment Trust, or REIT, that was founded by the merger of four pre-existing real estate companies. The founders retain about 2/3 of the ownership and votes today, as they have never sold a share.

Clipper owns commercial (primarily multifamily and office with a small sliver of retail) real estate across New York City.

On February 18, 2025, Clipper Realty Inc. reported its financial results for the fourth quarter of 2024. The company achieved record quarterly revenue of $38 million, marking a 9.1% increase from the previous year.

Net Operating Income (NOI) rose to $22.5 million, reflecting a 12.5% growth, while Adjusted Funds From Operations (AFFO) reached $8.1 million, up 29%.

This performance was primarily driven by a $2.9 million increase in residential revenue, attributed to strong leasing activities and operational efficiencies.

Click here to download our most recent Sure Analysis report on CLPR (preview of page 1 of 3 shown below):

Micro Cap Stock #1: Shoe Carnival, Inc. (SCVL)

  • 5-year expected annual returns: 23.7%

Shoe Carnival, Inc. is a leading U.S.-based retailer specializing in family footwear and accessories. The company operates a large network of stores, offering a wide variety of athletic, casual, and dress shoes for men, women, and children.

With over 400 stores across the U.S. under the Shoe Carnival, Shoe Station, and Rogan’s Shoes brands, the company has steadily expanded its market presence.

In addition to its brick-and mortar locations, Shoe Carnival has a growing e-commerce platform, supporting its omnichannel strategy.

On November 21st, 2024, Shoe Carnival reported third quarter Fiscal 2024 results. The company reported GAAP EPS of $0.70 and Adjusted EPS of $0.71, meeting expectations.

While third-quarter net sales fell to $306.9 million from $319.9 million in 2023 due to a retail calendar shift, adjusted figures showed a 2.2% year-over-year increase.

Year-to-date, net sales rose 4.9%, with strong Back-to-School sales and contributions from the Rogan’s Shoes acquisition driving performance.

Click here to download our most recent Sure Analysis report on SCVL (preview of page 1 of 3 shown below):

Final Thoughts

Micro-cap stocks are the smallest companies currently trading on the stock market. The potential benefit of investing in micro-cap stocks is the potential for higher growth, and shareholder returns, over time.

Of course, investors need to carefully consider the unique risks associated with investing in micro-cap stocks. The 10 micro-cap stocks on this list all pay dividends to shareholders and have positive expected returns.

As a result, these 10 micro-cap stocks could be attractive for dividend growth investors.

Other Dividend Lists

The following lists contain many more high-quality dividend stocks:

  • The Dividend Aristocrats List is comprised of 69 stocks in the S&P 500 Index with 25+ years of consecutive dividend increases.
  • The High Yield Dividend Aristocrats List is comprised of the 20 Dividend Aristocrats with the highest current yields.
  • The Dividend Achievers List is comprised of ~400 NASDAQ stocks with 10+ years of consecutive dividend increases.
  • The Dividend Kings List is even more exclusive than the Dividend Aristocrats. It is comprised of 55 stocks with 50+ years of consecutive dividend increases.
  • The High Yield Dividend Kings List is comprised of the 20 Dividend Kings with the highest current yields.
  • The High Dividend Stocks List: stocks that appeal to investors interested in the highest yields of 5% or more.
  • The Monthly Dividend Stocks List: stocks that pay dividends every month, for 12 dividend payments per year.
  • The Dividend Champions List: stocks that have increased their dividends for 25+ consecutive years.
    Note: Not all Dividend Champions are Dividend Aristocrats because Dividend Aristocrats have additional requirements like being in The S&P 500.

Thanks for reading this article. Please send any feedback, corrections, or questions to [email protected].


Source link

10 Undervalued Hidden Gem Dividend Stocks For Savvy Investors


Published on March 24th, 2025 by Bob Ciura

The average dividend yield in the S&P 500 Index remains low at just 1.3%. As a result, income investors should focus on higher-yielding securities, if they want additional income from their stock portfolios.

Even better, investors can buy high dividend stocks when they are also undervalued, which could lead to high total returns in the coming years.

After all, the goal of rational investors is to maximize total return under a given set of constraints. High dividend stocks can contribute a significant portion of a stock’s total return.

With this in mind, we compiled a list of high dividend stocks with dividend yields above 5%. You can download your free copy of the high dividend stocks list by clicking on the link below:


Note: The spreadsheet uses the Wilshire 5000 as the universe of securities from which to select, plus a few additional securities we screen for with 5%+ dividend yields.

The free high dividend stocks list spreadsheet has our full list of ~170 individual securities (stocks, REITs, MLPs, etc.) with 5%+ dividend yields.

Interestingly, all returns come from only three sources:

  1. Dividends (or distributions, interest, etc.)
  2. Growth on a per share basis (typically measured as earnings-per-share)
  3. Valuation multiple changes (typically measured as a change in the price-to-earnings ratio)

Combined, these three sources make up total return.

Historical total return, while interesting, is not what matters in investing.  It’s expected future returns that we care about.

And since total returns can only come from the three sources mentioned above, you can use the expected total return framework to clarify your thinking on where you expect total returns to come from.

The following list represents the 10 most undervalued stocks in the Sure Analysis Research Database that also have yields above 5%.

The list excludes MLPs, BDCs, and REITs, and also excludes international stocks. The 10 undervalued hidden gems below are sorted by expected return from valuation changes, from lowest to highest.

Table of Contents

You can instantly jump to any specific section of the article by using the links below:

Undervalued Hidden Gem #10: Pfizer Inc. (PFE)

  • Annual Valuation Return: 6.1%
  • Dividend Yield: 6.6%

Pfizer Inc. is a global pharmaceutical company focusing on prescription drugs and vaccines. Pfizer formed the GSK Consumer Healthcare Joint Venture in 2019 with GlaxoSmithKline plc, which includes its over-the-counter business.

Pfizer owns 32% of the JV, but is exiting the company, now known as Haleon. Pfizer spun off its Upjohn segment and merged it with Mylan forming Viatris for its off patent, branded and generic medicines in 2020.

Pfizer’s top products are Eliquis, Ibrance, Prevnar family, Vyndaqel family, Abrysvo, Xeljanz, and Comirnaty.

Source: Investor Presentation

Pfizer’s current product line is expected to produce top line and bottom-line growth because of significant R&D and acquisitions.

Pfizer reported solid Q4 2024 results on February 4th, 2025. Company-wide revenue grew 21% operationally and adjusted diluted earnings per share climbed to $0.63 versus $0.10 on a year-over-year basis because of stabilizing COVID-19 related sales, growing revenue from the existing portfolio, and lower expenses.

Global Biopharmaceuticals sales gained 22% to $17,413M from $14,186M led by gains in Primary Care (+27%), Specialty Care (+12%), and Oncology (+27%). Pfizer Centerone saw 11% lower sales to $325M, while Ignite revenue was $26M.

Of the top selling drugs, sales increased for Eliquis (+14%), Prevnar (-4%), Plaxlovid (flat), Cominraty (-37%), Vyndaqel/ Vyndamax (+61%), Ibrance (-2%), and Xtandi (+24).

Click here to download our most recent Sure Analysis report on PFE (preview of page 1 of 3 shown below):

Undervalued Hidden Gem #9: T. Rowe Price Group (TROW)

  • Annual Valuation Return: 6.8%
  • Dividend Yield: 5.5%

T. Rowe Price Group, founded in 1937 and headquartered in Baltimore, MD, is one of the largest publicly traded asset managers.

The company provides a broad array of mutual funds, sub-advisory services, and separate account management for individual and institutional investors, retirement plans and financial intermediaries.

Source: Investor Presentation

On February 5th, 2025, T. Rowe Price announced fourth quarter and full year results for the period December 31st, 2024.

For the quarter, revenue increased 11% to $1.82 billion, though this was $50 million less than expected. Adjusted earnings-per-share of $2.12 compared favorably to $1.72 in the prior year, but missed estimates by $0.08. For the year, revenue grew 9.8% to $7.1 billion while adjusted earnings-per-share of $9.33 compared to $7.59 in 2023.

During the quarter, AUMs of $1.639 billion were up 19.2% year-over-year and 3.1% sequentially. Market appreciation of $205.3 billion was partially offset by $43.2 billion of net client outflows. Operating expenses of $1.26 billion increased 0.1% year-over-year and 6.4% quarter-over-quarter.

Click here to download our most recent Sure Analysis report on TROW (preview of page 1 of 3 shown below):

Undervalued Hidden Gem #8: Canandaigua National Corporation (CNND)

  • Annual Valuation Return: 6.9%
  • Dividend Yield: 5.1%

Canandaigua National Corporation (CNC) is the parent company of The Canandaigua National Bank & Trust Company (CNB) and Canandaigua National Trust Company of Florida (CNTF).

The company offers a wide range of financial services, including banking, lending, mortgage services, trust, investment management, and insurance.

With 23 branches across its service areas, CNC is focus on serving local communities by providing personalized financial solutions to individuals, businesses, and municipalities. CNC emphasizes community banking, focusing on reinvesting in the local economy through a diverse lending portfolio.

Moving forward, we expect CNC’s EPS to grow at a CAGR of 5%. Note that the company has increased its dividend every year since 2002, marking 22 years of consecutive annual dividend increases.

Click here to download our most recent Sure Analysis report on CNND (preview of page 1 of 3 shown below):

Undervalued Hidden Gem #7: Midland States Bancorp (MSBI)

  • Annual Valuation Return: 7.8%
  • Dividend Yield: 7.0%

Midland States Bancorp (MSBI) is the holding company of Midland States Bank, a community bank that was founded in 1881 and is headquartered in Effingham, Illinois.

It operates 53 branches in Illinois and Missouri and provides a wide range of banking products and services to individuals, businesses, municipalities and other entities. Midland States Bancorp has total assets of $7.5 billion.

In late January, Midland States Bancorp reported (1/23/25) results for the fourth quarter of fiscal 2024. Its net interest margin expand sequentially from 3.10% to 3.19% and its net interest income grew 2%.

However, the bank incurred massive charge-offs on loans ($103 million) and provisions for loan losses ($93.5 million).

As a result, it switched from earnings-per-share of $0.74 to an excessive loss per share of -$2.52, missing the analysts’ consensus by $3.19.

Midland States Bancorp has acquired seven smaller banks since 2009. As a result, it grew its asset base by 12% per year on average over the last nine years.

It had also grown its earnings-per-share by 6.9% per year on average during 2015-2023 but it incurred a loss in 2024 due to massive loan charge-offs and high deposit costs, which resulted from high interest rates.

Click here to download our most recent Sure Analysis report on MSBI (preview of page 1 of 3 shown below):

Undervalued Hidden Gem #6: Western Union Company (WU)

  • Annual Valuation Return: 8.5%
  • Dividend Yield: 8.8%

The Western Union Company is the world leader in the business of domestic and international money transfers. The company has a network of approximately 550,000 agents globally and operates in more than 200 countries.

About 90% of agents are outside of the US. Western Union operates two business segments, Consumer-to-Consumer (C2C) and Other (bill payments in the US and Argentina).

Western Union reported mixed Q4 2024 results on February 4th, 2025. Revenue increased 1% and diluted GAAP earnings per share increased to $1.14 in the quarter, compared to $0.35 in the prior year on higher revenue and a $0.75 tax benefit on reorganizing the international operations.

Revenue rose, despite challenges in Iraq on higher Banded Digital transactions and Consumer Services volumes.

CMT revenue fell 4% year-over-year even with 3% higher transaction volumes. Branded Digital Money Transfer CMT revenues increased 7% as transactions rose 13%. Digital revenue is now 25% of total CMT revenue and 32% of transactions.

Consumer Services revenue rose 56% on new products and expansion of retail foreign exchange offerings. The firm launched a media network business, expanded retail foreign exchange, and grew retail money orders.

Click here to download our most recent Sure Analysis report on WU (preview of page 1 of 3 shown below):

Undervalued Hidden Gem #5: Hooker Furnishings Company (HOFT)

  • Annual Valuation Return: 9.1%
  • Dividend Yield: 7.9%

Hooker Furnishings is a designer, marketer and importer of casegoods (wooden and metal furniture), leather furniture, fabric-upholstered furniture, lighting, accessories and home décor for residential, hospitality and contract markets.

The company also domestically manufactures premium residential custom leather and fabric-upholstered furniture.

Hooker Furnishings is the largest supplier of casegoods and upholstery in the U.S. and has access to more than 75% of all retail furniture distribution.

Source: Investor Presentation

In early December, Hooker Furnishings reported (12/5/24) financial results for the third quarter of fiscal 2025. Net sales decreased -11% over the prior year’s quarter due to sustained headwinds in the housing market and loss of sales due to the bankruptcy of a customer.

The combination of high interest rates and high home prices have been exerting pressure on the business of Home Furnishings over the last two years.

As a result, the company switched from earnings-per-share of $0.65 to a loss per share of -$0.39 and missed the analysts’ consensus by a massive $0.67.

Click here to download our most recent Sure Analysis report on HOFT (preview of page 1 of 3 shown below):

Undervalued Hidden Gem #4: Peoples Financial Services (PFIS)

  • Annual Valuation Return: 10.5%
  • Dividend Yield: 5.5%

Peoples Financial Services (PFIS) is the holding company of Peoples Security Bank and Trust Company, a community bank that was founded in 1905 and is headquartered in Scranton, Pennsylvania.

It operates 44 branches in Pennsylvania and provides various banking products and services to consumers, municipalities and businesses.

On July 1st, 2024, Peoples Financial Services completed its acquisition of FNCB Bancorp in an all-stock deal. As per the terms of the deal, the shareholders of FNCB now own ~29% of the combined entity.

Thanks to the merger, the bank grew its total assets from $3.7 billion to $5.5 billion and thus it became the 5th largest community bank in Pennsylvania.

In early February, Peoples Financial Services reported (2/6/24) financial results for the fourth quarter of fiscal 2024. Loans and deposits grew 40% and 28%, respectively, over the prior year’s quarter, thanks to the acquisition of FNCB Bancorp.

Net interest margin expanded impressively, from 2.30% in the prior year’s quarter to 3.25% thanks to the much higher net interest margin of the acquired bank.

Click here to download our most recent Sure Analysis report on PFIS (preview of page 1 of 3 shown below):

Undervalued Hidden Gem #3: AES Corp. (AES)

  • Annual Valuation Return: 11.0%
  • Dividend Yield: 5.4%

The AES (Applied Energy Services) Corporation was founded in 1981 as an energy consulting company. It now has businesses in 14 countries and a portfolio of approximately 160 generation facilities.

AES produces power through various fuel types, such as gas, renewables, coal, and oil/diesel. The company has more than 36,000 Gross MW in operation.

Source: Investor Presentation

AES Corporation reported fourth quarter results on February 28th, 2025, for the period ending December 31, 2024. Adjusted EPS decreased 26% to $0.54 for Q4 2024, but this still beat analyst estimates by $0.19.

For the full year, AES’ adjusted EPS rose 22% to $2.14 from $1.76 in 2023. The company constructed and acquired 3 GW of renewable energy in 2024, as well as constructed a 670 MW combined cycle gas plant in Panama.

Leadership initiated its 2025 guidance, expecting adjusted EPS of $2.10 to $2.26 for the full fiscal year.

Additionally, the company reaffirms its expectation it can grow EPS on average 7% to 9% through 2025 from a base year of 2020. It also expects annual EPS growth of 7% to 9% from 2023 through 2027.

Click here to download our most recent Sure Analysis report on AES (preview of page 1 of 3 shown below):

Undervalued Hidden Gem #2: Virtus Investment Partners (VRTS)

  • Annual Valuation Return: 11.8%
  • Dividend Yield: 5.1%

Virtus Investment Partners, Inc. is a distinctive partnership of boutique investment managers, singularly committed to the long-term success of individual and institutional investors.

The firm offers a diverse range of investment strategies across asset classes, including equity, fixed income, multi-asset, as well as alternative investments.

These strategies are available in multiple product forms, such as open-end mutual funds, closed-end funds, ETFs, retail separate accounts, and institutional accounts.

Virtus operates through a multi-manager model, partnering with affiliated managers and select unaffiliated sub-advisers, each maintaining distinct investment philosophies and processes.

This structure allows Virtus to offer clients access to specialized expertise and a broad array of solutions tailored to meet various financial objectives.

On January 31st, 2025, Virtus reported its Q4 and full-year results for the period ending December 31st, 2024. Total AUM fell by 5% sequentially to $175.0 billion due to net outflows in institutional accounts and U.S. retail funds, and negative market performance, partially offset by inflows in ETFs, global funds, and retail separate accounts.

Net outflows of ($4.8) billion worsened from ($1.7) billion in Q3, primarily due to a $3.3 billion lower-fee partial redemption of an institutional mandate.

However, adjusted EPS rose 8% to $7.50, driven by higher investment management fees and a soft increase in operating expenses. For FY2025, we expect adjusted EPS of $26.81.

Click here to download our most recent Sure Analysis report on VRTS (preview of page 1 of 3 shown below):

Undervalued Hidden Gem #1: Shutterstock Inc. (SSTK)

  • Annual Valuation Return: 14.8%
  • Dividend Yield: 6.7%

Shutterstock sells high-quality creative content for brands, digital media and marketing companies through its global creative platform.

Its platform hosts the most extensive and diverse collection of high-quality 3D models, videos, music, photographs, vectors and illustrations for licensing. The company reported $935 million in revenues last year.

On January 7th, 2025, Shutterstock announced it entered a merger agreement with Getty Images through a merger of equals. The combined company will retain the name Getty Images Holdings, Inc and trade on the NYSE under ticker GETY.

Getty Images shareholders will own roughly 54.6% of the entity and Shutterstock shareholders will own the remaining 45.3%. Shareholders of SSTK will receive $28.84870 of cash, or 9.17 shares of Getty Images plus $9.50 in cash per share.

The combined company would have revenue between $1,979 million and $1,993 million, 46% of it being subscription revenue. About $175 million of annual cost savings is forecast by the third year, with most of this expected after 1 to 2 years.

On January 27th, 2025, Shutterstock announced a $0.33 quarterly dividend, a 10% increase over the prior year.

On February 25th, 2025, Shutterstock published its fourth quarter results for the period ending December 31, 2024. While quarterly revenue grew by a solid 15% year-on-year, it missed analyst estimates by nearly $4 million.

Adjusted EPS of $0.67 decreased by 7%, and also missed analyst estimates by $0.18.

Click here to download our most recent Sure Analysis report on SSTK (preview of page 1 of 3 shown below):

Final Thoughts & Additional Reading

If you are interested in finding high-quality dividend growth stocks and/or other high-yield securities and income securities, the following Sure Dividend resources will be useful:

High-Yield Individual Security Research

Other Sure Dividend Resources

Thanks for reading this article. Please send any feedback, corrections, or questions to [email protected].


Source link

5 Essential Steps to Take When Your Emergency Fund Runs Out


A 2024 survey from Empower reports that nearly 37% of Americans aren’t prepared to handle a $400 emergency expense. In fact, it claims that over 1 in 5 Americans have no emergency savings. This isn’t particularly shocking, as in 2023, the Federal Reserve Board, in a report on the economic well-being of U.S. households, considered adults who had 3 months’ emergency savings, and this amounted to just 54%.

When financial experts recommend keeping three to six months of essential expenses safely tucked away, running out of that safety net sometimes will feel like a huge financial failure. But the reality, stark as it is, is that emergency funds are meant to be used during emergencies. So the real test isn’t whether you’ve depleted your fund but how strategically you respond when those resources are gone.

Your emergency fund can evaporate due to medical bills, job loss, income reduction, or a series of unfortunate events, and if you want to deal with this, you’ll need to plan thoughtfully. The following five steps will help you navigate such a challenging financial period.

Key Takeaways

  • According to the Consumer Financial Protection Bureau’s Making Ends Meet survey in 2022, nearly a quarter of consumers (24%) have no savings set aside for emergencies, while 39% have less than a month of income saved for emergencies.
  • Treat your emergency fund as a last-resort safety net by using it only for true emergencies not for non-urgent expenses like vacations or lifestyle upgrades.
  • When rebuilding your depleted emergency fund, make saving an automatic part of your budget.
  • Consider a temporary lifestyle adjustment by cutting non-essential expenses, finding additional income sources through side hustles, and selling unused items to accelerate your emergency fund replenishment.

Implement an Emergency Budget Overhaul

“Rebuilding requires intentional budgeting” said Netta Stahl. The Tel Aviv based financial coach says “sticking with old spending patterns while trying to replenish the fund will only slow progress.” The big question now is “how do you implement an emergency budget overhaul?”

Create an entirely new emergency budget that reflects your current financial reality. It’s best to not see this just as an attempt to trim expenses but to see it as restructuring your spending priorities.

  • Review every recurring expense and eliminate anything non-essential.
  • Reallocate funds toward immediate needs.
  • Consider implementing creative cost-cutting measures like “themed” budget days (such as “ramen Tuesdays” or “no-spend weekends”).

 Proactively Contact Your Creditors

Don’t wait until you miss payments to reach out to lenders and service providers. Contact them immediately when you anticipate potential payment difficulties. Many creditors offer hardship programs that can temporarily lower interest rates, waive fees, and adjust payment terms. These programs typically last a few months and allow more of your payment to go toward principal. This way, you can make meaningful progress on your debt while managing cash flow during your emergency fund rebuild phase. Stahl advises, “Never take the first offer just because you’re stressed. Desperation can lead to expensive mistakes, so explore a few options before locking yourself into high-interest debt.”

Strategically Pause Other Financial Goals

Temporarily redirecting funds from other financial objectives can help you rebuild your emergency fund faster:

  • Calculate the minimum contributions needed to maintain employer matches on retirement accounts.
  • Evaluate the long-term cost of pausing investments versus the immediate need for cash reserves.
  • Consider reallocating funds from long-term savings goals (e.g., vacation or home down payment) to your emergency fund.
  • Explore options to temporarily reduce or suspend payments on student loans or other non-essential debts.
  • Set clear milestones for when you’ll resume normal contributions to avoid indefinitely neglecting important financial goals.
  • Use this pause as an opportunity to reassess and potentially reprioritize your long-term financial objectives.

You have to consciously be aware that this isn’t about abandoning long-term goals but prioritizing immediate financial security. “Remind yourself that this is temporary. It’s a season, not a permanent lifestyle,” Stahl notes.

Secure a Part-Time Freelance Gig

You can increase your income using freelance work if your emergency funds run out. Leverage platforms like Upwork, LinkedIn, Fiverr, or industry-specific job boards to find opportunities in your field. Some skills are popular in the freelance gig space: content writing ,virtual assistance, graphics designing, etc. You can try learning these skills or leveraging them for freelance work. You can also offer specialized consulting in your professional field. Consider creating and selling digital products (e.g., online courses, eBooks) that can generate passive income over time. Network within professional associations or alumni groups to find higher-paying, specialized freelance work. Invest in enhancing your skills through free online courses to increase your earning potential. Track all freelance income and expenses meticulously for tax purposes and to gauge the effectiveness of your efforts.  The flexibility of freelance work allows you to scale hours based on your needs.

Transform Unused Assets Into Emergency Capital

This is perhaps the most innovative of the steps, going well beyond the typical “sell your stuff” advice. Look beyond the traditional selling of household items by conducting a comprehensive “asset audit” of your life. This includes evaluating physical possessions, digital assets, unused subscriptions, reward points, cashback opportunities, and even specialized knowledge you could monetize. For physical items, consider not just selling but also renting valuable possessions through platforms like Fat Llama or Turo. Digital assets like unused domain names, photos, or creative works might find buyers on specialized marketplaces. Check out peer-to-peer rental platforms for high-value items like cameras, musical instruments, or sports equipment. You can even consider selling or licensing intellectual property, such as patents or copyrights you may hold.

Stahl cautions against trying to “invest” your way back: “Some people feel pressure to replace the fund fast and take unnecessary risks like putting their emergency savings into stocks or crypto.” That defeats the purpose of an emergency fund. This money isn’t meant to grow, it’s meant to be there when you need it.

Bottom Line

Remember, rebuilding your emergency fund is a process. Stahl estimates that it takes “just over one year to fully replenish a 6-month emergency fund” for most people. Stay focused, adjust your lifestyle temporarily, and prioritize your financial security. Also, remember that a depleted emergency fund is not a failure. In fact, it’s proof that your system worked. Now, it’s time to get back on track.


Source link

Fed Officials Warn of the Challenge Trump Tariff ‘Uncertainty’ Poses


Key Takeaways

  • Two members of the Federal Reserve’s policy committee said the central bank was still in “wait and see” mode amid uncertainty about trade policy.
  • President Donald Trump’s tariffs, if and when they are imposed, could push up inflation and slow the economy, requiring a response from the Fed.
  • The officials’ comments illuminated the reasoning behind the Fed’s decision Wednesday to keep its key interest rate unchanged.

Fed officials on Friday shed light on how the central bank is navigating the uncertainty about what President Donald Trump will do next when it comes to tariffs, and how the import taxes could affect inflation and unemployment.

Austan Goolsbee, president of the Federal Reserve Bank of Chicago, and John Williams, president of the Federal Reserve Bank of New York, both said “uncertainty” was the main reason the central bank opted to keep its influential fed funds rate unchanged Wednesday. Their comments, made in separate public appearances, added detail to statements by Fed officials Wednesday explaining the interest rate decision. Both men are members of the Federal Open Market Committee, the fed’s policy-making body.

“When there’s uncertainty, you’ve got to wait for the dust to just get out of the air,” Goolsbee said on CNBC. “It’s hard to see what we’re doing, because the dust has got to clear.”

Williams pointed to some signs that the economy is performing well, including inflation having fallen closer to the Fed’s goal of a 2% annual rate and a job market that has stayed solid.

“That’s where things stand now, but the future is highly uncertain,” he said in remarks prepared ahead of an appearance at a conference in the Bahamas. “And my business and financial market contacts highlight the role of greater uncertainty, especially around trade policy, in making it more difficult to plan investments and hiring.”

The comments illustrated the Fed’s challenge as the April 2 deadline Trump has set to impose a wide range of new tariffs approaches. The central bank aims to keep inflation low and employment high, and tariffs could inflict setbacks on both of those goals, depending on how high the import taxes end up being, how widely they’re applied, and how long they are in place. The Fed generally raises interest rates to slow the economy to combat inflation and lowers them to boost the economy and fight unemployment, so all those issues together could leave the Fed to choose between painful options.

Before the tariff turmoil, the Fed had been lowering its benchmark fed funds rate from a two-decade high, and the operative buzzword was “soft landing” rather than “uncertainty.” Inflation has fallen significantly from its post-pandemic surge, while the job market has avoided a surge in unemployment, a rare example in history of a bout of inflation subsiding without a recession and mass layoffs.

The source of all the “uncertainty” is Trump’s recent tendency to announce tariffs, set deadlines, only to call them off or alter them, leaving consumers and business leaders guessing what he will do next. That uncertainty has roiled financial markets in recent weeks.

However, at least one independent economist doubts “uncertainty” is the real problem. After Trump’s election, many forecasters assumed Trump’s tariff threats were negotiating tactics, but Trump’s actions have thrown cold water on that assumption.

“The problem isn’t really ‘uncertainty’ about tariffs,” Robert Fry, an independent economist and forecaster, wrote in a note to clients, arguing that broadly applied tariffs could push up the cost of living and slow the economy. “It’s the growing likelihood that President Trump intends to keep tariffs in effect long-term, to raise revenue and to shift manufacturing back to the United States, rather than using them as leverage to get other countries to reduce their trade barriers.”


Source link

Watch These Supermicro Stock Price Levels as 2025 Rebound Continues


Key Takeaways

  • Supermicro shares are likely to remain in focus to start the week after the stock led the S&P 500 higher Friday following bullish remarks from analysts at JPMoprgan.
  • The price has found buying interest on a pullback to the neckline of an inverse head and shoulders pattern, lifting the RSI back above the 50 threshold in the process and potentially setting the stage for another move higher.
  • Investors should watch crucial support levels on Supermicro’s chart around $35 and $26, while also monitoring key resistance levels near $66 and $97.

Super Micro Computer (SMCI) shares are likely to remain in focus to start the week after the stock led the S&P 500 higher Friday following bullish remarks from analysts.

JPMorgan upgraded the stock, pointing out that shares in the server maker could receive a boost from increasing demand for AI infrastructure, particularly its hardware that houses Nvidia’s (NVDA) sought-after Blackwell chips as shipments ramp up.

Supermicro shares have gained nearly 40% since the start of the year through Friday’s close as investors look past highly publicized accounting and corporate governance challenges that have weighed on the company’s stock over the past six months.

Last month, the server maker filed delayed financial reports to avoid a Nasdaq delisting and predicted significant revenue growth in 2026 as demand grows for infrastructure to support AI.

Below, we take a closer look at the technicals on Supermicro’s weekly chart and point out crucial price levels worth watching out for.

Inverse Head and Shoulders Neckline Retest

Supermicro shares carved out an inverse head and shoulders pattern between August and February before breaking out above the formation’s neckline on heavy trading volume last month.

More recently, the stock found buying interest on a pullback to the initial breakout point, lifting the relative strength index (RSI) back above the 50 threshold in the process and potentially setting the stage for another move higher.

Let’s apply technical analysis to Supermicro’s chart to identify crucial support and resistance levels that investors may be watching.

Crucial Support Levels to Watch

Supermicro shares surged nearly 8% on Friday to finish the week at $42.15.

The first lower support level to watch sits around $35. The shares could find buying interest in this area near the inverse head and shoulders’ neckline, which closely aligns with the prominent August 2023 peak.

A breakdown below this important location could see the shares revisit lower support at the $26 level. Investors may seek buying opportunities in this region near last month’s low, which currently sits alongside the upward sloping 200-week moving average and a series of similar price points on the chart during the second half of 2023.

Key Resistance Levels to Monitor

Buying from current levels could fuel a move up to around $66, a location on the chart where the shares may run into overhead resistance near the February peak and last year’s April trough.

Finally, If bulls regain control of the price action, look for a possible rally to the $97 level. Investors who bought lower may decide to lock in profits near the top trendline of a narrow trading range that developed on the chart shortly after the stock set its record high in early March last year.

The comments, opinions, and analyses expressed on Investopedia are for informational purposes only. Read our warranty and liability disclaimer for more info.

As of the date this article was written, the author does not own any of the above securities.


Source link