Dividend Kings In Focus: RLI Corp.


Published on March 19th, 2025 by Bob Ciura

The Dividend Kings are a selective group of stocks that have increased their dividends for at least 50 years in a row.

We believe the Dividend Kings are among the highest-quality dividend growth stocks to buy and hold for the long term.

With this in mind, we created a full list of all the Dividend Kings.

You can download the full list, along with important financial metrics such as dividend yields and price-to-earnings ratios, by clicking the link below:


RLI Corp. (RLI) is the newest member of the Dividend King list, having announced its 50th consecutive annual dividend increase on February 13th.

This article will discuss the company’s business overview, growth prospects, competitive advantages, and expected returns.

Business Overview

RLI Corp. is an insurance company that operates the following business units: Casualty (healthcare & transportation insurance), Property (fire, earthquake, difference in conditions, marine, etc.) and Surety (contract surety coverage, licenses, and bonds).

Source: Investor Presentation

RLI Corporation reported its fourth quarter earnings results on January 22. The company reported revenues of $440 million for the quarter, which was up 1% year-over-year. Net earned premiums rose by 15% year-over-year.

Realized gains were higher than during the previous year’s period, which had a positive impact on the company’s reported revenues, but net unrealized gains were lower compared to the previous year’s quarter, offset some of the revenue tailwinds.

Higher net investment income, which was up 19% year over year, was a tailwind for RLI’s profitability during the quarter.

RLI Corporation earned $0.41 per share on a non-GAAP, or adjusted, basis during the quarter, which is where RLI backs out one-time items that can distort the picture when it comes to the company’s underlying earnings power.

RLI’s bottom line was lower than during the previous year’s period, but for the entire year of 2024, earnings were up. RLI Corp is forecasted to see its earnings-per-share grow nicely this year, to more than $3.00.

Growth Prospects

RLI Corp. has not been able to grow its profits very consistently in the past, as profits moved sideways for much of the last decade.

This is, in large part, because low interest rates reduced the income RLI can generate with its insurance float at times.

Since 2020, however, RLI Corp. has grown its earnings-per-share very nicely, with earnings-per-share rising by more than 100% between 2020 and 2024.

Higher interest rates allow RLI Corp. to deploy its insurance float in a more profitable way, thus a higher-rates environment is positive for the company, all else equal.

Source: Investor Presentation

RLI has grown its premiums in the recent past, and thanks to further premium growth, RLI should see its sales grow in the future.

We believe that 3% annual earnings-per-share growth is a realistic long-term estimate, factoring in the recent performance and the longer-term track record.

Competitive Advantages & Recession Performance

Many financial corporations, including some insurers, experienced significant difficulty during the Great Recession.

RLI remained profitable, and its earnings-per-share actually grew during the 2008-to-2010-time frame. We believe that RLI Corporation will be relatively stable during future recessions as well.

RLI Corporation has raised its regular dividend very steadily over the years, which was possible due to ongoing increases in the company’s payout ratio over many years.

More recently, the dividend payout ratio has come down again, and the dividend looks very sustainable for now.

During the Great Recession of 2008-2009, it steadily grew earnings-per-share each year in that time:

  • 2008 earnings-per-share of $3.60
  • 2009 earnings-per-share of $4.32 (20% increase)
  • 2010 earnings-per-share of $6.00 (39 increase)

Valuation & Expected Total Returns

Based on expected 2025 earnings-per-share of $3.10, RLI stock trades for a forward P/E of 24.4. This is above our fair value estimate of 19, meaning shares appear overvalued.

RLI Corporation’s price to earnings multiple has been moving in a very wide range in the past. Shares were valued at a low double-digit price to earnings multiple shortly after the Great Recession, but the company’s valuation multiple has exploded upwards since then.

RLI’s valuation remains elevated. We believe that shares are trading above fair value and that multiple compression is likely going forward.

For example, if the P/E multiple declines from 24.4 to 19 over the next five years, it would reduce shareholder returns by -4.9% per year over that time frame.

Aside from changes in the P/E multiple, RLI should also generate returns from earnings growth and dividends. A projection of expected returns is below:

  • 3% earnings-per-share growth
  • 0.8% dividend yield
  • -4.9% multiple reversion

RLI has a regular quarterly dividend, and periodically pays special dividends as well. For example, the company paid shareholders a special dividend of $4.00 per share in 2024, and a $2.00 special dividend in 2023.

However, since special dividends are irregular, we exclude them from our analysis and instead focus on the regular quarterly payouts.

In this scenario, RLI stock is projected to generate a negative total return of -1.1% per year over the next five years.

Final Thoughts

RLI Corporation is an insurance company which generated solid operating results in recent years, with written premiums and investment income rising at a nice pace.

Earnings will likely continue to grow during the next couple of years, but not at an overly fast pace.

RLI Corporation does not have a very strong long-term track record, even though results during recent years were strong, while the outlook for 2025 is compelling as well.

However, we believe that shares are overvalued today. Because of this, RLI Corporation earns a sell recommendation from Sure Dividend at the current valuation level.

Additional Reading

The following articles contain stocks with very long dividend or corporate histories, ripe for selection for dividend growth investors:

Thanks for reading this article. Please send any feedback, corrections, or questions to [email protected].


Source link

Top 10 Graham Number Dividend Kings Now


Published on March 19th, 2025 by Bob Ciura
Spreadsheet data updated daily

Benjamin Graham is widely considered to be the “founder of value investing”.

In fact, many of the best value investors over time, such as Warren Buffett, used Graham’s teachings to invest in value stocks.

Graham popularized the term intrinsic value, which refers to a stock’s underlying fair value. In this way, investors can determine whether a stock is undervalued, fairly valued, or overvalued.

One of the core principles of Graham’s investment philosophy is the Graham Number.

Investors can apply the Graham Number to find undervalued dividend growth stocks, such as the Dividend Kings.

The Dividend Kings are the best-of-the-best in dividend longevity.

What is a Dividend King? A stock with 50 or more consecutive years of dividend increases.

We’ve compiled a list that includes every Dividend King.

You can see the full downloadable spreadsheet of all 54 Dividend Kings (along with important financial metrics such as dividend yields, payout ratios, and price-to-earnings ratios) by clicking on the link below:


The Dividend Kings list includes several mega-cap stocks that have enormous businesses, such as Walmart Inc. (WMT) and Coca-Cola (KO).

The following list represents the 10 Dividend Kings in the Sure Analysis Research Database with the lowest Graham Number.

Table of Contents

Graham Number Overview

The Graham Number is fairly straightforward: investors can simply multiple the price-to-book ratio (P/B) by the price-to-earnings ratio (P/E).

Investors want to focus on stocks with a Graham Number below 22.5, and the lower, the better.

To compile the screen, we took the P/E ratios in the Sure Analysis Research Database, in combination with P/B ratios taken from Ycharts.

We then ranked the list of Dividend Kings by their corresponding Graham Number. The 10 most undervalued Dividend Kings, according to the Graham Number, are listed below.

Top Graham Number Dividend King: Stanley Black & Decker (SWK)

Stanley Black & Decker is a world leader in power tools, hand tools, and related items. The company holds the top global position in tools and storage sales.

Stanley Black & Decker is second in the world in the areas of commercial electronic security and engineered fastening. The company is composed of three segments: tools & outdoor, and industrial.

Source: Investor Presentation

On February 5th, 2025, Stanley Black & Decker announced fourth quarter and full-year results. For the quarter, revenue of $3.75 billion was unchanged from the prior year, but came in $120 million above expectations.

Adjusted earnings-per-share of $1.49 compared favorably to $0.92 in the prior year and was $0.22 ahead of estimates. For the year, revenue declined 3% to $15.4 billion while adjusted earnings-per-share of $4.36 compared to $1.45 in 2023.

Organic growth was flat for the year, but up 3% for the quarter. Organic sales for Tools & Outdoor, the largest segment within the company, was higher by 3% for the quarter.

Click here to download our most recent Sure Analysis report on SWK (preview of page 1 of 3 shown below):

Top Graham Number Dividend King: H.B. Fuller Companies (FUL)

H.B. Fuller is a leading global manufacturer of adhesives, sealants, and other specialty chemical products.

It has customers across more than 30 market segments in more than 140 countries. The category of industrial adhesives is the core product offering.

In mid-January, H.B. Fuller reported (1/15/25) financial results for the fourth quarter of fiscal 2024. Revenue grew 2% and organic revenue was essentially flat year-over-year, as price reductions offset volume growth.

Highlights for the full year can be seen in the image below:

Source: Investor Presentation

It was the third quarter of revenue growth after five consecutive quarters of declining sales amid de-stocking actions of customers and lackluster industrial demand.

However, gross margin shrank from 31.3% to 29.6% and earnings-per-share fell -30%, from $1.32 to $0.92, mostly due to high raw material costs, and missed the analysts’ consensus by $0.01.

Due to slowing demand in some emerging markets, H.B. Fuller provided modest guidance for fiscal 2025. It expects to grow organic revenue by 0%-2% and post earnings-per-share of $3.90-$4.20.

Click here to download our most recent Sure Analysis report on FUL (preview of page 1 of 3 shown below):

Top Graham Number Dividend King: ABM Industries (ABM)

ABM Industries is a leading provider of facility solutions, which includes janitorial, electrical & lighting, energy solutions, facilities engineering, HVAC & mechanical, landscape & turf, and parking.

The company employs about 124,000 people in more than 350 offices throughout the United States and various international locations, primarily in Canada.

Source: Investor Presentation

ABM Industries reported its fourth quarter earnings results on December 18. Revenues totaled $2.2 billion during the quarter, which was up 4% year-over-year. EBITDA declined by 11% despite higher revenue generation.

Earnings-per-share of $0.90 during the fourth quarter beat the analyst consensus by $0.03. EPS declined by 11% on an adjusted basis, year-over-year.

Earnings-per-share are expected in a range of $3.60 to $3.80 on an adjusted basis. At the guidance midpoint of $3.70 per share, that represents an increase of around 4% relative to 2024.

Click here to download our most recent Sure Analysis report on ABM (preview of page 1 of 3 shown below):

Top Graham Number Dividend King: Stepan Co. (SCL)

Stepan manufactures basic and intermediate chemicals, including surfactants, specialty products, germicidal and fabric softening quaternaries, phthalic anhydride, polyurethane polyols and special ingredients for the food, supplement, and pharmaceutical markets.

It is organized into three distinct business lines: surfactants, polymers, and specialty products. These businesses serve a wide variety of end markets, meaning that Stepan is not beholden to just a handful of industries.

Source: Investor presentation

The surfactants business is Stepan’s largest by revenue, accounting for ~68% of total sales in the most recent quarter. A surfactant is an organic compound that contains both water-soluble and water-insoluble components.

Stepan posted fourth quarter and full-year earnings on February 19th, 2025, and results were mixed once again. Revenue was down 1.2% year-on-year to $526 million, but did beat estimates by almost $5 million. Adjusted earnings-per-share came to 12 cents, which missed estimates by 21 cents.

Global sales volume was off 1% year-over-year as double-digit growth in surfactants was offset and then some by demand weakness in polymers. Surfactants were up 3% year-over-year in Q4 to $379 million. Polymer net sales fell 12% to $130 million.

The company managed to generate about $13 million in pre-tax cost savings during the quarter, and about $48 million for the full year.

Click here to download our most recent Sure Analysis report on SCL (preview of page 1 of 3 shown below):

Top Graham Number Dividend King: Black Hills Corp. (BKH)

Black Hills Corporation is an electric utility that provides electricity and natural gas to customers in Colorado, Iowa, Kansas, Montana, Nebraska, South Dakota, and Wyoming.

The company has 1.35 million utility customers in eight states. Its natural gas assets include 49,200 miles of natural gas lines. Separately, it has ~9,200 miles of electric lines and 1.4 gigawatts of electric generation capacity.

Source: Investor Presentation

Black Hills Corporation reported its fourth quarter earnings results in February. The company generated revenues of $597 million during the quarter, which was up 1% year-over-year.

Earnings-per-share of $1.37 during the fourth quarter was above the consensus analyst estimate. Earnings-per-share were up by close to 20% versus the previous year’s quarter. Q4 and Q1 are seasonally stronger quarters due to higher natural gas demand for heating, which was again showcased by the above-average profitability during the fourth quarter.

Black Hills Corporation forecasts earnings-per-share of $4.00 to $4.20 for the current fiscal year.

Click here to download our most recent Sure Analysis report on BKH (preview of page 1 of 3 shown below):

Top Graham Number Dividend King: Northwest Natural Holding (NWN)

Northwest was founded over 160 years ago as a natural gas utility in Portland, Oregon.

It has grown from a very small, local utility that provided gas service to a handful of customers to a very successful regional utility with interests that now include water and wastewater, which were purchased in recent acquisitions.

Source: Investor Presentation

Northwest provides gas service to 2.5 million customers in ~140 communities in Oregon and Washington, serving more than 795,000 connections. It also owns and operates ~35 billion cubic feet of underground gas storage capacity.

On February 28, 2025, Northwest Natural Holding Company (NWN) reported its financial results for the fourth quarter of 2024. The company achieved an adjusted net income of $90.6 million for the full year, or $2.33 per share, slightly down from $93.9 million, or $2.59 per share, in 2023.

This decrease was primarily due to regulatory lag affecting the first ten months of 2024 until new Oregon gas utility rates became effective on November 1. The utility margin increased by $26.3 million, mainly due to these new rates.

Click here to download our most recent Sure Analysis report on NWN (preview of page 1 of 3 shown below):

Top Graham Number Dividend King: United Bankshares (UBSI)

United Bankshares was formed in 1982 and since that time, has acquired more than 30 separate banking institutions.

This focus on acquisitions, in addition to organic growth, has allowed United to expand in the Mid-Atlantic with about $30 billion in total assets, and annual revenue of about $1 billion.

United posted fourth quarter and full-year earnings on January 24th, 2025, and results were better than expected on the bottom line, but missed revenue estimates.

Earnings came to 69 cents per share, which was 33 cents ahead of estimates. Revenue was off slightly to $262 million, missing estimates by $12 million.

Provisions for credit losses came to $6.7 million, a slight improvement year-over-year. Net interest income came to $232 million, up 1% from Q3. The boost came primarily from a lower average rate paid on deposits.

This was partially offset by a lower yield on average net loans and leases held for sale. Average earning assets rose $556 million, or 2%, from Q3. Most of this was due to an increase in short term investments of $420 million.

The yield on average net loans and leases was down 18 basis points from Q3. Net interest margin for the fourth quarter was down three basis points from Q3 at 3.49%.

Click here to download our most recent Sure Analysis report on UBSI (preview of page 1 of 3 shown below):

Top Graham Number Dividend King: Universal Corp. (UVV)

Universal Corporation is a market leader in supplying leaf tobacco and other plant-based inputs to consumer product manufacturers.

The Tobacco Operations segment buys and sells tobacco used to make cigarettes, cigars, pipe tobacco, and smokeless products.

Universal buys tobacco from its suppliers, processes it, and sells it to large tobacco companies in the US and internationally.

Source: Investor Presentation

The Ingredient Operations deal mainly with vegetables and fruits but is significantly smaller than the tobacco operations.

Universal Corporation reported its third quarter earnings results in February. The company generated revenues of $937 million during the quarter, which was more than the revenues that Universal Corporation generated during the previous period.

Revenues were positively impacted by product mix changes, while larger and better-yielding crops also had a positive impact on the company’s top-line. Universal Corporation’s revenues also rose on a year-over-year basis, showing a 14% increase.

Click here to download our most recent Sure Analysis report on Universal (preview of page 1 of 3 shown below):

Top Graham Number Dividend King: Farmers & Merchants Bancorp (FMCB)

Farmers & Merchants Bancorp is a locally owned and operated community bank with 32 locations in California. Due to its small market cap and its low liquidity, it passes under the radar of most investors.

F&M Bank has paid uninterrupted dividends for 88 consecutive years and has raised its dividend for 59 consecutive years.

In late January, F&M Bank reported (1/23/25) financial results for the fourth quarter of fiscal 2024. The bank grew its earnings-per-share 9% over the prior year’s quarter, from $28.55 to a new all-time high of $31.11. Loans and deposits grew 1% each.

Net interest income dipped -3% due to a contraction of net interest margin from 4.30% to 4.05% amid higher deposit costs. Management remains optimistic for the foreseeable future, as the bank enjoys one of the widest net interest margins in its sector.

We reiterate that F&M Bank is one of the most resilient banks during downturns, such as the pandemic, a potential recession or the financial turmoil caused by the collapse of Silicon Valley Bank, Credit Suisse and First Republic.

Click here to download our most recent Sure Analysis report on FMCB (preview of page 1 of 3 shown below):

Top Graham Number Dividend King: Archer Daniels Midland (ADM)

Archer-Daniels-Midland is the largest publicly traded farmland product company in the United States. Its businesses include processing cereal grains, oilseeds, and agricultural storage and transportation.

Archer-Daniels-Midland reported its third-quarter results for Fiscal Year (FY) 2024 on November 18th, 2024.

The company reported adjusted net earnings of $530 million and adjusted EPS of $1.09, both down from the prior year due to a $461 million non-cash charge related to its Wilmar equity investment.

Consolidated cash flows year-to-date reached $2.34 billion, reflecting strong operations despite market challenges.

Click here to download our most recent Sure Analysis report on ADM (preview of page 1 of 3 shown below):

Additional Reading

Screening to find the best Dividend Kings is not the only way to find high-quality dividend growth stock ideas.

Sure Dividend maintains similar databases on the following useful universes of stocks:

Thanks for reading this article. Please send any feedback, corrections, or questions to [email protected].


Source link

What Will The Economy Look Like With Half As Much Immigration?


Key Takeaways

  • Immigration has plummeted since President Trump took office, with the U.S. now on pace to receive half as many immigrants per year than pre-pandemic rates.
  • The Trump administration has not stepped up the pace of deportations, but fewer refugees are coming to the country.
  • The slowdown could affect industries that heavily rely on immigrant labor, including agriculture and homebuilding.

President Donald Trump’s crackdown on the border has cut immigration to half its pre-pandemic rate, according to a new analysis.

The U.S. is on pace to receive 500,000 immigrants in 2025, down from a typical rate of 1 million per year before the pandemic and a sharp decline from the recent peak of immigration in late 2023 when people were entering the country at a rate of 3.5 million-4 million per year, Elsie Peng, U.S. economist at Goldman Sachs, wrote in a commentary Tuesday.

Reducing immigration was a major focus of President Donald Trump’s run for president, and several actions shortly after his inauguration were aimed at tightening security at the border. He also promised to deport immigrants already in the country, but Goldman didn’t see a major uptick in deportations in the data as of February. Instead, the decline in net immigration was driven by a “collapse” of refugees and other immigrants without visas or green cards to an annualized rate of 200,000 from 1.4 million.

The decrease in immigration could have major effects on the economy, especially if significant numbers of immigrants already in the country without authorization stop working for fear of being deported, as anecdotal reports have suggested.

Certain industries, including agriculture and homebuilding, heavily rely on immigrant labor and may face slowdowns and cost increases. Forecasters at Goldman estimate the Gross Domestic Product, a measure of economic output, will grow 0.1 percentage point slower this year than if 1 million immigrants per year were still coming in.


Source link

Tap Into These 5 Free Tax Help Resources Before It’s Too Late


If you are having trouble with your taxes, tap one of these five free resources for help.

The Internal Revenue Service (IRS) offers two programs to help you do your taxes, the Defense Department backs one, the AARP Foundation runs one, and one is a federal grant program that provides help with tax disputes. All have answers to the tax questions you may be struggling with alone.

Key Takeaways

  • Volunteer Income Tax Assistance helps people with incomes up to $67,000, limited English, or disabilities.
  • Tax Counseling for the Elderly offers free tax assistance for people 60 and older.
  • MilTax offers free one-on-one counseling sessions and free tax software to military members and their families.
  • AARP Foundation Tax Aide aims to help people 50 and older with low and moderate incomes, but this free program is open to everyone.
  • Low Income Taxpayer Clinics help taxpayers who are having disputes with the IRS. The service is provided for free or for a slight fee.

1. Volunteer Income Tax Assistance (VITA)

This IRS program has been helping taxpayers for more than 50 years. To qualify for this free tax help, you’ll need an income of $67,000 or lower. People with disabilities and people who speak limited English also qualify.

VITA sites are run by IRS partners, and the volunteers who fill out tax returns must pass tax law training that meets the IRS’s standards.

“The volunteer preparers I’ve worked with took the service very seriously, many coming back year after year to help elderly and lower-income taxpayers,” says Mark Rosinski, a certified financial planner with Dunes Financial. “Also, every VITA volunteer is required to pass IRS training before every tax season. And lastly, every return is reviewed by another preparer for a second set of eyes before filing,”

The VITA locator tool allows you to find a Volunteer Income Tax Assistance site near you by searching by zip code.

“If it’s difficult for someone to sit and wait for their return to be completed, many VITA programs now offer a drop-off program. This allows a taxpayer to drop off their documents and come back when completed, saving them time and money.” Rosinski says.

2. Tax Counseling for the Elderly (TCE)

This IRS program provides free tax help for people 60 and up. Questions about pensions and other retirement-related questions are all answered in this free program. The VITA locator tool can be used to find Tax Counseling for the Elderly sites. Like VITA, this program is managed by the IRS, and the program sites are run by IRS partners and volunteers who must pass tax law training that is up to the standards set by the IRS.

3. MilTax Free Tax Services

MilTax provides free tax software and free tax assistance for military members. Military tax experts offer one-on-one help, and the free tax software is designed for the specific tax issues of military life. MilTax helps military members file a federal tax return and up to three state returns. The service is available to military members and their families. For in-person assistance, check the VITA locator for programs on military installations.

4. AARP Foundation Tax Aide

While AARP Foundation Tax Aide offers help to everyone who reaches out, the focus of the program is helping people 50 and up with moderate to low income. Started in 1968, AARP Tax Aide is available in more than 3,600 locations across the United States. Volunteers are certified by the IRS. To find a location near you, use this locator tool.

5. Low Income Taxpayer Clinics (LITC)

These clinics offer tax help for people with low incomes who have tax disputes with the IRS. Tax services are free or for a small fee. The disputed tax amount is typically below $50,000. A clinic locator is found on the program’s website. Low Income Taxpayer Clinics also provide outreach to people who speak English as a second language.

The Bottom Line

With April 15 around the corner, it is not too late to reach out for some free tax help in filing your return. Which free service is right for you? Volunteer Income Tax Assistance is for people with disabilities, limited English, and those who make up to $67,000 a year. Tax Counseling for the Elderly offers tax assistance for people 60 and up.

AARP Foundation Tax Aide is free and open to everyone, but it aims to help taxpayers 50 and older with low and moderate incomes. MilTax offers free tax help, including free tax software, to military members and their families. If you have a dispute with the IRS, contact Low-Income Taxpayer Clinics. You’ll get tax assistance for free or a modest fee.


Source link

Social Security Could Be Privatized Under DOGE, Democrats Warn. What Would That Mean?


KEY TAKEAWAYS

  • Left-leaning politicians warn that the budget cuts to the Social Security Administration that Elon Musk’s Department of Government Efficiency is making are a precursor to privatizing Social Security.
  • Some presidents in the past have proposed privatizing Social Security, which could solve the program’s funding problems.
  • However, the transition would be difficult, with either retirees getting a cut in benefits or current workers’ required contributions increasing.

Democrats and Independents have warned that cuts to the Social Security Administration’s budget budget are a step toward privatizing Social Security, a move that experts say could help solve the program’s decreasing funding but would be a difficult transition.

As part of the Department of Government Efficiency’s goal to reduce federal spending, the SSA plans to cut or avoid spending $800 million this fiscal year and cut more than 12% of its workforce. While neither the White House nor DOGE have definitively said that their goal is to privatize Social Security, DOGE advisor Elon Musk’s comments have concerned some left-leaning politicians.

“[Musk has] been on television the last couple of days talking exactly about Social Security, Medicare and Medicaid and what he intends to do—privatize it,” said Rep. John Larson (D-CT) during a committee meeting last week.

Additionally, politicians say Musk’s criticisms of the program’s older database and calling Social Security “the biggest Ponzi scheme of all time” are intended to turn the public’s attitude about SSA negative.

“Why do you make it look like it’s a broken, dysfunctional system? The reason is to get people to lose faith in the system, and then you can give it over to Wall Street,” said Sen. Bernie Sanders (I-VT) in an interview with CNN.

What Does This Mean For Beneficiaries?

As the main trust fund for Social Security is expected to expire in 2033 and benefits would reduce by 17%, some have seen privatization as the program’s savior. Former Presidents Bill Clinton and George W. Bush both proposed privatization actions, but the attempts were abandoned.

If Bush had been successful, Americans would have had four times the amount of retirement money, based on the return of the S&P 500 Index over time, said BlackRock CEO Larry Fink at a BlackRock retirement summit on Wednesday, as reported by CNBC.

“The problem we have now, we have a plan called Social Security that doesn’t grow with the economy,” Fink said.

Today, Social Security is funded by payroll taxes, which are pooled into a trust fund to pay benefits to current retirees and invest in U.S. Treasury securities. Social Security benefit amounts are determined by a formula that takes a person’s average earnings and the age at which they retire.

Comparatively, privatized Social Security would transfer the management of the funds to the private sector, with potentially some form of partial government funding or guarantees. It would likely eliminate payroll taxes in lieu of individual contributions for private accounts, which could be invested in higher-earning but higher-risk investments.

However, it may be difficult to transfer to a private plan. Payroll taxes would need to be diverted into private accounts, yet that leaves current retirees without any funding. This means retirees’ benefits might have to be cut, or current workers would have to pay into both their private accounts and payroll taxes until the transition is complete.

According to a recent survey of those 60 and older by SeniorLiving.org, only 11% were in favor of privatizing Social Security.


Source link

Nvidia Stock Dropped After CEO Delivered GTC Keynote—Watch These Key Levels


Key Takeaways

  • Nvidia shares slid Tuesday as CEO Jensen Huang gave a highly anticipated keynote address at the AI chipmaker’s GTC conference.
  • After setting a record high in January, the stock has traded within a descending channel, potentially undergoing a consolidation phase before resuming its longer-term uptrend.
  • Investors should monitor key support levels on Nvidia’s chart around $96 and $76, while also tracking important resistance levels near $132 and $150.
  • Bars pattern analysis, which takes the bars that comprise the stock’s trending move from October 2023 to March last year and overlays them from this month’s low, predicts a potential upside price target of around $325.

Nvidia (NVDA) shares fell Tuesday as CEO Jensen Huang gave a highly anticipated keynote address at the AI chipmaker’s GTC conference.

During his two-hour presentation, Huang unveiled the company’s roadmap for the next two years, providing updates about its Blackwell and next generation Rubin chips, while also showcasing cutting edge AI tech for robotics and telecommunications. Huang also announced a new partnership with General Motors (GM) to train AI manufacturing models.

The flurry of announcements wasn’t enough to lift investor spirits. Nvidia shares, which were down about 1% before the CEO started speaking, closed the day 3.4% lower at $115.43. Investors will be on the lookout for further updates from Nvidia as the conference continues in the next few days.

After several years of explosive gains driven by insatiable demand for the company’s AI offerings, Nvidia shares have come under pressure in early 2025 The stock is trading down 14% since the start of the year amid concerns about overspending on AI infrastructure and uncertainty surrounding the Trump administration’s trade policies relating to tariffs and chip exports.

With GTC 2025 underway, let’s take a closer look at Nvidia’s weekly chart and use technical analysis to locate key price levels worth watching.

Descending Channel Consolidation

Since setting a record high in January, Nvidia shares have traded within a descending channel, potentially undergoing a consolidation phase before resuming their longer-term uptrend.

More recently, the stock found buyers near the descending channel’s lower trendline, though price action has remained lackluster since. Meanwhile, the relative strength index (RSI) remains below the 50 threshold, pointing to weak momentum.

Let’s identify key support and resistance levels on Nvidia’s chart that investors may be monitoring and also project an upside price target to track if the stock resumes its longer-term move higher.

Key Support Levels to Monitor

A breakdown below the descending channel’s lower trendline could see the shares decline to around $96. This area on the chart would likely provide support near the last year’s March peak and August trough.

A more significant drop could see the stock’s price revisit lower support at the $76 level. Investors may seek entry points in this region near the low of a four-week pullback in the stock last April. 

Important Resistance Levels to Watch

Buying from current levels could propel a move up to around $132, a location that may provide overhead resistance near a horizontal line that links a range of comparable price points on the chart between last June and February this year.

The next higher resistance level to watch sits at the key $150 level. Investors who have come into the stock at lower prices may look to lock in profits in this area near a series of peaks positioned just below the stock’s record high.

Upside Price Target to Track

To project a potential longer-term upside target to track if the stock resumes its uptrend, investors can apply bars pattern analysis, which analyzes prior trends to make future price predictions.

When applying this technique to Nvidia’s chart, we take the bars that comprise the trending move from October 2023 to March last year and overlay them from this month’s low. The analysis speculates a potential upside price target of around $325 if a comparable move played out. We selected this prior trend as it followed a similar consolidation pattern on the chart.

The comments, opinions, and analyses expressed on Investopedia are for informational purposes only. Read our warranty and liability disclaimer for more info.

As of the date this article was written, the author does not own any of the above securities.


Source link

All 137 Dividend Champions In March 2025


Updated on March 18th, 2025 by Bob Ciura

Income investors are always on the hunt for high-quality dividend stocks. There are many ways to measure high-quality stocks. One way for investors to find great dividend stocks is to focus on those with the longest histories of raising dividends.

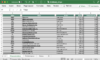
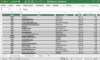
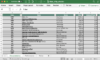
With this in mind, we created a downloadable list of over 130 Dividend Champions.

You can download your free copy of the Dividend Champions list, along with relevant financial metrics like price-to-earnings ratios, dividend yields, and payout ratios, by clicking on the link below:


Investors are likely familiar with the Dividend Aristocrats, a group of 69 stocks in the S&P 500 Index with 25+ consecutive years of dividend increases.

Meanwhile, investors should also familiarize themselves with the Dividend Champions, which have also raised their dividends for at least 25 years in a row.

While their length of dividend increases is the same, leading to some overlap, there are also some important differences between the Dividend Aristocrats and Dividend Champions.

As a result, the Dividend Champions list is much more expansive. There are many high-quality Dividend Champions that are not included on the Dividend Aristocrats list.

This article will discuss the Dividend Champions, and an analysis of our top 7 Dividend Champions now, ranked according to expected total returns in the Sure Analysis Research Database.

Table of Contents

You can instantly jump to any specific section of the article by clicking on the links below:

Overview of Dividend Champions

The requirement to become a Dividend Champion is simple: 25+ years of consecutive annual dividend increases. The Dividend Aristocrats have the same requirement when it comes to number of years, but with a few additional requirements.

To be a Dividend Aristocrat, a company must also be included in the S&P 500 Index, must have a float-adjusted market cap of at least $3 billion, and must have an average daily value traded of at least $5 million.

These added requirements preclude many companies that possess a sufficient track record of annual dividend increases, but do not qualify based on market cap or liquidity reasons.

As a result, while there is some overlap between the Dividend Aristocrats and the Dividend Champions, there are also many Dividend Champions that are not Dividend Aristocrats.

Income investors might want to consider these stocks due to their impressive histories of annual dividend increases, so we have compiled them in the downloadable spreadsheet above.

In addition, we have ranked the top 7 Dividend Champions according to total expected annual returns over the next five years. Our top 7 Dividend Champions right now are ranked below.

The Top 7 Dividend Champions To Buy Right Now

The following 7 stocks represent Dividend Champions with at least 25 consecutive years of dividend increases, but they also have durable competitive advantages, long-term growth potential, and high expected total returns.

Stocks have been ranked by expected total annual return over the next five years, from lowest to highest.


Top Dividend Champion #7: PepsiCo Inc. (PEP)

  • 5-year expected returns: 15.4%

PepsiCo is a global food and beverage company that generates $89 billion in annual sales. The company’s products include Pepsi, Mountain Dew, Frito-Lay chips, Gatorade, Tropicana orange juice and Quaker foods.

Its business is split roughly 60-40 in terms of food and beverage revenue. It is also balanced geographically between the U.S. and the rest of the world.

Source: Investor Presentation

On February 4th, 2025, PepsiCo announced that it would increase its annualized dividend by 5.0% to $5.69 starting with the payment that was made in June 2025, extending the company’s dividend growth streak to 53 consecutive years.

That same day, PepsiCo announced fourth quarter and full year results for the period ending December 31st, 2025. For the quarter, revenue decreased 0.3% to $27.8 billion, which was $110 million below estimates.

Adjusted earnings-per-share of $1.96 compared favorably to $1.78 the prior year and was $0.02 better than excepted.

For the year, revenue grew 0.4% to $91.9 billion while adjusted earnings-per-share of $8.16 compared to $7.62 in 2023. Currency exchange reduced revenue by 2% and earnings-per-share by 4%.

Click here to download our most recent Sure Analysis report on PEP (preview of page 1 of 3 shown below):


Top Dividend Champion #6: Andersons Inc. (ANDE)

  • 5-year expected returns: 15.5%

The Andersons, Inc. (ANDE) is an agriculture company that conducts business in North America. It operates through the following segments: Trade, Renewables, and Nutrient & Industrial (formerly Plant Nutrient).

The Trade segment includes commodity merchandising and the operation of terminal grain elevator facilities. The Trade segment contributed over 68% of the company’s revenue in 2024.

The Renewables segment produces, purchases, and sells ethanol and co-products.

The Nutrient & Industrial segment manufactures, and distributes agricultural inputs, primary nutrients, and specialty fertilizers, to dealers and farmers, along with turf care and corncob-based products.

On February 18th, 2025, The Andersons released its fourth quarter and full year results for the period ending December 31st, 2024. For the quarter, the company reported revenue of $3.12 billion, a decrease from the $3.21 billion reported in the same quarter of the previous year.

The revenue decline continued to reflect weaker commodity prices and overall market sluggishness, which impacted the company’s trading and merchandising activities. Net income for the quarter was $45 million, or $1.31 per diluted share, down from $51 million, or $1.49 per diluted share, in the previous year’s fourth quarter.

Click here to download our most recent Sure Analysis report on ANDE (preview of page 1 of 3 shown below):


Top Dividend Champion #5: Gorman-Rupp Co. (GRC)

  • 5-year expected returns: 16.8%

Gorman-Rupp began manufacturing pumps and pumping systems back in 1933. Since that time, it has grown into an industry leader with annual sales of nearly $700 million and a market capitalization of $1 billion.

Today, Gorman-Rupp is a focused, niche manufacturer of critical systems that many industrial clients rely upon for their own success.

Gorman Rupp generates about one-third of its total revenue from outside of the U.S.

Source: Investor Presentation

Gorman-Rupp posted fourth quarter and full-year earnings on February 7th, 2025, and results were weaker than expected. Adjusted earnings-per-share came to 42 cents, which was three cents light of estimates.

Revenue was up 1.3% year-over-year to $162.7 million, which matched expectations. The increase in sales was primarily attributed to the impact of pricing increases taken in the year-ago period.

Gross profit was $49.2 million for the quarter, or 30.2% of revenue. These were down from $50.9 million and 31.7%, respectively, in the same period of 2023.

The decline in gross margins of 150 basis points included 220 basis points of increased labor and overhead costs, which were driven by healthcare expenses.

That was partially offset by a 70-basis point improvement in cost of materials, which itself was driven by a 140-basis point improvement in selling prices offset by a 70-basis point decline from inventory costing.

Click here to download our most recent Sure Analysis report on GRC (preview of page 1 of 3 shown below):


Top Dividend Champion #4: Sonoco Products (SON)

  • 5-year expected returns: 17.4%

Sonoco Products provides packaging, industrial products and supply chain services to its customers. The markets that use the company’s products include those in the appliances, electronics, beverage, construction and food industries.

The company generates over $5 billion in annual sales. Sonoco Products is now composed of 2 major segments, Consumer Packaging, and Industrial Packaging, with all other businesses listed as “All Other”.

Source: Investor Presentation

On February 18th, 2025, Sonoco Products announced fourth quarter results for the period ending December 31st, 2024.

For the quarter, revenue grew 1.5% to $1.36 billion, which was $310 million less than expected. Excluding the impact of acquisitions, adjusted earnings-per-share of $1.17 compared to $1.02 in the prior year, but was $0.03 less than expected.

For the year, revenue declined 3% to $5.3 billion while adjusted earnings-per-share of $4.89 compared to $5.26 in 2023.

Click here to download our most recent Sure Analysis report on Sonoco (SON) (preview of page 1 of 3 shown below):


Top Dividend Champion #3: SJW Group (SJW)

  • 5-year expected returns: 18.0%

SJW Group is a water utility company that produces, purchases, stores, purifies and distributes water to consumers and businesses in the Silicon Valley area of California, the area north of San Antonio, Texas, Connecticut, and Maine.

SJW Group has a small real estate division that owns and develops properties for residential and warehouse customers in California and Tennessee. The company generates about $670 million in annual revenues.

On February 27th, 2025, SJW Group announced fourth quarter and full year results for the period ending December 31st, 2024. For the quarter, revenue improved 15.5% to $197.8 million, which topped expectations by $10.3 million.

Earnings-per-share of $0.74 compared favorably to earnings-per-share of $0.59 in the prior year and was $0.19 ahead of estimates. For the year, revenue grew 12% to $748.4 million while earnings-per-share of $2.87 compared to $2.68 in
2023.

For the quarter, higher water rates overall added $22.8 million to results and higher customer usage added $9.9 million while regulatory mechanisms lowered revenue totals by $7.1 million. Operating production expenses totaled $154.2 million, which was a 14% increase from the prior year.

Click here to download our most recent Sure Analysis report on SJW (preview of page 1 of 3 shown below):


Top Dividend Champion #2: Eversource Energy (ES)

  • 5-year expected returns: 18.7%

Eversource Energy is a diversified holding company with subsidiaries that provide regulated electric, gas, and water distribution service in the Northeast U.S.

FactSet, Erie Indemnity, and Eversource Energy are the three new Dividend Aristocrats for 2025.

The company’s utilities serve more than 4 million customers after acquiring NStar’s Massachusetts utilities in 2012, Aquarion in 2017, and Columbia Gas in 2020.

Eversource has delivered steady growth to shareholders for many years.

Source: Investor Presentation

On February 11th, 2025, Eversource Energy released its fourth-quarter and full-year 2024 results. For the quarter, the company reported net earnings of $72.5 million, a significant improvement from a net loss of $(1,288.5) million in the same quarter of last year, which reflected the impact of the company’s exit from offshore wind investments.

The company reported earnings per share of $0.20, compared with a loss per share of $(3.68) in the prior year. For the full year 2024, Eversource reported GAAP earnings of $811.7 million, or $2.27 per share, compared with a full-year 2023 loss of $(442.2) million, or $(1.26) per share.

On a non-GAAP recurring basis, the company earned $1,634.0 million, or $4.57 per share, representing a 5.3% increase from 2023.

Click here to download our most recent Sure Analysis report on ES (preview of page 1 of 3 shown below):


Top Dividend Champion #1: Stepan Co. (SCL)

  • 5-year expected returns: 19.9%

Stepan manufactures basic and intermediate chemicals, including surfactants, specialty products, germicidal and fabric softening quaternaries, phthalic anhydride, polyurethane polyols and special ingredients for the food, supplement, and pharmaceutical markets.

It is organized into three distinct business lines: surfactants, polymers, and specialty products. These businesses serve a wide variety of end markets, meaning that Stepan is not beholden to just a handful of industries.

Source: Investor presentation

The surfactants business is Stepan’s largest by revenue, accounting for ~68% of total sales in the most recent quarter. A surfactant is an organic compound that contains both water-soluble and water-insoluble components.

Stepan posted fourth quarter and full-year earnings on February 19th, 2025, and results were mixed once again. Revenue was down 1.2% year-on-year to $526 million, but did beat estimates by almost $5 million. Adjusted earnings-per-share came to 12 cents, which missed estimates by 21 cents.

Global sales volume was off 1% year-over-year as double-digit growth in surfactants was offset and then some by demand weakness in polymers. Surfactants were up 3% year-over-year in Q4 to $379 million. Polymer net sales fell 12% to $130 million.

The company managed to generate about $13 million in pre-tax cost savings during the quarter, and about $48 million for the full year.

Click here to download our most recent Sure Analysis report on SCL (preview of page 1 of 3 shown below):

Final Thoughts

The various lists of stocks by length of dividend history are a good resource for investors who focus on high-quality dividend stocks.

In order for a company to raise its dividend for at least 25 years, it must have durable competitive advantages, highly profitable businesses, and leadership positions in their respective industries.

They also have long-term growth potential and the ability to navigate recessions while continuing to raise their dividends.

The top 7 Dividend Champions presented in this article have long histories of dividend growth, and the combination of high dividend yields, low valuations, and future earnings growth potential make them attractive buys right now.

The Dividend Champions list is not the only way to quickly screen for stocks that regularly pay rising dividends.

  • The Dividend Kings List is even more exclusive than the Dividend Aristocrats. It is comprised of 54 stocks with 50+ years of consecutive dividend increases.
  • The High Dividend Stocks List: stocks that appeal to investors interested in the highest yields of 5% or more.
  • The Monthly Dividend Stocks List: stocks that pay dividends every month, for 12 dividend payments per year.

Thanks for reading this article. Please send any feedback, corrections, or questions to [email protected].


Source link

Will Amazon Ever Pay A Dividend?


Updated on March 18th, 2025 by Bob Ciura

Over the past decade, many technology stocks such as Apple, Inc. (AAPL), Cisco Systems (CSCO), and more have initiated dividend payments to shareholders.

While the technology industry has widely embraced dividends, not all tech companies pay dividends. One lingering holdout to paying dividends to shareholders is e-commerce giant Amazon.com Inc. (AMZN).

Rather than return cash to shareholders, Amazon continues to plow its cash flow back into the business.

The decision whether or not a company should pay a dividend depends on many factors. Thousands of stocks pay dividends to shareholders, and an elite few have maintained long histories of raising their dividends every year.

For example, the Dividend Aristocrats are a group of 69 stocks in the S&P 500 that have raised their dividends for 25+ years in a row.

You can download an Excel spreadsheet of all Dividend Aristocrats (with important financial metrics such as price-to-earnings ratios and dividend yields) by clicking the link below:


Amazon’s lack of a dividend certainly has not hurt investors to this point, as Amazon has been a premier tech stock.

Over the past 10 years, Amazon stock generated total returns of over 900%.

But for income investors, Amazon may not be an attractive option due to the lack of a dividend payment.

This article will discuss the chances of Amazon ever paying a dividend.

Business Overview

Amazon is an online retailer that operates a massive e-commerce platform where consumers can buy virtually anything with their computers or smartphones.

Amazon is a mega-cap stock with a market cap of more than $2 trillion. It operates through the following segments:

  • North America
  • International
  • Amazon Web Services

The North America and International segments include the global retail platform of consumer products through the company’s websites.

The Amazon Web Services segment sells subscriptions for cloud computing and storage services to consumers, start-ups, enterprises, government agencies, and academic institutions.

Amazon’s e-commerce operations fueled its massive revenue growth over the past decade. The company saw continued growth in the most recent quarter.

Related: Which is the better investment, dividend stocks or growth stocks?

In the 2024 fourth quarter, revenue of $187.7 billion increased 10% year-over-year, and beat analyst estimates by $563 million.

By segment, North America sales increased 10% year-over-year to $115.6 billion. International sales rose 9% excluding foreign currency translation, while AWS sales rose 19% year-over-year.

Source: Investor Presentation

While the retail business still operates at low gross margins, it continues to generate strong revenue growth.

Separately, the AWS segment is highly profitable, and is largely the reason for Amazon’s impressive earnings growth. Such strong earnings growth improves Amazon’s chances of paying a dividend at some point in the future.

That said, the company still plans to invest heavily in growth, which makes for uneven earnings-per-share from one quarter to the next.

Growth Prospects

As is typical with many technology companies, growth investment is Amazon’s top strategic priority. This is partly out of necessity.

Things move extremely fast in technology, which is a highly competitive industry. Technology firms need to invest large amounts to stay ahead of the pack.

Amazon is no different—it is making major investments to continue building its online retail platform. Amazon continues to grow its retail business.

It also acquired natural and organic grocer Whole Foods for nearly $14 billion. This gave Amazon the brick-and-mortar footprint it desired to further expand its reach in groceries.

Amazon isn’t stopping there. In addition to the retail industry, it aims to spread its tentacles into other industries as well, including media and healthcare.

Amazon has built a sizable media platform in which it distributes content to its Amazon Prime members.

Making original content is another highly capital-intensive endeavor, which will require huge sums in order for Amazon to compete with the likes of streaming giants Netflix (NFLX) and Hulu, as well as other television and movie studios.

Its media ambitions were augmented by its 2022 acquisition of MGM for $8.5 billion.

Now that Amazon dominates retail and media content, it is readying a bigger move into the healthcare industry.

In 2022 Amazon acquired One Medical in a $3.9 billion all-cash transaction, including One Medical’s debt. One Medical is a national primary care company.

These investments will fuel Amazon’s revenue growth, which is what the company’s investors are primarily concerned with. Nevertheless, such aggressive spending will limit Amazon’s ability to pay dividends to shareholders, at least for some time.

For the 2025 first quarter, Amazon expects net sales in a range of $151.0 billion and $155.5 billion, for 5%-9% year-over-year growth.

Operating income is expected to be between $14.0 billion and $18.0 billion, compared with $15.3 billion in the first quarter of 2024.

Will Amazon Ever Pay A Dividend?

Amazon has joined the ranks of profitable tech companies like Apple, Microsoft, and Cisco, all of which generate high earnings-per-share. Apple, Microsoft, and Cisco are now blue-chip tech dividend payers.

In theory, Amazon could pay a dividend, as the company should be profitable in fiscal 2025. Amazon’s earnings-per-share are forecast to be $6.32 for fiscal 2025.

The company can use its profits for a number of purposes, including debt repayment, reinvestment in future growth initiatives, paying dividends, or share buybacks.

If Amazon chose to, it could distribute a dividend to shareholders, although any announced dividend payout would likely be small, in terms of the dividend yield.

For example, even if Amazon maintained a dividend payout ratio of 25%, which would be appropriate for a growth-oriented tech company, the dividend of $1.58 per share would represent just a ~0.8% yield.

This would still be an unappealing yield for many income investors.

Final Thoughts

Amazon has been one of the most impressive growth companies in history. It now dominates the online retail industry. It is also a massive cloud services provider, as well as a movie studio and content streaming giant.

Ultimately, a company has to make the decision to initiate a dividend payment. This is often done when future growth no longer requires such heavy investment.

For Amazon, the company still has many new avenues for future expansion in mind, including (but not limited to) media content, grocery stores, and health care.

Growth is still very much the top priority for Amazon. As a result, investors should not expect a dividend payment any time soon.


At Sure Dividend, we often advocate for investing in companies with a high probability of increasing their dividends each and every year.

If that strategy appeals to you, it may be useful to browse through the following databases of dividend growth stocks:

Thanks for reading this article. Please send any feedback, corrections, or questions to [email protected].


Source link

Tax implications For Canadian Investors Buying U.S. Stocks


Updated on March 18th, 2025 by Bob Ciura

For Canadian investors, having exposure to the United States stock market is very important.

There are a number of reasons why.

First, the United States is the largest stock market in the world. In order to avoid home country bias and have a globally diversified investment portfolio, exposure to American stocks is required.

When it comes to the best U.S. dividend stocks to buy, we have compiled a list of blue-chip stocks with 10+ years of dividend increases.

Blue-chip stocks are established, financially strong, and consistently profitable publicly traded companies.

Their strength makes them appealing investments for comparatively safe, reliable dividends and capital appreciation versus less established stocks.

This research report has the following resources to help you invest in blue chip stocks:


Resource #1: The Blue Chip Stocks Spreadsheet List

This list contains important metrics, including: dividend yields, payout ratios, dividend growth rates, 52-week highs and lows, betas, and more.

There are currently more than 500 securities in our blue chip stocks list.

Second, there are certain sectors that are underrepresented in the Canadian stock market. Examples include healthcare, technology, and consumer staples. Interestingly, these sectors are among the strongest in the U.S. market.

To invest in stocks from the United States, Canadian investors need to understand how this will impact their tax bills.

This article will discuss the tax implications for Canadians that invest in U.S. stocks, including examples of dividend- and non-dividend-paying stocks held in both taxable accounts and non-taxable accounts.

Table of Contents

While we recommend reading this article in its entirety, you can skip to a particular section of this article using the table of contents below:

Capital Gains Tax

There are two types of investing taxes that Canadian investors will pay if they are investing outside of a tax-deferred retirement account. The first is capital gains tax, which will be discussed first.

A capital gain occurs when a security is sold for more than its purchase price. Conversely, a capital loss comes from selling a security for less than it was purchased for.

Canadian investors must pay capital gains tax on at least 50% of their realized capital gains. The 2024 Federal Budget announced an increase in the capital gains inclusion rate from 50% to two thirds on the portion of capital gains realized in the year that exceed $250,000 for individuals, for capital gains realized on or after June 25, 2024.

The $250,000 threshold applies to capital gains realized by an individual net of any capital losses realized in the current year or carried forward from prior years. The tax rate for capital gains is identical to the individual’s marginal tax rate.

Marginal tax rates are composed of a federal component (which is paid in the same amount by all Canadians) and a provincial component (which varies depending on which province you live in).

According to the Canada Revenue Agency, current federal tax rates by tax bracket are:

  • 15% on the first $55,867 of taxable income, +
  • 20.5% on the next $55,866 of taxable income (on the portion of taxable income over $55,867 up to $111,733), +
  • 26% on the next $61,472 of taxable income (on the portion of taxable income over $111,733 up to $173,205), +
  • 29% on the next $73,547 of taxable income (on the portion of taxable income over $173,205 up to $246,752), +
  • 33% of taxable income over $246,752.

As mentioned, provincial tax rates vary by province. Examples in this article will use Ontario’s tax rates, as it is Canada’s most highly-populated province. Ontario tax rates by tax bracket are shown below:

  • 5.05% on the first $46,226 of taxable income, +
  • 9.15% on the next $46,228, +
  • 11.16% on the next $57,546, +
  • 12.16% on the next $70,000, +
  • 13.16% on the amount over $220,000

So how do capital gains taxes vary for holders of U.S. stocks?

Fortunately, the capital gains tax paid on investments in U.S. stocks is identical to the capital gains paid on Canadian securities. The only minor difference is that capital gains must be expressed in Canadian dollars for the purpose of calculating an investor’s tax liability.

An example can help us understand capital gains tax from U.S. stocks in the context of these Canadian tax brackets. Let’s assume that you are a Canadian investor who has executed the following trades:

  • Purchased 100 shares Johnson & Johnson (JNJ) for US$100 at a time when the USD to CAD exchange rate was 1.25
  • Sold your Johnson & Johnson shares for US$125 at a time when the USD to CAD exchange rate was 1.15

You will pay capital gains on the difference between your purchase price and your sale price, expressed in Canadian dollars. The following table can help us to understand the proper way to calculate the CAD-denominated capital gain. Although not directly calculated in the image above, the capital gain for this transaction – expressed in U.S. dollars – is US$2,500.

However, that is irrelevant for the purpose of calculating capital gains tax because capital gains tax is based on transaction prices expressed in Canadian dollars. What really matters is the CAD$1,875 capital gain shown in the bottom right cell of the table.

This is the amount used to calculate capital gains. As mentioned previously, at least half of this amount would be taxed at the investor’s marginal tax rate. We will assume for simplicity’s sake that the investor is in the highest tax bracket, which is 46.16% for Ontario residents.

The following table breaks down the capital gains tax calculation for this hypothetical investment in Johnson & Johnson (JNJ). So, the capital gains tax would be at least $432.75.

This calculation was quite involved and demonstrates how complicated the calculation of capital gains tax can be for Canadians.

Fortunately, capital gains tax can be tax-free or tax-deferred if U.S. stocks (or stocks from any other country) are held in Canadian retirement accounts.

We discuss the two types of Canadian retirement accounts (TFSAs and RRSPs) in a later section of this article.

For now, we’ll move on to discussing the taxation of dividends paid to Canadian investors from U.S. corporations.

Dividend Tax

Unlike capital gains taxes (which are calculated in the same way for U.S. stocks and Canadian stocks), the taxes that Canadian investors pay on international stock dividends are different than the taxes they pay on domestic dividends.

This is due to a special type of dividend tax called “withholding tax.” Unlike other taxes paid by Canadian investors, these taxes are withheld at source (by the company that pays the dividend) and remitted to their own tax authority – which, for United States companies, is the Internal Revenue Service (IRS).

Dividend withholding taxes meaningfully reduce the income that Canadian investors are able to generate from U.S. stocks. Fortunately, this effect is partially offset by a special tax treaty between the United States and Canada (called the Convention Between Canada and the United States of America).

The U.S. withholding tax rate charged to foreign investors on U.S. dividends is normally 30% but is reduced to 15% for Canadians due to this treaty.

How does this compare to the average withholding tax of countries across the globe?

Even after accounting for the special tax treaty, the U.S. is still an unfavorable market for Canadian investors from the perspective of tax efficiency.

According to Blackrock, the weighted average foreign withholding tax on international stock dividends is 12%. Even after accounting for the tax treaty, Canadians still pay a 15% withholding tax — 25% higher than the weighted average dividend withholding tax around the world.

Canadian investors will be happy to hear that this foreign withholding tax is able to be reclaimed come tax time. The Canada Revenue Agency allows you to claim a foreign tax credit for the withholding tax paid on United States dividends. This prevents investors from paying tax twice on their dividend income.

Still, U.S. dividends are not as tax efficient as their Canadian counterparts. The reason why is somewhat complicated and is related to a Canadian taxation principle called the “dividend tax credit.”

The dividend tax credit meaningfully reduces the taxes that Canadians pay on dividends, and causes dividend income to be the single most tax-efficient form of income available to Canadians.

According to MoneySense:

When a non-resident invests in U.S stocks or U.S.-listed exchange traded funds (ETFs), the standard withholding tax on dividends is 30%. A Canadian resident is entitled to a lower withholding rate of 15% under a treaty between the two countries if they have filed a form W-8 BEN with the brokerage where they hold the investments.

Our recommendation for Canadian investors looking for exposure to U.S. stocks is to hold their U.S. stocks in retirement accounts, which simultaneously reduces their tax burden and dramatically reduces the tax complexity of their investment portfolios.

We discuss dividend taxes in retirement accounts in the next section of this article.

Dividend Tax in Retirement Accounts

The best way for Canadian investors to gain exposure to U.S. stocks is through retirement accounts.

There are two major retirement accounts available for Canadian investors:

Both offer tax-advantaged opportunities for Canadians to deploy their capital into financial assets. With that said, there are important differences as to how each account functions.

The Tax-Free Savings Account (TFSA) allows investors to contribute after-tax income into the account. Investment gains and dividends held within the account are subject to no tax and no tax is incurred upon withdrawal from the account. TFSAs are functionally similar to Roth IRAs in the United States.

The other type of retirement account in Canada is the Registered Retirement Savings Plan (RRSP). These accounts allow Canadian investors to contribute pre-tax income, which is then deducted from their gross income for the purpose of calculating each year’s income tax.

Income tax is paid later, upon withdrawals from the RRSP. RRSPs are functionally equivalent to 401(k)s within the United States. In other words, income earned in RRSPs at tax-deferred.

Both of these retirement accounts are very attractive because they allow investors to deploy their capital in a tax-efficient manner. In general, no tax is paid on both capital gains or dividends so long as the stocks are held within retirement accounts.

Unfortunately, there is one exception to this rule. The withholding tax paid to the IRS on dividends from United States businesses is still paid within TFSAs. For this reason, U.S. stocks that pay out large dividends should not be held within a TFSA if possible.

Instead, the RRSP is the best place to hold U.S. dividend stocks (but not MLPs, REITs, etc.) because the dividend withholding tax is waived. In fact, no tax is paid at all on U.S. stocks held within RRSPs.

This means that Canadian investors should hold all dividend-paying U.S. stocks within their RRSPs if they have sufficient contribution room. U.S. stocks that don’t pay dividends can be held in a TFSA.

Lastly, Canadian dividend stocks should be held in non-registered accounts to take advantage of the dividend tax credit.

Final Thoughts

This article began by discussing some of the benefits of owning U.S. stocks for Canadian investors before elaborating on the tax consequences of implementing such a strategy.

After describing the tax characteristics of U.S. stocks for Canadians, we concluded that the best practices are to:

  • Hold dividend-paying U.S. stocks within an RRSP
  • Hold non-dividend-paying or low-yielding U.S. stocks (that are expected to have higher growth prospects) within a TFSA
  • Hold Canadian stocks in a taxable account — especially dividend-paying Canadian stocks, to take advantage of the dividend tax credit

If you are a Canadian dividend investor and are interested in exploring the U.S. stock market, the following Sure Dividend databases contain some of the most high-quality dividend stocks in our investment universe:

  • The Dividend Aristocrats: S&P 500 stocks with 25+ years of consecutive dividend increases
  • The Dividend Achievers: dividend stocks with 10+ years of consecutive dividend increases
  • The Dividend Kings: considered to be the best-of-the-best when it comes to dividend growth, the Dividend Kings are an elite group of dividend stocks with 50+ years of consecutive dividend increases

Alternatively, you may be looking to tailor a very specific group of dividend stocks to meet certain yield and payout characteristics. If this is indeed the case, you will be interested in the following databases from Sure Dividend:

Another way to approach the U.S. stock market is by constructing your portfolio so that it owns companies in each sector of the stock market. For this reason, Sure Dividend maintains 10 databases of stocks from each sector of the market. you can access these databases below.

Thanks for reading this article. Please send any feedback, corrections, or questions to [email protected].


Source link

These Mistakes ‘Destroy Wealth.’ Are You Making Them?


Investing isn’t just about picking winners; it’s about avoiding costly mistakes. Barry Ritholtz, a financial expert and author of the 2025 book How Not To Invest, argues that many investors lose money not because they lack skill but because they fall into predictable traps. Ritholtz is the chief investment officer of the financial planning and asset management firm Ritholtz Wealth Management.

“You don’t have to be smarter than everyone else—just less stupid,” he said.

So, what are some of these wealth-destroying mistakes, and how can you steer clear of them?

Key Takeaways

  • Barry Ritholtz’s new book How Not to Invest warns investors of common pitfalls.
  • Trusting financial forecasts is a losing game. Instead, focus on reliable long-term strategies.
  • Emotional investing leads to costly mistakes; preparation and discipline are key.
  • An excessive fear of risk can be just as damaging as reckless investing.

1. Falling into the Forecasting Trap

Investors love predictions—price targets, earnings forecasts, and market outlooks. But Ritholtz warns, “The media thrives on feeding ‘the daily beast’—constantly churning out content to keep people engaged.”

In reality, most economic forecasts fail because markets are inherently unpredictable and influenced by random events.

How To Avoid It:

  • Curate a reliable network. “Build your own ‘all-star team’ of experts who don’t just get lucky but have a defensible, rational process,” Ritholtz said.
  • Ignore bold predictions. Specific forecasts might sound convincing, but they often mislead. Instead, focus on time-tested investment principles and take seriously experts who admit that they don’t know.
  • Think probabilistically. Investing is about putting the odds in your favor over time.

2. Emotional Investing

Market volatility triggers fear and greed, leading to rash decisions. “Plan ahead when you have the luxury of being rational and objective—not when the market is on fire,” Ritholtz said.

The worst mistakes—panic selling or chasing a hot stock—often occur when emotions take over.

How To Avoid It:

  • Automate investing. Setting up regular contributions through dollar-cost averaging or using an automated approach like a robo-advisor removes emotional decision-making.
  • Have a crisis plan. “Think of it like a fire drill,” Ritholtz said. “You don’t figure out what to do only when the flames are already at the door.”
  • Look long-term. Markets recover. Reacting to short-term swings can derail long-term success.

3. Focusing Too Much on Avoiding Losses

Much of Ritholtz’s strategy is about avoiding unnecessary mistakes. But an excessive fear of risk can be just as damaging as reckless investing. “Overly cautious investors often miss good opportunities,” he said. Sitting on too much cash or refusing to invest can mean losing out to inflation and market gains.

How To Avoid It:

  • Find balance. Don’t take extreme risks that put your financial future in danger, but avoiding reasonable risk entirely is its own mistake.
  • Invest for your goals. A well-diversified portfolio tailored to your risk tolerance can help you stay in the game.
  • Get expert guidance. If your finances are complex, consider a competent financial advisor, accountant, and attorney.

But Ignore ‘Spending Shamers’

Spending wisely is just as important as investing wisely. Many personal finance gurus today push extreme frugality, encouraging people to live below their means, but Ritholtz argues that financial health isn’t about denying yourself joy—it’s about making smart, intentional choices. “Ignore the spending shamers,” he said. “Being responsible doesn’t mean you can’t enjoy life.”

So, live within your means, but maximize it. “Look, if you want a boat—OK, but buy the one you can afford and will use. Make sure you’re getting value from your purchases,” he said.

How To Avoid Overspending:

  • Set financial priorities. Decide what truly matters to you and allocate funds accordingly.
  • Avoid lifestyle inflation. Just because you make more money doesn’t mean you have to spend more.
  • Spend on experiences, not just stuff. Long-term happiness often comes from meaningful experiences rather than material goods.

The Bottom Line

The biggest investment mistakes aren’t about picking the wrong stocks, they’re about falling into predictable traps. “If you avoid unforced errors, you’ll already be ahead of most investors,” Ritholtz said. Focus on long-term strategies, manage risk wisely, and let the markets work in your favor.


Source link