2025 Low Beta Stocks List


Updated on March 27th, 2025 by Bob Ciura

In the world of investing, volatility matters. Investors are reminded of this every time there is a downturn in the broader market and individual stocks that are more volatile than others experience enormous swings in price.

Volatility is a proxy for risk; more volatility generally means a riskier portfolio. The volatility of a security or portfolio against a benchmark is called Beta.

In short, Beta is measured via a formula that calculates the price risk of a security or portfolio against a benchmark, which is typically the broader market as measured by the S&P 500.

Here’s how to read stock betas:

  • A beta of 1.0 means the stock moves equally with the S&P 500
  • A beta of 2.0 means the stock moves twice as much as the S&P 500
  • A beta of 0.0 means the stocks moves don’t correlate with the S&P 500
  • A beta of -1.0 means the stock moves precisely opposite the S&P 500

Interestingly, low beta stocks have historically outperformed the market… But more on that later.

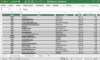
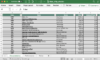
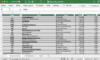
You can download a spreadsheet of the 100 lowest beta S&P stocks (along with important financial metrics like price-to-earnings ratios and dividend yields) below:


This article will discuss beta more thoroughly, why low-beta stocks tend to outperform, and provide a discussion of the 5 lowest-beta dividend stocks in the Sure Analysis Research Database.

The table of contents below allows for easy navigation.

Table of Contents

The Evidence for Low Beta Stocks Outperformance

Beta is helpful in understanding the overall price risk level for investors during market downturns in particular. The lower the Beta value, the less volatility the stock or portfolio should exhibit against the benchmark. This is beneficial for investors for obvious reasons, particularly those that are close to or already in retirement, as drawdowns should be relatively limited against the benchmark.

Importantly, low or high Beta simply measures the size of the moves a security makes; it does not mean necessarily that the price of the security stays nearly constant. Indeed, securities can be low Beta and still be caught in long-term downtrends, so this is simply one more tool investors can use when building a portfolio.

The conventional wisdom would suggest that lower Beta stocks should underperform the broader markets during uptrends and outperform during downtrends, offering investors lower prospective returns in exchange for lower risk.

However, history would suggest that simply isn’t the case. Indeed, this paper from Harvard Business School suggests that not only do low Beta stocks not underperform the broader market over time – including all market conditions – they actually outperform.

A long-term study wherein the stocks with the lowest 30% of Beta scores in the US were pitted against stocks with the highest 30% of Beta scores suggested that low Beta stocks outperform by several percentage points annually.

Over time, this sort of outperformance can mean the difference between a comfortable retirement and having to continue working. While low Beta stocks aren’t a panacea, the case for their outperformance over time – and with lower risk – is quite compelling.

How To Calculate Beta

The formula to calculate a security’s Beta is fairly straightforward. The result, expressed as a number, shows the security’s tendency to move with the benchmark.

For example, a Beta value of 1.0 means that the security in question should move in lockstep with the benchmark. A Beta of 2.0 means that moves in the security should be twice as large in magnitude as the benchmark and in the same direction, while a negative Beta means that movements in the security and benchmark tend to move in opposite directions or are negatively correlated.

Related: The S&P 500 Stocks With Negative Beta.

In other words, negatively correlated securities would be expected to rise when the overall market falls, or vice versa. A small value of Beta (something less than 1.0) indicates a stock that moves in the same direction as the benchmark, but with smaller relative changes.

Here’s a look at the formula:

Beta FormulaBeta Formula

The numerator is the covariance of the asset in question with the market, while the denominator is the variance of the market. These complicated-sounding variables aren’t actually that difficult to compute – especially in Excel.

Additionally, Beta can also be calculated as the correlation coefficient of the security in question and the market, multiplied by the security’s standard deviation divided by the market’s standard deviation.

Finally, there’s a greatly simplified way to calculate Beta by manipulating the capital asset pricing model formula (more on Beta and the capital asset pricing model later in this article).

Here’s an example of the data you’ll need to calculate Beta:

  • Risk-free rate (typically Treasuries at least two years out)
  • Your asset’s rate of return over some period (typically one year to five years)
  • Your benchmark’s rate of return over the same period as the asset

To show how to use these variables to do the calculation of Beta, we’ll assume a risk-free rate of 2%, our stock’s rate of return of 7% and the benchmark’s rate of return of 8%.

You start by subtracting the risk-free rate of return from both the security in question and the benchmark. In this case, our asset’s rate of return net of the risk-free rate would be 5% (7% – 2%). The same calculation for the benchmark would yield 6% (8% – 2%).

These two numbers – 5% and 6%, respectively – are the numerator and denominator for the Beta formula. Five divided by six yields a value of 0.83, and that is the Beta for this hypothetical security. On average, we’d expect an asset with this Beta value to be 83% as volatile as the benchmark.

Thinking about it another way, this asset should be about 17% less volatile than the benchmark while still having its expected returns correlated in the same direction.

Beta & The Capital Asset Pricing Model (CAPM)

The Capital Asset Pricing Model, or CAPM, is a common investing formula that utilizes the Beta calculation to account for the time value of money as well as the risk-adjusted returns expected for a particular asset.

Beta is an essential component of the CAPM because without it, riskier securities would appear more favorable to prospective investors. Their risk wouldn’t be accounted for in the calculation.

The CAPM formula is as follows:

CAPM FormulaCAPM Formula

The variables are defined as:

  • ERi = Expected return of investment
  • Rf = Risk-free rate
  • βi = Beta of the investment
  • ERm = Expected return of market

The risk-free rate is the same as in the Beta formula, while the Beta that you’ve already calculated is simply placed into the CAPM formula. The expected return of the market (or benchmark) is placed into the parentheses with the market risk premium, which is also from the Beta formula. This is the expected benchmark’s return minus the risk-free rate.

To continue our example, here is how the CAPM actually works:

ER = 2% + 0.83(8% – 2%)

In this case, our security has an expected return of 6.98% against an expected benchmark return of 8%. That may be okay depending upon the investor’s goals as the security in question should experience less volatility than the market thanks to its Beta of less than 1. While the CAPM certainly isn’t perfect, it is relatively easy to calculate and gives investors a means of comparison between two investment alternatives.

Now, we’ll take a look at five stocks that not only offer investors low Beta scores, but attractive prospective returns as well.

Analysis On The Top 5 Low Beta Stocks

The following 5 low beta stocks have the lowest (but positive) Beta values, in ascending order from lowest to highest. They also pay dividends to shareholders. We focused on Betas above 0, as we are still looking for stocks that are positively correlated with the broader market:

5. Consolidated Edison (ED)

Consolidated Edison is a large-cap utility stock. The company generates nearly $15 billion in annual revenue and has a market capitalization of approximately $36 billion.

The company serves 3.7 million electric customers, and another 1.1 million gas customers, in New York.

Source: Investor Presentation

It operates electric, gas, and steam transmission businesses, with a steam system that is the largest in the U.S.

On February 20th, 2025, Consolidated Edison announced fourth quarter and full year results for the period ending December 31st, 2024. For the quarter, revenue grew 6.5% to $3.7 billion, which beat estimates by $36 million.

Adjusted earnings of $340 million, or $0.98 per share, compared to adjusted earnings of $346 million, or $1.00 per share, in the previous year. Adjusted earnings-per-share were $0.02 ahead of expectations.

For the year, revenue increased 4.0% to $15.3 billion while adjusted earnings of $1.87 billion, or $5.40 per share, compared to adjusted earnings of $1.76 billion, or $5.07 per share, in 2023.

Average rate base balances are now projected to grow by 8.2% annually through 2029 based off 2025 levels. This is up from the company’s prior forecast of 6.4%.

Click here to download our most recent Sure Analysis report on Consolidated Edison (preview of page 1 of 3 shown below):

4. The Hershey Company (HSY)

The Hershey Company, founded in 1894, is a chocolate and sugar confectionary products manufacturer that sells major brands such as Hershey’s, Reese’s, Kisses, Cadbury, Ice Breakers, Kit Kat, Almond Joy, Jolly Rancher, Twizzlers, Heath, and Milk Duds. Hershey primarily operates in North America but has international operations as well.

On February 6th, 2025, Hershey reported financial results for the fourth quarter of fiscal 2024. The North America Confectionary segment (81% of sales) grew its sales 6% over the prior year’s quarter.

Earnings-per-share grew 33%, from $2.02 to $2.69, beating the analysts’ consensus by $0.31, primarily thanks to an effective hedging strategy, which offset the effect of exceptionally high cocoa prices.

Hershey’s earnings-per-share growth stems from several factors. The first one is organic revenue growth, which Hershey has managed to achieve despite the public becoming more conscious about healthy eating habits. The company has also been able to improve its margins throughout the last decade.

Hershey owns well-recognized brands, so price hikes have not been a headwind to increasing the volume of its products. Hershey had also been moderately repurchasing its shares, which has added some additional growth to the company’s earnings-per-share.

HSY has a Beta score of 0.28.

Click here to download our most recent Sure Analysis report on HSY (preview of page 1 of 3 shown below):

3. Northrop Grumman (NOC)

Northrop Grumman Corporation is one of the five largest US aerospace and defense contractors based on revenue.

The company reports four business segments: Aeronautics Systems (aircraft and UAVs), Mission Systems (radars, sensors and systems for surveillance and targeting), Defense Systems (sustainment and modernization, directed energy, tactical weapons), and Space Systems (missile defense, space systems, hypersonics and space launchers).

Northrop Grumman makes the B-2 Spirit, E-2D, E-8C, RQ-4 Global Hawk, MQ-4C Triton, MQ-8B/C Fire Scout, B-21. The company also provides content on the F-35 and F/A-18. It won the contract for the GPI. The company had revenue of over $41.0B in 2024.

Northrop Grumman reported results for Q4 FY 2024 on January 30th, 2025. Companywide revenue was flat and diluted earnings per share rose to $8.66 from a loss of $3.54 on a year-over-year basis. Revenue for Aeronautics Systems rose 11% due to higher volumes in B-21, F-35 programs, and restricted programs.

The total backlog is a record ~$91.5B at the end of the quarter of which $39.7B is funded. The firm won $17.3B in contract awards in the quarter including large ones for restricted programs, TACAMO, F-35, and the Next-Gen OPIR. The company guided for $42.0B to $42.5B in sales and $27.85 to $28.25 earnings per share in 2025.

NOC has a Beta score of 0.21.

Click here to download our most recent Sure Analysis report on NOC (preview of page 1 of 3 shown below):

2. Campbell Soup (CPB)

Campbell Soup Company is a multinational food company headquartered in Camden, N.J. The company manufactures and markets branded convenience food products, such as soups, simple meals, beverages, snacks, and packaged fresh foods.

The company’s portfolio focuses on two specific businesses: Campbell Snacks, and Campbell Meals and Beverages. Campbell generated annual sales of $9.6 billion in fiscal 2024.

On March 12, 2024, Campbell closed on its acquisition of Sovos Brands (SOVO) for $23 per share in cash, which represented a total enterprise value of $2.7 billion, and was funded by issuing new debt. Sovos is a leader in high growth premium Italian sauces, and owns the market-leading Rao’s brand.

Campbell Soup reported second quarter FY 2025 results on March 5th, 2025. Net sales for the quarter improved by 9% year-over-year to $2.7 billion. This increase was mostly a result of the Sovos Brands acquisition. Adjusted EPS was 8% lower year-over-year at $0.74 for the quarter, which beat expectations by two cents.

The company repurchased $56 million worth of shares in H1. There remains $301 million remaining under the current $500 million share repurchase program, which is in addition to the existing $205 million remaining on its anti-dilutive share repurchase program.

Leadership updated its full-year fiscal 2025 guidance. Management now estimates that in fiscal 2025, Campbell’s adjusted earnings per share will be down 1% to 4%.

CPB has a Beta score of 0.19.

Click here to download our most recent Sure Analysis report on CPB (preview of page 1 of 3 shown below):

1. General Mills (GIS)

General Mills is a packaged food giant, with more than 100 brands and operations in more than 100 countries. It has returned to growth in the last five years, mostly thanks to the acquisition of Blue Buffalo and the pandemic, which greatly increased food consumption at home.

In mid-March, General Mills reported (3/19/25) results for Q3-2025. Net sales and organic sales fell -5% each over the prior year’s quarter, primarily due to retailer inventory reductions. It was the second-worst decline in the last five years.

Gross margin expanded from 33.5% to 33.9%, as cost savings offset input inflation. Adjusted earnings-per-share decreased -15%, from $1.18 to $1.00, but exceeded the analysts’ consensus by $0.04.

General Mills has grown its earnings-per-share at a 5.2% average annual rate in the last decade. We expect approximately 5.0% annual earnings-per-share growth over the next five years, mostly thanks to Blue Buffalo.

Earnings-per-share will also benefit from a decent amount of share repurchases, as the proceeds from the sale of North American yogurt business will be allocated on share repurchases.

GIS has a Beta score of 0.15.

Click here to download our most recent Sure Analysis report on GIS (preview of page 1 of 3 shown below):

Final Thoughts

Investors must take risk into account when selecting from prospective investments. After all, if two securities are otherwise similar in terms of expected returns but one offers a much lower Beta, the investor would do well to select the low Beta security as they may offer better risk-adjusted returns.

Using Beta can help investors determine which securities will produce more volatility than the broader market and which ones may help diversify a portfolio, such as the ones listed here.

The five stocks we’ve looked at not only offer low Beta scores, but they also offer attractive dividend yields. Sifting through the immense number of stocks available for purchase to investors using criteria like these can help investors find the best stocks to suit their needs.

At Sure Dividend, we often advocate for investing in companies with a high probability of increasing their dividends each and every year.

If that strategy appeals to you, it may be useful to browse through the following databases of dividend growth stocks:

Thanks for reading this article. Please send any feedback, corrections, or questions to [email protected].


Source link

Top 3 Dividend Champions Among The Worst Performers In 2025


Published on March 27th, 2025 by Bob Ciura

The S&P 500 Index is off to a challenged start to the year. So far in 2025, the S&P 500 Index has declined 3%.

Many dividend stocks are off to much worse starts year-to-date, which could present value and income investors with some compelling buying opportunities.

To begin the search for quality dividend growth stocks, we recommend the Dividend Champions, a group of stocks that have increased their dividends for at least 25 consecutive years.

You can download your free copy of the Dividend Champions list, along with relevant financial metrics like price-to-earnings ratios, dividend yields, and payout ratios, by clicking on the link below:


Investors are likely familiar with the Dividend Aristocrats, a group of 69 stocks in the S&P 500 Index with 25+ consecutive years of dividend increases.

Meanwhile, investors should also familiarize themselves with the Dividend Champions, which have also raised their dividends for at least 25 years in a row.

This article will discuss the 3 worst-performing Dividend Champions so far in 2025, along with their expected returns over the next five years.

Table of Contents

You can instantly jump to any specific section of the article by clicking on the links below:

The 3 Dividend Champions have been ranked by expected total annual return over the next five years, from lowest to highest.


Beaten Down Dividend Champion #3: Matthews International Corp. (MATW)

  • Year-to-Date Performance: -15.6%
  • 5-year expected returns: 12.2%

Matthews International Corporation provides brand solutions, memorialization products and industrial technologies on a global scale. The company’s three business segments are diversified.

The SGK Brand Solutions provides brand development services, printing equipment, creative design services, and embossing tools to the consumer-packaged goods and packaging industries.

The Memorialization segment sells memorialization products, caskets, and cremation equipment to funeral home industries.

The Industrial technologies segment is smaller than the other two businesses and designs, manufactures and distributes marking, coding and industrial automation technologies and solutions.

Matthews International reported first quarter FY 2025 results on February 6th, 2025. The company reported sales of $402 million, an 11% decline compared to the same prior year period. The decrease was the result of a 28% sales decline in its Industrial Technologies segment.

Adjusted earnings were $0.14 per share, a 62% decrease from $0.37 a year ago. The company’s net debt leverage ratio rose from 3.6 one year ago to 3.9.

Matthews continues to expect $205 million to $215 million of adjusted EBITDA for fiscal 2025.

The dividend payout ratio for Matthews International has been very conservative and only recently eclipsed one third of earnings. This conservative payout ratio allows Matthews to continue raising the dividend as it has for the last 31 years.

The company has a small competitive advantage in that it is uniquely diversified across its businesses, which allows it to weather different storms on a consolidated basis.

Click here to download our most recent Sure Analysis report on MATW (preview of page 1 of 3 shown below):


Beaten Down Dividend Champion #2: T. Rowe Price Group (TROW)

  • Year-to-Date Performance: -16.0%
  • 5-year expected returns: 13.6%

T. Rowe Price Group, founded in 1937 and headquartered in Baltimore, MD, is one of the largest publicly traded asset managers.

The company provides a broad array of mutual funds, sub-advisory services, and separate account management for individual and institutional investors, retirement plans and financial intermediaries.

Source: Investor Presentation

Assets under management grow in two basic ways: increased contributions and higher underlying asset values. While asset values are finicky, the trend is upward over the long term.

In addition, T. Rowe has another growth lever in the form of share repurchases. The company has shrunk its share count by an annual rate of 1.3% over the last decade.

On February 5th, 2025, T. Rowe Price announced fourth quarter and full year results for the period December 31st, 2024.

For the quarter, revenue increased 11% to $1.82 billion, though this was $50 million less than expected. Adjusted earnings-per-share of $2.12 compared favorably to $1.72 in the prior year, but missed estimates by $0.08.

For the year, revenue grew 9.8% to $7.1 billion while adjusted earnings-per-share of $9.33 compared to $7.59 in 2023.

During the quarter, AUMs of $1.639 billion were up 19.2% year-over-year and 3.1% sequentially. Market appreciation of $205.3 billion was partially offset by $43.2 billion of net client outflows.

Operating expenses of $1.26 billion increased 0.1% year-over-year and 6.4% quarter-over-quarter.

Click here to download our most recent Sure Analysis report on TROW (preview of page 1 of 3 shown below):


Beaten Down Dividend Champion #1: Target Corporation (TGT)

  • Year-to-Date Performance: -20.9%
  • 5-year expected returns: 13.6%

Target was founded in 1902 and now operates about 1,850 big box stores, which offer general merchandise and food, as well as serving as distribution points for the company’s e-commerce business.

Target posted fourth quarter and full-year earnings on March 4th, 2025, and results were better than expected on both the top and bottom lines, albeit on reduced estimates. Adjusted earnings-per-share came to $2.41, which was 16 cents ahead of estimates.

Revenue was off 3.1% year-over-year to $30.92 billion, but did beat estimates by $90 million. Comparable sales in the fourth quarter rose 1.5% year-over-year due to strong traffic and digital channel performance.

Management noted apparel and hardline categories saw particular strength.

Source: Investor Presentation

For 2025, Target expects around 1% sales growth and a modest increase in operating margins. However, factors like tariff uncertainties and shifting consumer confidence may pressure short-term profits.

The company remains focused on digital expansion, supply chain improvements, and shareholder returns, including dividend increases and stock buybacks, with $8.7 billion still available under its repurchase program.

Digital comparable sales continue to drive the top line, adding 8.7% in Q4. Same-day delivery grew by more than 25% from the year-ago period.

The company repurchased $506 million worth of shares in Q4, and had $8.7 billion left on its authorization as of year end. The company guided for $8.80 to $9.80 in adjusted earnings-per-share for this year.

Click here to download our most recent Sure Analysis report on TGT (preview of page 1 of 3 shown below):

Table of Contents

The Dividend Champions list is not the only way to quickly screen for stocks that regularly pay rising dividends.

Thanks for reading this article. Please send any feedback, corrections, or questions to [email protected].


Source link

These Car Stocks Could Feel the Most Pain Under Trump’s Auto Tariffs


Key Takeaways

  • President Donald Trump on Wednesday announced a 25% tariff on imported cars and, eventually, auto parts, a move that analysts expect to significantly raise costs for manufacturers and consumers.
  • U.S. giants General Motors and Ford are better off under the new tariff plan than they were when Trump’s threats were just directed at Canada and Mexico, but the tariffs are still expected to cost them billions.
  • EV makers like Tesla and Rivian have the least exposure to Trump’s tariffs, and the extent of parts suppliers’ exposure is highly uncertain.

Shares of U.S. and international automakers tumbled on Thursday after President Trump declared a 25% tariff on imported vehicles and, eventually, auto parts. 

Economists and analysts expect the tariffs to dramatically increase costs for both U.S. manufacturers, whose supply chains snake across North America, and consumers.

JPMorgan analysts had estimated Trump’s proposed tariffs on Canadian and Mexican vehicle imports would cost the industry about $41 billion a year if automakers absorbed all of the costs. After Wednesday’s announcement, which applies tariffs to all countries, they doubled their estimate to $82 billion. If manufacturers pass the entire cost of the tariffs along to consumers, JPMorgan estimates car prices will increase by nearly 12%. 

The tariffs announced on Wednesday, the analysts said, were a slight reprieve for U.S. automakers like Ford (F) and General Motors (GM). If tariffs were confined to just Canada and Mexico, their reliance on factories in those countries would have put them at a disadvantage against international manufacturers. But with tariffs applied globally, domestic companies are in a better position to raise prices without losing market share, the analysts said. 

That said, GM is still the most exposed of the car manufacturers that JPMorgan follows. It sources an estimated 40% of its vehicles from Canada and Mexico, and imports from South Korea. Ford, meanwhile, sources just 7% of its cars from America’s neighbors and has no exposure to South Korea. Analysts estimate GM’s “tariff bill” will eventually total $13 billion, while Ford’s could reach $4.5 billion.

International carmakers are now at a significant disadvantage. Ferrari (RACE), for example, manufactures all of its cars in Italy, but sells about 40% of them in America, which JPMorgan points out is also its higher-margin market. International automakers could mitigate costs by increasing their U.S. manufacturing, as South Korea’s Hyundai announced it would earlier this week.

JPMorgan on Thursday lowered its price targets on GM, Ford, and Ferrari stocks by 17%, 15%, and 12%, respectively.

EV Upstarts Are Least Exposed

Electric vehicle makers Tesla (TSLA), Rivian (RIVN), and Lucid (LCID) are among the carmakers least exposed to Trump’s tariffs. All the vehicles they sell in the U.S. are assembled domestically, according to Bank of America Securities analysts. 

Although, like GM and Ford, they do source parts and subcomponents from Canada and Mexico, a fact that Tesla CEO and Trump advisor Elon Musk pointed out on X, the social media platform he owns, on Wednesday. 

“To be clear, this will affect the price of parts in Tesla cars that come from other countries. The cost impact is not trivial,” Musk said in response to a post claiming Tesla “could benefit the most” from Trump’s tariffs.

Impact To Parts Suppliers Is Highly Uncertain

Trump’s executive order states that “certain automobile parts,” defined as “engines, transmissions, powertrain parts, and electrical components,” will be subject to tariffs no later than May 3. However, there remains plenty of ambiguity about what exactly falls into those categories, and how suppliers and manufacturers will distribute the tariff burden. 

JPMorgan analysts say suppliers are better positioned than carmakers but remain exposed. Even if they can negotiate deals that shift their tariff burden to manufacturers, they still will suffer from less demand from consumers who are priced out of the market for new vehicles.

Exactly which suppliers will be hit the hardest is difficult to predict with the details currently available, but JPMorgan analysts believe Aptiv (APTV) is the worst-positioned and Gentex (GNTX) the best. 

Suppliers, the analysts note, could offset their tariff costs by doing the opposite of what Trump wants: moving production to less expensive countries, rather than the U.S. Lear (LEA), for example, already has relocated some production from Mexico to Honduras, and that trend could accelerate under the new tariffs. 


Source link

Steelcase Stock Surges as Furniture Orders Grow


Key Takeaways

  • Steelcase reported better-than-anticipated quarterly profit and sales as orders for its furniture increased.
  • Orders were up 9% year-over-year on strong gains in the Americas market, boosted by sales to large companies and government.
  • Steelcase predicted current-quarter adjusted earnings above the midpoint of analysts’ estimates.

Steelcase (SCS) shares soared Thursday, a day after the furniture supplier’s results exceeded forecasts and it gave strong guidance as orders increased.

The maker of ergonomic office chairs and storage systems reported fourth-quarter fiscal 2025 adjusted earnings per share (EPS) of $0.26 on revenue that rose about 2% year-over-year to $788.0 million. Analysts surveyed by Visible Alpha were looking for $0.22 and $785.5 million, respectively.

Orders grew 9%, boosted by a 12% jump in the Americas market. Sales in the Americas were up nearly 5% to $608.1 million, although they fell 7% to $179.9 million internationally. 

CEO Says Well-Positioned as Organizations Require Employees Return to Office

CEO Sara Armbruster called the growth in orders in the Americas “broad-based, driven by most of our customer segments, with especially strong growth from our large corporate and government customers.” Armbruster added that the company will benefit from more organizations requiring employees to return to the office as they drop their work-from-home options.

Steelcase sees current-quarter adjusted EPS in the range of $0.13 to $0.17, while the Visible Alpha outlook was for $0.14. 

Despite today’s 5% advance, shares of Steelcase remain about 15% lower over the past year.

TradingView


Source link

Petco Stock Climbs as Retailer Forecasts Rising Adjusted Profits


Key Takeaways

  • Petco shares rose Thursday as the retailer projected better-than-expected adjusted earnings for fiscal 2025.
  • Sales are expected to fall in 2025, but an adjusted profit metric is forecast to rise more than analysts had expected.
  • CEO Joel Anderson said on Wednesday’s earnings call that Petco’s “foundational practices were not those of a successful consumer business and needed overhauling.”

Petco (WOOF) shares jumped Thursday morning as the pet retailer outlined a better-than-expected adjusted earnings forecast for fiscal 2025.

For the full year, Petco expects sales to decline by low single digits, while adjusted earnings before interest, taxes, depreciation, and amortization (EBITDA) are expected to rise to a range of $375 million to $390 million, compared to $336.5 million in 2024. Analysts expected the metric to come in at $371.56 million, according to estimates compiled by Visible Alpha.

Petco’s Business ‘Needed Overhauling,’ CEO Says

The retailer is planning to boost profits by cutting costs and operating more efficiently. CEO Joel Anderson said in Wednesday’s earnings call that when he took over last summer, Petco’s “foundational practices were not those of a successful consumer business and needed overhauling,” according to a transcript from AlphaSense.

The average Petco customer “remains discerning,” Anderson said, noting that the chain is reviewing its product portfolio, and plans to dedicate more shelf space to faster-selling brands. The retailer is also looking to improve its margins by “executing more targeted promotions,” Anderson said.

The retailer reported $1.55 billion in sales for the fourth quarter that ended Feb. 1, narrowly below estimates, while comparable store sales grew by 0.5%, below the 0.83% analyst consensus. Petco recorded a net loss of $0.05 per share, 2 cents larger than what analysts had expected.

Petco’s results follow online pet retail rival Chewy (CHWY), which topped estimates in its own fourth-quarter results earlier Wednesday.

Petco shares were up around 5% Thursday morning. They entered the day down just over 35% since the start of 2025.


Source link

You Can’t Control Mortgage Rates. But These 4 Moves Can Help You Get the Best Deal Out There.


Key Takeaways

  • Rates on new 30-year mortgages have moved between 6% and 8% for almost all of the last two-and-a-half-years.
  • It’s unclear when—or even if—mortgage rates will fall significantly from these levels in the foreseeable future.
  • But wherever mortgage rates stand, you can reduce the rate you personally pay by improving your credit score, paying down debt, saving more for a down payment, and shopping around.

The full article continues below these offers from our partners.

Try These Smart Strategies to Combat Today’s Elevated Mortgage Rates

Almost continuously since September 2022, the national average rate for a 30-year new purchase mortgage has wavered in a range between 6% and 8%. It did slip into upper-5% territory on a handful of days in the last two-and-a-half years, while it reached as high as 8.01% in October 2023.

That’s a dramatic departure from 2021, when 30-year rates averaged below 3% for most of the second half of the year.

Unfortunately, a return to significantly lower rates appears very unlikely in the current economic environment. In fact, Wells Fargo recently forecasted that mortgage rates will remain above 6% through 2026.

While that’s not stellar news if you want to buy a new home, you aren’t powerless. In fact, four key moves can help you get the best rate available—all of which are smart since reducing your rate by a half or even a quarter point can translate into lower monthly payments and, over time, significantly reduced total interest costs.

Smart Strategy #1: Improve Your Credit Score

Mortgage rates are not “one size fits all.” What a given lender offers you is a function of how much you’re borrowing, your income, your assets, and, to a large extent, what kind of credit risk you represent. Buyers with a higher credit score will be offered more favorable mortgage rates, while those with a low credit score will be asked to pay a higher rate.

“Your credit score is one way of measuring how likely you are to pay your bills,” said Samir Patel, senior vice president of loans at Discover. “The higher your credit score, the better your chances of approval at a favorable interest rate for many types of loans—from personal loans to primary mortgages, home equity loans, and mortgage refinances.”

Sometimes it’s possible to boost your credit score by a modest margin very quickly, while larger improvements may take more time. Since any mortgage rate you lock in is a long-term rate, it can be worth delaying your home buying until you’ve made some strategic credit score-enhancing moves.

Whatever your timeline, the top ways to boost your score before presenting a mortgage application to lenders are building up a longer track record of on-time payments, paying off or reducing one or more debts to lower your credit utilization percentage, and not applying for any new loans or credit cards while you are house hunting.

“I always encourage consumers to check their credit report before applying for a home loan,” Patel said. “By double checking for any errors and fixing them, consumers can help put themselves in a position for the best interest rate on a home loan.”

Tip

In the past, you could only request a free copy of your credit report from each credit reporting agency once per year. But that has changed, allowing consumers to get a free copy as frequently as once per week. That reduces how long you have to wait to pull another report if you are watching for changes.

Smart Strategy #2: Pay Down Debt

Reducing what you owe on any loans or credit cards can help increase your credit score, as discussed above. But in terms of applying for a mortgage, it can do double duty. The reason is that mortgage lenders base their offers on something called a debt-to-income ratio (DTI). The DTI calculates your total debts as a proportion of your monthly income, where a higher proportion of debt classifies you as a riskier applicant, while someone with a lower DTI will be deemed a safer bet among lenders.

If you’re like most house hunters, you can’t substantially change your income in a short time frame before applying for a mortgage. But by lowering your debt, your DTI ratio will go down—making your mortgage application less risky for lenders and typically translating into a better mortgage rate for you.

Smart Strategy #3: Save for a Bigger Down Payment

Though it may be appealing to get into a new house as soon as possible, or utilize a “low down payment” program, there are good reasons to pause your purchase until you can save more money to put down.

First and foremost, a bigger down payment means you’ll be asking for a lower loan amount—which in turn will lower the monthly payment on your new loan. A smaller loan can also help improve your DTI ratio, discussed above, which may help you score a better rate from your lender.

If you already have a sizable pot of savings for a home and are within reach of a 20% down payment, you may want to save a little longer so that you can avoid the extra monthly cost of private mortgage insurance (PMI). If you currently only have, say, a 5% down payment saved, then avoiding PMI is not likely possible unless you defer your house hunt for an extended period. But if you find you have 15% or more saved, it could be worth waiting until you can reach the PMI-avoiding 20% mark.

A third way that saving more can help you snag a better mortgage rate is that it makes it possible for you to consider buying mortgage discount points. Points work by requiring an upfront payment in exchange for lowering your long-term mortgage rate. If you have ample funds saved before applying for a mortgage, you may have enough cash on hand to entertain various discount point options.

Smart Strategy #4: Shop Around on Rates

The above strategies are smart to do first, so we’re listing this one last, but it’s very important: The recommendation to shop around on rates cannot be overstated. When you’re ready to submit a mortgage application, it’s critical you do some homework to make sure you get a good rate.

While checking local banks and credit unions is always smart, it shouldn’t be your only foray. Also consider online lenders or big institutions that don’t have a physical footprint in your own community. You can also consider a mortgage broker, which can help you with the paperwork and link you to one of a variety of lenders in their network.

Choosing your timing to lock in a rate is also important, and we make it easy to follow mortgage rate trends—nationally and by state—with our daily mortgage rate coverage linked below.

How We Track the Best Mortgage Rates

The national and state averages cited above are provided as is via the Zillow Mortgage API, assuming a loan-to-value (LTV) ratio of 80% (i.e., a down payment of at least 20%) and an applicant credit score in the 680–739 range. The resulting rates represent what borrowers should expect when receiving quotes from lenders based on their qualifications, which may vary from advertised teaser rates. © Zillow, Inc., 2025. Use is subject to the Zillow Terms of Use.


Source link

Watch These Key Nvidia Stock Price Levels as Selling in AI Favorite Accelerates


Key Takeaways

  • Nvidia shares will remain in focus after falling sharply Wednesday amid concerns that stricter enforcement of new energy rules in China could weigh on the AI chipmaker’s sales.
  • The price broke down below a pennant pattern in Wednesday’s trading session on the highest volume in more than a week, indicating a continuation of the stock’s current move lower.
  • Investors should watch crucial support levels on Nvidia chart around $105 and $96, while also monitoring key resistance levels near $130 and $150.

Nvidia (NVDA) shares will remain in focus after falling sharply Wednesday amid concerns that stricter enforcement of new energy rules in China could weigh on the AI chipmaker’s sales.

According to a Financial Times report, authorities are advising Chinese groups to use chips that meet stricter requirements in new data centers and when expanding existing facilities, potentially threating the sales of Nvidia’s less powerful H20 chip, which the company tailors to comply with U.S. export restrictions.

Through Wednesday’s close, Nvidia shares have lost about a quarter of their value since hitting their record high in January, pressured by concerns over AI spending, moderating sales growth and uncertainty over the Trump administration’s trade policies. The stock fell nearly 6% on Wednesday to finish the session at $113.76.

Below, we take a closer look at Nvidia’s chart and use technical analysis to identify key price levels worth watching out for.

Pennant Pattern Breakdown

Since setting their record high in early January, Nvidia shares have trended lower within a descending channel.

The price broke down below a pennant pattern in Wednesday’s trading session on the highest volume in more than a week, indicating a continuation of the stock’s current move lower.

It’s also worth pointing out that the 50-day moving average (MA) recently crossed below the 200-day MA to form an ominous death cross, a chart pattern that forecasts the start of a new downtrend. Moreover, the relative strength index (RSI) has moved back below the 50 threshold to signal weakening price momentum.

Let’s identify crucial support and resistance levels on Nvidia’s chart that investors may be eyeing.

Crucial Support Levels to Eye

Firstly, it’s worth keeping track of the $105 level if the shares continue to move lower. Buyers could look for entry points in this area near the March low, which also closely aligns with a range of similar prices on the chart stretching back to May last year.

Further selling could see the shares revisit lower support around $96. This region on the chart may garner support near last year’s twin March peaks, which roughly sit at the same level as the early-August sell-off low. Interestingly, this area also lies in the same vicinity as a projected bars pattern target that takes the stock’s recent impulsive move lower and repositions it from today’s pennant pattern breakdown.

Key Resistance Levels Worth Monitoring

Amid a recovery effort in the stock, investors should monitor how the price responds to the $130 level. The shares may run into overhead resistance in this area near a trendline situated just above the two moving averages that links multiple peaks and troughs on the chart extending back to the August swing high.

Finally, a decisive close above this level could drive a rally to around $150. Investors who have bought Nvidia shares at lower levels may seek profit-taking opportunities near several peaks that formed on the chart just below the stock’s record high.

The comments, opinions, and analyses expressed on Investopedia are for informational purposes only. Read our warranty and liability disclaimer for more info.

As of the date this article was written, the author does not own any of the above securities.


Source link

3 Red Flag Dividend Aristocrats Most Likely To Cut Their Dividends


Updated on March 26th, 2025 by Bob Ciura
Spreadsheet data updated daily

The Dividend Aristocrats are a select group of 69 S&P 500 stocks with 25+ years of consecutive dividend increases.

The requirements to be a Dividend Aristocrat are:

  • Be in the S&P 500
  • Have 25+ consecutive years of dividend increases
  • Meet certain minimum size & liquidity requirements

There are currently 69 Dividend Aristocrats.

You can download an Excel spreadsheet of all 69 Dividend Aristocrats (with metrics that matter such as dividend yields and price-to-earnings ratios) by clicking the link below:


Disclaimer: Sure Dividend is not affiliated with S&P Global in any way. S&P Global owns and maintains The Dividend Aristocrats Index. The information in this article and downloadable spreadsheet is based on Sure Dividend’s own review, summary, and analysis of the S&P 500 Dividend Aristocrats ETF (NOBL) and other sources, and is meant to help individual investors better understand this ETF and the index upon which it is based. None of the information in this article or spreadsheet is official data from S&P Global. Consult S&P Global for official information.

However, even Dividend Aristocrats can fall from grace. For example, Walgreens Boots Alliance (WBA) was removed from the Dividend Aristocrats list in 2024.

The company slashed its dividend due to a pronounced business downturn in the brick-and-mortar pharmacy retail industry, amid elevated competitive threats from online pharmacies.

This was after Walgreens Boots Alliance had maintained a 40+ year streak of consecutive dividend increases.

While dividend cuts from Dividend Aristocrats are unexpected, they have happened–and could happen again. To be clear, the following 3 Dividend Aristocrats are not currently in jeopardy of cutting their dividends.

Their dividend payouts are supported with sufficient underlying earnings (for now). If their earnings remain stable or continue to grow, they have at least a decent change of continuing their dividend growth.

But, the 3 Dividend Aristocrats below are facing fundamental challenges to varying degrees, which potentially threatens their dividend payouts.

This article will provide a detailed analysis on the three Dividend Aristocrats most in danger of a future dividend cut.

Table of Contents

Red Flag Dividend Aristocrat For 2025: Albemarle Corporation (ALB)

  • Dividend Risk Score: B
  • Dividend Yield: 2.1%

Albemarle is the largest producer of lithium and second largest producer of bromine in the world. The two products account for nearly two-thirds of annual sales. Albemarle produces lithium from its salt brine deposits in the U.S. and Chile.

The company has two joint ventures in Australia that also produce lithium. Albemarle’s Chile assets offer a very low-cost source of lithium. The company operates in nearly 100 countries.

Albemarle, like any commodity producer, is beholden to the underlying commodity price for growth and profitability. Unfortunately, the steep drop in lithium prices has caused a massive decline in Albemarle’s financial performance in recent quarters.

On February 12th, 2025, Albemarle announced fourth quarter and full year results. For the quarter, revenue fell 48% to $1.23 billion and was $110 million less than expected.

Source: Investor Presentation

Adjusted earnings-per-share of -$1.09 compared very unfavorably to $1.85 in the prior year and was $0.42 below estimates.

For the year, revenue declined 44% to $5.4 billion while adjusted earnings-per-share was -$2.34.

Results were impacted by asset write-offs and weaker average prices for lithium. For the quarter, revenue for Energy Storage was down 63.2% to $616.8 million.

This segment was impact by weaker volumes (-10%) and lower prices (-53%). Revenues for Specialties were lower by 2.0% to $332.9 million as volume (+3%) was offset by a decrease in pricing (-5%).

Results are not expected to meaningfully improve in 2025. Albemarle expects 2025 full-year revenue in a range of $4.9 billion to $5.2 billion. The company is expected to produce earnings-per-share of -$0.80 in 2025.

Continued declines in sales, along with net losses, could threaten Albemarle’s dividend payout. This is especially true if lithium prices continue to drop.

Click here to download our most recent Sure Analysis report on ALB (preview of page 1 of 3 shown below):

Red Flag Dividend Aristocrat For 2025: Amcor plc (AMCR)

  • Dividend Risk Score: F
  • Dividend Yield: 5.0%

Amcor plc is one of the world’s most prominent designers and manufacturers of packaging for food, pharmaceutical, medical, and other consumer products. The company emphasizes making responsible packaging that is lightweight, recyclable, and reusable.

Today, the Amcor plc, which trades on the NYSE, was formed in June 2019 with the merger between two packaging companies, U.S-based Bemis Co. Inc. and Australia-based Amcor Ltd. Amcor plc’s current headquarters is in Bristol, U.K.

The current dividend yield is attractive compared to the broader market, but the payout ratio is high at nearly 70% expected for 2025.

As a packaging manufacturer, Amcor is particularly exposed to the global economy. It would be difficult for the company to maintain its dividend in a steep recession as a result. AMCR stock receives our lowest Dividend Risk Score of ‘F’.

Click here to download our most recent Sure Analysis report on AMCR (preview of page 1 of 3 shown below):

Red Flag Dividend Aristocrat For 2025: Franklin Resources (BEN)

  • Dividend Risk Score: C
  • Dividend Yield: 6.1%

Franklin Resources is an investment management company. It was founded in 1947. Today, Franklin Resources manages the Franklin and Templeton families of mutual funds.

On January 31st, 2025, Franklin Resources reported net income of $163.6 million, or $0.29 per diluted share, for the first fiscal quarter ending December 31, 2024.

This marked a significant improvement from the previous quarter’s net loss of $84.7 million, though EPS remained lower than the $251.3 million net income recorded in the same quarter last year.

Source: Investor presentation

The past few years have been difficult for Franklin Resources. Franklin Resources was slow to adapt to the changing environment in the asset management industry.

The explosive growth in exchange-traded funds and indexing investing surprised traditional mutual funds.

ETFs have become very popular with investors due in large part to their lower fees than traditional mutual funds. In response, the asset management industry has had to cut fees and commissions or risk losing client assets.

Earnings-per-share are expected to decline in 2025 as a result. The company still maintains a manageable payout ratio of 51% expected for 2025, but if EPS continues to decline, the dividend payout could be in danger down the road.

Click here to download our most recent Sure Analysis report on BEN (preview of page 1 of 3 shown below):

Final Thoughts

The Dividend Aristocrats are among the best dividend growth stocks in the market.

And while most Dividend Aristocrats will continue to raise their dividends each year, there could be some that end up cutting their payouts.

While it is rare, investors have seen multiple Dividend Aristocrats cut their dividends over the past several years, including Walgreens Boots Alliance, 3M Company (MMM), V.F. Corp. (VFC), and AT&T Inc. (T).

While the three Dividend Aristocrats presented here have been successful raising their dividends each year to this point, they all face varying levels of challenges to their underlying businesses.

For this reason, income investors should view the 3 red flag Dividend Aristocrats in this article cautiously going forward.

Additional Reading

Additionally, the following Sure Dividend databases contain the most reliable dividend growers in our investment universe:

If you’re looking for stocks with unique dividend characteristics, consider the following Sure Dividend databases:

Thanks for reading this article. Please send any feedback, corrections, or questions to [email protected].


Source link

10 Best Dividend Stocks Trading Near 52-Week Lows


Published on March 26th, 2025 by Bob Ciura

The goal of rational investors is to maximize total return under a given set of constraints.

The three components of expected return are:

  • Earnings-per-share growth
  • Dividend payments
  • Expansion/contraction of the valuation multiple

At Sure Dividend, we believe high-quality dividend growth companies represent the best stocks to buy-and-hold for the long run.

This is why we recommend stocks that have established track records of paying dividends, and raising their dividends over time.

Blue-chip stocks are established, financially strong, and consistently profitable publicly traded companies.

Their strength makes them appealing investments for comparatively safe, reliable dividends and capital appreciation versus less established stocks.

This research report has the following resources to help you invest in blue chip stocks:


This list contains important metrics, including: dividend yields, payout ratios, dividend growth rates, 52-week highs and lows, betas, and more.

There are currently more than 500 securities in our blue chip stocks list.

Even better, investors can maximize their portfolio return by purchasing quality dividend stocks when they are undervalued.

This article discusses the 10 best dividend stocks in the Sure Analysis Research Database currently trading within 10% of their 52-week lows.

The list excludes REITs, MLPs, and BDCs. The stocks are arranged by annual expected returns, in ascending order.

Table of Contents

The table of contents below allows for easy navigation.

Beaten Down Dividend Stock #10: Nordson Corp. (NDSN)

  • Expected Total Return: 14.5%

Nordson was founded in 1954 in Amherst, Ohio by brothers Eric and Evan Nord, but the company can trace its roots back to 1909 with the U.S. Automatic Company.

Today the company has operations in over 35 countries and engineers, manufactures, and markets products used for dispensing adhesives, coatings, sealants, biomaterials, plastics, and other materials, with applications ranging from diapers and straws to cell phones and aerospace.

Source: Investor Presentation

On December 11th, 2024, Nordson reported fourth quarter results for the period ending October 31st, 2024. For the quarter, the company reported sales of $744 million, 4% higher compared to $719 million in Q4 2023, which was driven by a positive acquisition impact, and offset by organic decrease of 3%.

Industrial Precision saw sales decrease by 3%, while the Medical and Fluid Solutions and Advanced Technology Solutions segments had sales increases of 19% and 5%, respectively.

The company generated adjusted earnings per share of $2.78, a 3% increase compared to the same prior year period.

Click here to download our most recent Sure Analysis report on NDSN (preview of page 1 of 3 shown below):

Beaten Down Dividend Stock #9: Sysco Corp. (SYY)

  • Expected Total Return: 14.7%

Sysco Corporation is the largest wholesale food distributor in the United States. The company serves 600,000 locations with food delivery, including restaurants, hospitals, schools, hotels, and other facilities.

Source: Investor Presentation

On January 28th, 2025, Sysco reported second-quarter results for Fiscal Year (FY)2025. The company reported a 4.5% increase in sales for the second quarter of fiscal year 2025, reaching $20.2 billion.

U.S. Foodservice volume grew by 1.4%, while gross profit rose 3.9% to $3.7 billion. Operating income increased 1.7% to $712 million, with adjusted operating income growing 5.1% to $783 million. Earnings per share (EPS) remained at $0.82, while adjusted EPS grew 4.5% to $0.93.

The company reaffirmed its full-year guidance, projecting sales growth of 4%-5% and adjusted EPS growth of 6%-7%.

Click here to download our most recent Sure Analysis report on SYY (preview of page 1 of 3 shown below):

Beaten Down Dividend Stock #8: Archer Daniels Midland (ADM)

  • Expected Total Return: 14.9%

Archer-Daniels-Midland is the largest publicly traded farmland product company in the United States. Archer-Daniels-Midland’s businesses include processing cereal grains, oilseeds, and agricultural storage and transportation.

Archer-Daniels-Midland reported its third-quarter results for Fiscal Year (FY) 2024 on November 18th, 2024.

The company reported adjusted net earnings of $530 million and adjusted EPS of $1.09, both down from the prior year due to a $461 million non-cash charge related to its Wilmar equity investment.

Consolidated cash flows year-to-date reached $2.34 billion, reflecting strong operations despite market challenges.

Click here to download our most recent Sure Analysis report on ADM (preview of page 1 of 3 shown below):

Beaten Down Dividend Stock #7: Agilent Technologies (A)

  • Expected Total Return: 14.9%

Agilent Technologies, Inc. (A) offers instruments, software, and services to life sciences, diagnostics, and applied chemicals markets. It is a global company with operations in the Americas (which accounted for 40% of FY 2024 revenue), Asia Pacific (33%), and Europe (27%).

The company is separated into three segments: Life Sciences & Diagnostics Markets Group (LDG), Agilent CrossLab Group (ACG), and Applied Markets Group (AMG). ACG makes up nearly half of its total revenue (42%), with LDG (38%) and AMG (20%) making up the remainder.

Its end markets are primarily Chemicals and Advanced Materials, and Pharma, with Diagnostics and Clinical, Environmental & Forensics, Food, and Academia & Govt making up the remainder. Agilent has a market capitalization of $35 billion.

On February 26th, 2025, Agilent reported first quarter 2025 results for the period ending January 31st, 2024. For the quarter, the company generated net revenue of $1.68 billion, which was 1.4% higher year-over-year.

Adjusted net income equaled $377 million or $1.31 per share, a 2% increase compared to Q1 2024. The company’s LDG and ACG segments saw revenue increases of 4% and 1% year-over-year, respectively, while AMG declined 4%.

Click here to download our most recent Sure Analysis report on Agilent (preview of page 1 of 3 shown below):

Beaten Down Dividend Stock #6: PPG Industries (PPG)

  • Expected Total Return: 15.2%

PPG Industries is the world’s largest paints and coatings company. Its only competitors of similar size are Sherwin-Williams and Dutch paint company Akzo Nobel.

PPG Industries was founded in 1883 as a manufacturer and distributor of glass (its name stands for Pittsburgh Plate Glass) and today has approximately 3,500 technical employees located in more than 70 countries at 100 locations.

On January 31st, 2025, PPG Industries announced fourth quarter and full year results for the period ending December 31st, 2024. For the quarter, revenue declined 4.6% to $3.73 billion and missed estimates by $241 million.

Adjusted net income of $375 million, or $1.61 per share, compared favorably to adjusted net income of $372 million, or $1.56 per share, in the prior year. Adjusted earnings-per-share was $0.02 below expectations.

For the year, revenue from continuing operations decreased 2% to $15.8 billion while adjusted earnings-per-share totaled $7.87.

PPG Industries repurchased ~$750 million worth of shares during 2024 and has $2.8 billion, or ~10.3% of its current market capitalization, remaining on its share repurchase authorization. The company expects to repurchase ~$400 million worth of shares in Q1 2025.

For 2025, the company expects adjusted earnings-per-share in a range of $7.75 to $8.05.

Click here to download our most recent Sure Analysis report on PPG (preview of page 1 of 3 shown below):

Beaten Down Dividend Stock #5: United Parcel Service (UPS)

  • Expected Total Return: 15.3%

United Parcel Service is a logistics and package delivery company that offers services including transportation, distribution, ground freight, ocean freight, insurance, and financing.

Its operations are split into three segments: US Domestic Package, International Package, and Supply Chain & Freight.

On January 30th, 2025, UPS reported fourth quarter 2024 results for the period ending December 31st, 2024. For the quarter, the company generated revenue of $25.3 billion, a 1.5% year-over-year increase.

Source: Investor Presentation

The U.S. Domestic segment (making up 68% of sales) saw a 2.2% revenue increase, with International also posting a 6.9% revenue increase, while Supply Chain Solutions saw a 9.1% decrease. Adjusted net income equaled $2.75 per share, up 11.3% year-over-year.

The company announced it is reducing its largest customer’s volume by over 50% by H2 2026, insourced 100% of its UPS SurePost product, and is redesigning its end-to-end process to deliver $1 billion in savings.

Click here to download our most recent Sure Analysis report on UPS (preview of page 1 of 3 shown below):

Beaten Down Dividend Stock #4: Pfizer Inc. (PFE)

  • Expected Total Return: 15.9%

Pfizer Inc. is a global pharmaceutical company focusing on prescription drugs and vaccines. Pfizer formed the GSK Consumer Healthcare Joint Venture in 2019 with GlaxoSmithKline plc, which includes its over-the-counter business.

Pfizer owns 32% of the JV, but is exiting the company, now known as Haleon. Pfizer spun off its Upjohn segment and merged it with Mylan forming Viatris for its off patent, branded and generic medicines in 2020.

Pfizer’s top products are Eliquis, Ibrance, Prevnar family, Vyndaqel family, Abrysvo, Xeljanz, and Comirnaty.

Source: Investor Presentation

Pfizer’s current product line is expected to produce top line and bottom-line growth because of significant R&D and acquisitions.

Pfizer reported solid Q4 2024 results on February 4th, 2025. Company-wide revenue grew 21% operationally and adjusted diluted earnings per share climbed to $0.63 versus $0.10 on a year-over-year basis because of stabilizing COVID-19 related sales, growing revenue from the existing portfolio, and lower expenses.

Global Biopharmaceuticals sales gained 22% to $17,413M from $14,186M led by gains in Primary Care (+27%), Specialty Care (+12%), and Oncology (+27%). Pfizer Centerone saw 11% lower sales to $325M, while Ignite revenue was $26M.

Of the top selling drugs, sales increased for Eliquis (+14%), Prevnar (-4%), Plaxlovid (flat), Cominraty (-37%), Vyndaqel/ Vyndamax (+61%), Ibrance (-2%), and Xtandi (+24).

Click here to download our most recent Sure Analysis report on PFE (preview of page 1 of 3 shown below):

Beaten Down Dividend Stock #3: PepsiCo Inc. (PEP)

  • Expected Total Return: 16.3%

PepsiCo is a global food and beverage company. Its products include Pepsi, Mountain Dew, Frito-Lay chips, Gatorade, Tropicana orange juice and Quaker foods.

Its business is split roughly 60-40 in terms of food and beverage revenue. It is also balanced geographically between the U.S. and the rest of the world.

Source: Investor Presentation

On February 4th, 2025, PepsiCo announced that it would increase its annualized dividend by 5.0% to $5.69 starting with the payment that was made in June 2025, extending the company’s dividend growth streak to 53 consecutive years.

That same day, PepsiCo announced fourth quarter and full year results for the period ending December 31st, 2025. For the quarter, revenue decreased 0.3% to $27.8 billion, which was $110 million below estimates.

Adjusted earnings-per-share of $1.96 compared favorably to $1.78 the prior year and was $0.02 better than excepted.

For the year, revenue grew 0.4% to $91.9 billion while adjusted earnings-per-share of $8.16 compared to $7.62 in 2023. Currency exchange reduced revenue by 2% and earnings-per-share by 4%.

Click here to download our most recent Sure Analysis report on PEP (preview of page 1 of 3 shown below):

Beaten Down Dividend Stock #2: Estee Lauder Cos. (EL)

  • Expected Total Return: 16.9%

Estee Lauder is one of the world’s largest cosmetics and beauty care companies. It competes primarily in the upscale and prestige portion of the market. Sales break down as follows: Skin care makes up 52% of sales, makeup constitutes 28%, fragrance is another 16%, and hair care is the other 4%.

Leading brands include the namesake Estee Lauder along with Clinique, Aveda, M.A.C., and Origins among others. Estee Lauder is a truly international firm, operating in more than 150 countries.

Generally, revenues are split almost equally in thirds between the Asia-Pacific, Europe Middle East & Africa, and the Americas segments though Asia-Pacific is underperforming at the moment.

Estee Lauder has historically shown strong and consistent growth, with top-line revenues growing from $11.0 billion in 2014 to $17.7 billion in 2022. The firm’s strong branding and distribution network makes Estee Lauder a dominant competitor in most markets.

The company reported its Q2 2025 results on February 4th, 2025. Adjusted earnings-per-share of 62 cents fell from the $0.88 for the same period of last year, but greatly exceeded expectations of just 32 cents. Revenues of $4.0 billion decreased 6% year-over-year but beat expectations.

Click here to download our most recent Sure Analysis report on EL (preview of page 1 of 3 shown below):

Beaten Down Dividend Stock #1: Eversource Energy (ES)

  • Expected Total Return: 19.7%

Eversource Energy is a diversified holding company with subsidiaries that provide regulated electric, gas, and water distribution service in the Northeast U.S.

FactSet, Erie Indemnity, and Eversource Energy are the three new Dividend Aristocrats for 2025.

The company’s utilities serve more than 4 million customers after acquiring NStar’s Massachusetts utilities in 2012, Aquarion in 2017, and Columbia Gas in 2020.

Eversource has delivered steady growth to shareholders for many years.

Source: Investor Presentation

On February 11th, 2025, Eversource Energy released its fourth-quarter and full-year 2024 results. For the quarter, the company reported net earnings of $72.5 million, a significant improvement from a net loss of $(1,288.5) million in the same quarter of last year, which reflected the impact of the company’s exit from offshore wind investments.

The company reported earnings per share of $0.20, compared with a loss per share of $(3.68) in the prior year. For the full year 2024, Eversource reported GAAP earnings of $811.7 million, or $2.27 per share, compared with a full-year 2023 loss of $(442.2) million, or $(1.26) per share.

On a non-GAAP recurring basis, the company earned $1,634.0 million, or $4.57 per share, representing a 5.3% increase from 2023.

Click here to download our most recent Sure Analysis report on ES (preview of page 1 of 3 shown below):

Other Blue Chip Stock Resources

The resources below will give you a better understanding of dividend growth investing:

Thanks for reading this article. Please send any feedback, corrections, or questions to [email protected].


Source link

Soft-Drink, Beer Makers Can Benefit as Americans Drink Less, Morgan Stanley Says


Soft-drink and beer makers stand to benefit as Americans consume less booze. 

That’s the take of analysts at Morgan Stanley, who late Tuesday published a report discussing possible outcomes as alcohol seems out of favor at the moment–a trend Investopedia has covered lately. The drivers, in short, include an increasingly health-conscious consumer, but also economic pressures that could be short-term. 

“With alcohol per capita consumption likely to decline, we see the zero-alcohol segment as ripe for strong growth,” Morgan Stanley wrote. “We believe that beer is better positioned than spirits in this regard. We similarly see higher growth for soft drinks, aided by stronger pricing power, and with innovation to better satisfy the ‘good for you’ criteria increasingly demanded by the younger consumer.”

Companies are making decisions informed by the same trends. PepsiCo (PEP) earlier this month agreed to buy prebiotic soda brand Poppi for $1.65 billion. Reed’s, a company known for ginger ales that trades over the counter, on a recent conference call discussed a new “multifunctional” line of sodas made with ingredients like organic ginger and mushroom extracts and comparably low calorie counts. 

“These beverages cater to the rising demand for health conscious, functional refreshment options and position us at the forefront of the evolving beverage market,” Reed’s CEO Norman Snyder said on the call, a transcript of which was made available by AlphaSense. Snyder added that “the early response from retailers has been overwhelmingly positive, reinforced by their expansion of shelf space dedicated to the functional and better-for-you beverage category.”

Among Morgan Stanley’s recommendations: Buy Coca-Cola (KO), avoid Brown-Forman (BF.B). They’re also positive on several European and Asian companies known for their beer offerings. 

“We believe that, in developed markets spirits growth will slow, as consumers shift towards lower/non-alcoholic options,” the analysts wrote. “For the beer market, we see this as an opportunity.”


Source link