How an Elon Musk Venture May Offer Security in the Meltdown


Editor’s note: “How an Elon Musk Venture May Offer Security in the Meltdown” was previously published in February 2025 with the title, “The Best Elon Musk Venture for Unlocking 2025 Gains.” It has since been updated to include the most relevant information available.

We won’t sugarcoat it; the stock market is in turmoil right now.

Yesterday – Monday, March 10 – the Dow Jones lost almost 1,000 points. The S&P 500 dropped nearly 3%, while the Nasdaq crashed 4%. 

It was one of the worst days on Wall Street since September 2022. And it continues what has been a horrible few weeks for stocks.

The S&P has sunk 9% from its recent highs in February, essentially matching its largest correction since 2022.

The Nasdaq has crashed almost 14%, its largest correction since 2022.

The Russell 2000 has collapsed more than 17%, also matching its largest correction since 2022.

Collectively, the “Magnificent 7” tech stocks have slumped over 20%, slipping into their first bear market since – you guessed it – 2022.

This is, by most metrics, the worst stock market selloff in more than two years.

But that may also mean it’s the best buying opportunity we’ve seen in that time, too…

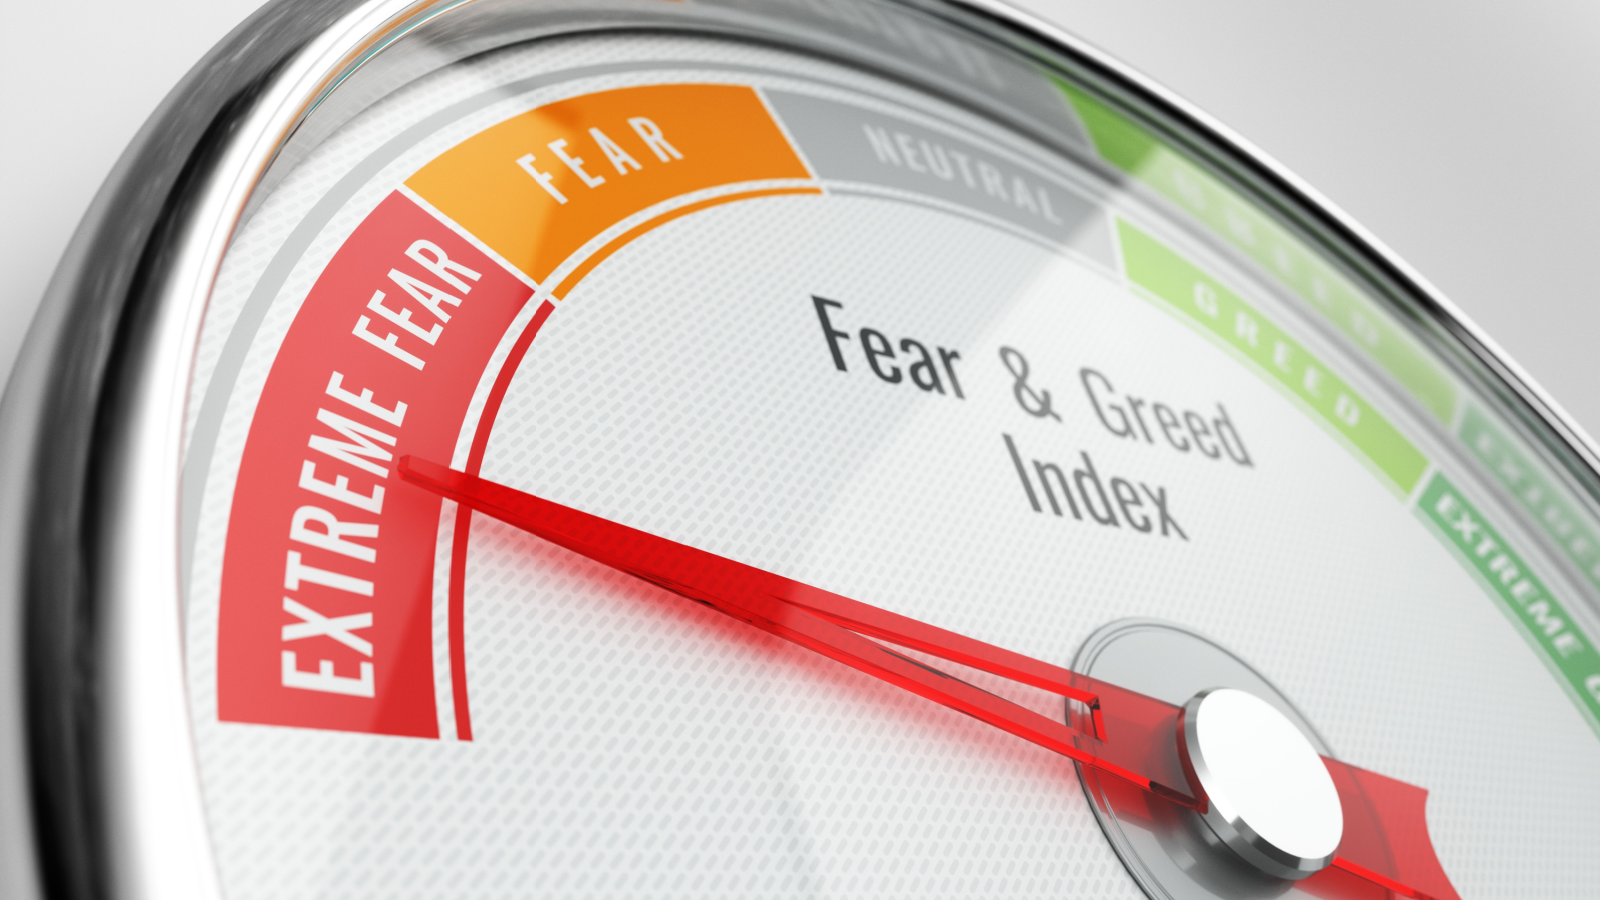
Be Greedy When Others Are Fearful

As Wall Street legend Warren Buffett says, it’s best to be greedy when others are fearful. 

Historically speaking, this rings true.

According to the weekly American Association of Individual Investors (AAII), investor sentiment is currently as bearish as it’s basically ever been. Since the 1980s, every time investor sentiment was as bearish as it is today, stocks always soared over the next 12 months for an average gain of nearly 30%.

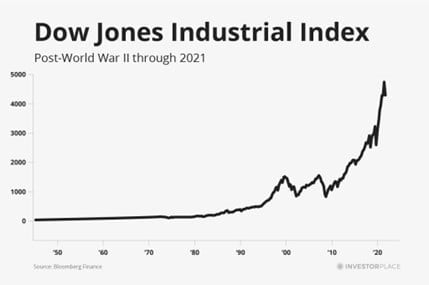
Meanwhile, the Nasdaq 100 has dropped below its most important technical support line – the 200-day moving average – for the first time in over a year. It has done the exact same thing precisely 11 times before since 1990.

Every time the market played strong defense at these levels and stayed within 4% of its 200-day moving average over the subsequent two weeks, stocks always rebounded over the next 12 months, with average gains of over 25%. This happened in early 1992, early 1996, late 1997, early 2004, mid-2010, late 2014, and late 2018.

So… while stocks are in turmoil right now… the data is saying that this may end up being a great buying opportunity.

Taking a Cue From Elon Musk

To help us find the best stocks to buy amid this market meltdown, we are setting our sights on someone who probably knows more about making money than anyone else – the world’s richest man himself, Elon Musk.

Long gone are the days when Elon Musk was merely ‘the Tesla guy.’

The billionaire entrepreneur has brought electric cars to the mainstream and reimagined rocket launches and space travel. He’s working to develop brain implant technology that allows humans to control devices with their thoughts. He aims to reinvent social media with X and introduce fully autonomous humanoid robots via Tesla’s (TSLA) Optimus.

And now Musk is taking on his boldest mission yet—tackling government waste as President Trump’s head of Department of Government Efficiency (DOGE).

As if he wasn’t already powerful enough, the world’s richest man has become infinitely more influential since Donald Trump won the White House. 

A lot of investors are saying that’s a good thing for Tesla stock. And it could be. But we think investors focused on TSLA are considering the wrong Musk company for 2025. 

Of all of his ventures, Tesla is not the one positioned for the most success this year. 

That would be xAI, his AI startup. 

xAI: A Brief Overview

Founded about two years ago, xAI was created to develop foundational AI models to rival that of OpenAI’s ChatGPT and Google’s Gemini. In that time, xAI has launched several models, the latest of which – Grok-3 – just debuted in late February. And from the looks of it, the AI is quite capable.

It was developed using over 10 times the computing resources of its predecessor, Grok-2, leveraging a massive data center equipped with approximately 200,000 GPUs. The model introduces sophisticated reasoning features, which allow it to deconstruct problems into manageable components and perform self-fact-checking to ensure accuracy before providing solutions. And it also includes a new Deep Search feature – an integrated AI-powered search engine designed to reduce the time users spend hunting for information by providing detailed explanations for its responses. 

According to xAI, Grok-3 outperforms other incumbent AI models like ChatGPT, Gemini, and DeepSeek in areas such as mathematics, science, and coding. 

It seems to be a new landmark model.

And thanks to this rapid success, xAI is currently in talks to raise up to $10 billion from multiple investors at a $75 billion valuation… 

Meaning that, less than two years after it was launched, xAI is already worth more than 70% of the companies in the S&P 500

But this may still be just the beginning for the startup. 


Source link

Dick’s Sporting Goods Warns of Macroeconomic Issues, Gives Soft Outlook


Key Takeaways

  • Dick’s Sporting Goods gave a weak outlook Tuesday as it says it faced a “dynamic macroeconomic environment.”
  • The sporting goods retailer raised concerns about the impact of tariffs on consumer spending.
  • Dick’s posted better-than-expected fourth-quarter results as same-store sales rose.

Dick’s Sporting Goods (DKS) shares lost ground Tuesday when the athletic equipment retailer posted full-year projections mostly below forecasts as it dealt with a “dynamic macroeconomic environment.”

The company sees fiscal 2025 earnings per share (EPS) of $13.80 to $14.40, and revenue of $13.6 billion to $13.9 billion. Analysts surveyed by Visible Alpha were looking for $14.82 and $13.89 billion, respectively. In addition, the midpoint of Dick’s outlook of a 1% to 3% rise in comparable store sales also missed estimates. 

Executive Chairman Ed Stack said in a CNBC interview that there’s “just a bit of an uncertain world out there right now.” Stack added that “if tariffs are put in place and prices rise the way that they might, what’s going to happen with the consumer?”

Dick’s Q4 Results Top Estimates

The forecast offset the retailer’s strong fourth-quarter results. Dick’s reported EPS of $3.62 and revenue of $3.89 billion. Both were better than expected. 

Comparable store sales jumped 6.4%, and CEO Lauren Hobart explained that gave Dick’s “the largest sales quarter in company history.”

Despite today’s roughly 3.5% decline, shares of Dick’s Sporting Goods are up about 13% year-over-year.

TradingView


Source link

Your “Bear-Market Survival Plan” Consists of These Elements


Editor’s Note: On Saturday, we sent you the first part of a brand-new report from InvestorPlace CEO Brian Hunt, titled What to Do When the Stock Market Drops. Today, we’re going to share the conclusion. We hope you enjoy it – stay safe out there, and don’t lose heart. 

Hello, Reader.

If you haven’t had the chance yet to read up on the first part of this article, please go here now. There is critical information about bear markets that you can’t miss.

Now, you know that for every ONE problem in America, there are THOUSANDS of brilliant people working on innovative solutions. They are developing amazing products and services that will make our lives better.

These are the types of people who invented the light bulb… the television… the pacemaker… the airplane… and the iPhone.

They are people who have the brains and worth ethic to create incredible businesses like Starbucks, Facebook, Amazon, Whole Foods, Apple, Nike, and Google.

These companies have provided good jobs to millions of people… they provided goods and services to thankful customers… and they produced hundreds of billions of dollars in wealth for their shareholders. All by creating and innovating.

Even better, these kinds of folks work in America. Despite what some Debbie Downers like to say, the legendary investor Warren Buffett is right: America is still the greatest place in the world to do business.

  • We have deep and liquid capital markets.
  • We have rule of law.
  • We have excellent accounting standards, which creates transparency.
  • We encourage and foster innovation.
  • We respect property rights.
  • We have an excellent transportation network (if you’ve fallen for the myth that U.S. infrastructure is terrible, I urge you to visit a third world country for comparison).
  • We have a huge population of well-to-do consumers ready to buy great products and services.

The advances made by American entrepreneurs allow today’s average American to live better than a king did 100 years ago.

Even people in America’s “low income” bracket have better medical care, better food, better transportation, and better access to information than anyone did in 1919, no matter what their level of wealth.

In other words, free markets, innovation, and productive enterprise has allowed mankind to achieve incredible progress despite wars, recessions, and bear markets.

It’s been that way for centuries… and it will continue to be that way in the future, despite any bear market fluctuations.

Below is a chart of the Dow Jones Industrial Index from post-World War II through 2021.

a chart showing the Dow's value from post-WWII through 2021a chart showing the Dow's value from post-WWII through 2021

Incredible, right?

The stock market declines of 1987, 2000, and 2008 – while painful at the time – are just speed bumps on the long-term chart. And the takeaway is clear: Over time, American prosperity rises and the stock market goes up.

With this picture in mind, my advice is to “make the trend your friend” and ignore the naysayers. Don’t panic over a market correction, and don’t let the fear-stoking headline of the hour scare you out of your holdings of high-quality innovative companies that are poised to change the world.

During stock market corrections, I ask you to focus on what really matters: progress, transformational industry trends, creating value for others, and innovation.

Remember that despite all the negative occurrences of the past 100 years, shareholders of innovative companies that serve their customers have made fortunes.

It’s been the surest way to get rich in America for more than 100 years. It will be that way for at least 100 more. That’s why staying bullish on human progress and innovation is at the foundation of what we do at InvestorPlace.

It’s also why, when our subscribers write in to ask if we have “bear market survival” plans, we send them this essay.

Our “bear market survival” plan consists of reviewing the facts above, thinking long-term, and looking to buy high-quality stocks at discount prices.

Our “bear market survival” plan does not consist of selling stocks in a panic.

I believe that when an investor can “deprogram” themselves from obsessing over “the market” and interest rates – and instead focus on the things above – the things that history has shown really matter – that investor ascends to a higher level of understanding when it comes to money and investing.

It’s one of the most important milestones on the journey to mastering money.

The Next Time You’re Tempted to Panic About a Bear Market, Look at These Eight Charts

Since 1928, there have been 26 bear markets in the benchmark S&P 500 stock index. After each and every one of them, stocks went on to reach all-time highs. The track record here is perfect.

Recent history has eight outstanding examples of why a smart “bear market strategy” consists of keeping the facts in mind, thinking long term, and not getting scared out of stocks.

We like to think these eight charts are an antidote to a harmful financial disease we call “Short-Term-itis.”

For example, during the famed 1987 “Black Monday” crash, the stock market dropped 33.5% in a single day. It caused a short-term global financial panic.

However, less than two years later, the stock market reached an all-time high.

a chart showing that after the 1987 Black Monday crash, stocks reached an all-time higha chart showing that after the 1987 Black Monday crash, stocks reached an all-time high

Then you have the big stock market decline of 1990, which was created by worries over a U.S. recession and the Gulf War. Stocks fell 19.9% during this decline. However, stock recovered and hit a new all-time high less than a year later.

a chart showing that after the 1990 decline, stocks reached an all-time higha chart showing that after the 1990 decline, stocks reached an all-time high

Then you have the big 1998 market decline. Stocks fell 19.3% over the span of a few months. Stocks quickly recovered and reached a new all-time high by early 1999.

a chart showing that after the big 1998 drop, stocks reached an all-time higha chart showing that after the big 1998 drop, stocks reached an all-time high

Then you have the 2000-2002 bear market. This crash came after the dot.com reached its frenzied peak in March 2000. Although this was one of the worst market downturns in U.S. history, stocks went on to recover and reach new all-time highs in 2007.

a chart showing that after the tech crash of 2000, stocks reached an all-time higha chart showing that after the tech crash of 2000, stocks reached an all-time high

Next you have the stock bear market that accompanied the Great Financial Crisis of 2008. Stocks fell an incredible 56% during the decline. However, stocks went on to recover and entered a historic bull market that lasted a decade. Fortunes were made during the recovery and the market reached a new all-time high in 2013.

a chart showing that after the great financial crisis of 2008, stocks reached an all-time higha chart showing that after the great financial crisis of 2008, stocks reached an all-time high

In the midst of the decade-long recovery that followed the 2008 crash, the market saw a decline of about 19% in late 2011. Stocks recovered and reached a new all-time high by early 2012.

a chart showing that after the 2011 decline, stocks reached an all-time higha chart showing that after the 2011 decline, stocks reached an all-time high

In 2018, the market suffered a gut-wrenching decline of 19%. But by the summer of the following year, stocks had recovered and reached another new all-time high.

a chart showing that after the 2018 decline, stocks reached an all-time higha chart showing that after the 2018 decline, stocks reached an all-time high

Then there is the COVID-19 related stock market drop and recovery of 2020. When the world realized COVID-19 was a serious worldwide problem, the market fell 53% in less than two months. However, government stimulus helped the market recover and stocks reached a new all-time high by the end of the year.

a chart showing that after the COVID-19 crash of 2020, stocks reached an all-time higha chart showing that after the COVID-19 crash of 2020, stocks reached an all-time high

Summing Up Famous Bear Markets

You’ve just gone on a tour of the biggest financial disasters of the past 60 years.

You’ve reviewed the most famous, most horrible bear markets and stock crashes in history… like the Black Monday crash of 1987… the dot-com crash of 2000… and the Great Financial Crisis of 2008.

You’ve also seen the track record here is perfect. Each period of rough times was followed by all-time highs.

These recent recoveries highlight a very long trend…

Every major stock market correction, every crash, every bear market in American history has been followed by new all-time highs.

That’s why we state once again… FOR EMPHASIS…

During stock market corrections, focus on what really matters: progress, transformational industry trends, creating value for others, and innovation.

Remember that despite all the negative developments of the past 100 years, shareholders of innovative companies that serve their customers have made fortunes.

Remember that it pays to bet on America.

Remember that a wise “bear market survival” plan consists of reviewing the facts above, thinking long-term, and staying long stocks.

Regards,

Brian Hunt


Source link

Bid for safe haven in FX markets – United States


Written by the Market Insights Team

The sting of market ‘detox’

Kevin Ford –FX & Macro Strategist

The withdrawal symptoms from the “detox” period that Treasury Secretary Scott Bessent predicted for the economy and markets are proving to be jittery and turbulent, particularly for U.S. equity markets. Over the past week, heightened risk aversion has driven a strong bid for safe-haven assets as sentiment remains skewed toward negative news. In the FX space, currencies like the Japanese Yen and Swiss Franc have appreciated against the greenback, which continues to face negative sentiment.

Spring-forward and markets woke up on the wrong side of bed yesterday following a significant sell-off in U.S. equities. Concerns about the economic impact of tariffs and federal government spending cuts persist. The only developments that might stabilize markets are a reversal of tariff policies or swift approval of tax and deregulation measures. However, the former appears highly unlikely, and with less than a week remaining to avert a U.S. government shutdown, uncertainty surrounds the timeline for approving President Trump’s budget.

Revisiting the ongoing tariff story, here’s a quick recap of last week’s developments:

– Tuesday: The U.S. imposed a 25% tariff on Mexico-Canada trade.

– Thursday: Trump announced a delay for all CUSMA/USMCA-compliant trade items until April 2nd. The positive news for Canadian exporters, is that over 40% of trade already meets compliance standards, with the majority of the remaining items likely to follow soon.

– Friday: President Trump signaled the possibility of new tariffs on Canadian dairy and lumber imports, scheduled to take effect on April 2nd. Adding to the tension, China announced steep import levies on Canadian agricultural goods, including a 100% tariff on rapeseed oil, oil cakes, and peas, alongside a 25% duty on aquatic products and pork, effective March 20th.

Currently, a 10% tariff applies to Canadian energy products not covered by USMCA preferences, while aluminum and steel tariffs of 25% are set to begin tomorrow. By April 2nd, clarity is expected on whether the 25% Mexico-Canada tariff will be rescinded or if sector-specific targeting, including dairy and lumber, will proceed alongside other reciprocal tariffs.

The Bank of Canada (BoC) is set to meet tomorrow and will likely address these escalating tariff tensions. A potential rate cut to the midpoint of their neutral range is on the table, with the possibility of a more aggressive easing cycle if broad tariffs persist. For investors, it is important to recognize that a definitive resolution to the regional trade dispute may not materialize until CUSMA/USMCA is renegotiated. Even in the absence of sustained tariffs, a clear resolution appears unlikely in the near term.

Chart: Yield differential has decreased ahead of BoC meeting

Volatility jumps on economic jitters

George Vessey – Lead FX & Macro Strategist

US stocks are heading toward their worst start to a presidential term since 2009, weighed down by recession fears and related uncertainty around tariffs. The Nasdaq 100 sank up to 4% on Monday, its worst day since 2022, while the S&P 500 extended its slide from a record to 8% and closed below its 200-day moving average for the first time since November 2023. Benchmark Treasury yields plunged as bets on supportive Federal Reserve (Fed) rate cuts rose, whilst the US dollar index steadied after suffering its worst week in two years.

US President Donald Trump’s shifting stance on tariffs has been stoking anxiety across financial markets for some time. But more recently, it’s raising concerns that policy uncertainty could tip the US economy into a recession. Indeed, Trump refused to rule out the possibility of a recession in an interview over the weekend, dismissing business concerns over lack of clarity on his tariff plans. This intensified speculation that short term economic pain will be tolerated by his administration in pursuit of longer term goals. Amidst the uncertainty around trade policy, sticky inflation and the unknown pace of the Fed’s interest-rate easing cycle, investors should anticipate continued volatility. We’ve already seen the VIX index, a gauge of expected volatility in the S&P 500 jump to its highest level since December. Implied volatility in the currency space has risen, but remains far from the 2022 and 2020 peaks.

The fundamentals of the Trump plan of deregulation and tax cuts were supposed to be dollar positive, but the execution of his plan with tariffs has soured the market mood and looks like it’s now dollar negative. In the very short term, a consolidation phase or slight correction higher looks feasible for the dollar after last week’s turbulence but we think we’ve already seen peak dollar strength for 2025. US JOLTS job openings data today followed by inflation data on Wednesday will be closely monitored on the data docket.

Chart: Markets pricing in second largest risk premium in 2 years

A watershed moment for the euro

George Vessey – Lead FX & Macro Strategist

After its best week since March 2009, EUR/USD’s momentum looks to be waning given the pair now sits in the overbought zone on the daily chart. Still, a high of $1.0875 today is almost five cents greater than where it was trading this time last week. We may be in for a short period of consolidation before another leg higher, but a few bullish factors remain in focus.

As we’ve reported, the EU plans to adjust fiscal rules to ramp up spending and that has sent yields soaring across Europe but has also fuelled optimism about a boost to the region’s economy. A report that Germany’s Green Party is ready to negotiate and see chances for an agreement over the defence spending by the end of this week is boosting this narrative. The theme may get some fresh impetus from potential US-Ukraine negotiations on Wednesday and further details about provisions by EU states for increased defence spending, including in support of Ukraine. However, there is a hint of overexuberance in the short term because of the slow transmission from an expansionary fiscal policy into growth and ECB’s reaction function. Plus, let’s not forget that a trade war might still be heading Europe’s way. Hence, further gains for the common currency are also going to rely on a continuation of the US slowdown story. One thing seems certain though, the narrative of independent US and European stories stands to lift FX volatility.

In the absence of top-tier economic data from Europe today, focus will also be on ECB speakers. After last Thursday’s interest rate cut, traders are now only fully pricing in one further quarter-point reduction in 2025, which would take the deposit rate to 2.25%. About a week ago they had fully priced in the rate moving to 2% by December.

Chart: Euro had its best week since 2009

Sterling testing key support versus euro

George Vessey – Lead FX & Macro Strategist

The pound is testing its supportive 50-week moving average against the euro this morning. A close below could open up the door to €1.1740 as German and UK yields narrow and prospects for Eurozone growth look stronger in the wake of the bazooka spending plans from Europe. Meanwhile, GBP/USD upside traction has stalled, with the pair perched near the $1.29 handle after last week’s massive 2.7% climb.

With US recession risks rising, the risk sensitive pound lost the most ground against the Japanese yen yesterday as heightened risk aversion drove demand for safe-haven currencies. Although the UK looks better positioned to avert tariffs from the US due to its goods trade deficit, the pound is likely to remain vulnerable via the risk sentiment channel due to its worsening net international investment position and the fact it has a persistent current account deficit. This means sterling is reliant on foreign capital inflows, which often dry up when the market mood turns sour.

Meanwhile, on the macro front, data early this morning showed retail sales in the UK rose by 0.9% y/y in February, a sharp slowdown from January’s 2.5% gain and well below the expected 2.4% increase. Consumers continued to cut back on purchases amid the ongoing cost-of-living crisis. UK GDP figures later this week will be in spotlight for pound traders.

Chart: Pound falls in line with rate differentials

Equities, oil and yields tumbling

Table: 7-day currency trends and trading ranges

Table: 7-day currency trends and trading ranges.

Key global risk events

Calendar: March 10-14

Table: Key global risk events calendar.

All times are in ET

Have a question? [email protected]

*The FX rates published are provided by Convera’s Market Insights team for research purposes only. The rates have a unique source and may not align to any live exchange rates quoted on other sites. They are not an indication of actual buy/sell rates, or a financial offer.


Source link

Inflation Is Americans’ Top Financial Concern, New Survey Shows


Americans can’t shake their inflation fears.

Two-thirds of U.S. adults say inflation is their biggest financial concern, according to a survey released Monday by Northwestern Mutual, and more than half believe inflation will increase this year.

More than half of respondents to the survey said inflation is rising faster than their household income: Over 80% said they have experienced higher grocery bills in the last three months; nearly seven in 10 experienced elevated utility costs; and 60% have had sticker shock at the gas pump. The survey, conducted in mid-January, was taken by more than 4,600 American adults.

Another fresh reading, from the New York Fed, indicates that Americans in February anticipated inflation getting worse over the next 12 months.

“Economists often talk about how inflation is ‘sticky,’ meaning it takes time to reverse a broad economic cycle,” said Northwestern Mutual Chief Field Officer John Roberts. “Our study findings show that inflation is sticky at the individual level too—it remains top of mind for people, and they get reminded of it often in their daily lives.”

The next big read on inflation, the Consumer Price Index report for February, is scheduled for release Wednesday morning. (Here’s what to expect.) The National Retail Federation’s monthly tracker of retail sales indicated a slight retreat in February from January.


Source link

Big Tech’s Quantum War Has Begun — and One Tiny Stock Could Win It


Editor’s Note: The market may be turbulent, but innovation never stops — and that’s exactly why InvestorPlace Senior Analyst Louis Navellier remains confident. Just days ago, Amazon unveiled Ocelot, its first quantum computing chip, joining Microsoft and Google in a race to dominate this emerging tech frontier… and the next big investing opportunity.

But let’s be honest — quantum computing is complex, and understanding its real impact on the market can be challenging. That’s why Louis Navellier is holding an urgent briefing on Thursday, March 13, at 1 p.m. ET… just one week before Nvidia’s big “Quantum Day” announcements. Click here now to register your spot for this free event.

Further, Louis and his team have put together a special series on quantum investing for his own e-letter… and he’s agreed to let us run one of those pieces here today.

Additionally, the markets are experiencing a sharp sell off this morning over fears of a potential recession caused by President Trump’s recent tariffs on Canada, Mexico, and China. We will continue to cover this story in here in Smart Money later in the week. If any immediate action needs to be taken in any of our services, we will let you know.

There’s a crazy thing about innovation.

Tech revolutions often happen at a snail’s pace at first…

And then, one day you wake up and the world looks completely different from what you remember.

Consider electricity.

For thousands of years, people saw this “magical” force streak across the sky as lightning. But no one knew what to do with it.

Progress was slow at first. It took people until the 1600s to start experimenting with static electricity. And it wasn’t until 1871 that the phenomenon became commercially useful with the invention of the first electric motor.

It would take another 76 years for transistors to unlock electricity’s full potential.

But since then, the humble transistor has changed the world. The computers enabled by this technology have helped us fly people to the moon… communicated with satellites millions of miles away… even mapped the number “pi” to 105 trillion digits.

And it’s all thanks to understanding how to tame this “magical” power of electricity to power the millions of logic gates that build the modern microprocessor.

Quantum computing is on the same path.

In 1955, physicist Louis Essen switched on the world’s first working quantum machine, the cesium atomic clock.

By blasting finely tuned microwaves at a stream of cesium atoms, Essen and his team forced these atoms into a “superposition” state, where they were in more than one energy state at once… a “quantum state” where they are both grounded and excited. This was perhaps the “electric motor” moment of quantum mechanics – another “magical” force first described by German physicist Max Planck in 1900.

Quantum’s “transistor moment” is now at our doorstep.

Indeed, I’m sure you’ve noticed that three top Big Tech companies have made a big deal about their new “quantum chips” in the past couple of months:

  • Alphabet Inc. (GOOG)
  • Amazon.com Inc. (AMZN)
  • Microsoft Corp. (MSFT)

But which of these companies will actually create the first working “quantum transistor”? And where should investors be putting their money?

In this article, we’ll take a closer look at all three of these new quantum chips. We’ll do a little comparing and contrasting in order to figure all that out.

Some of this is going to get pretty technical… but we need to know this stuff to help guide our quantum investing decisions today.

Plus, once you finish reading this, you’re going to have a pretty good idea of why I’m making a certain quantum recommendation… one that could even beat these three heavyweights at their own game.

But first, here’s what I can tell you about these three quantum chips…

The Workhorse of Quantum: Alphabet

In 1999, a team of Japanese researchers developed the “charge qubit,” a relatively simple circuit that paired a capacitor and inductor to create a quantum-like oscillation. This allowed scientists to create quantum behavior on a circuit board.

A more advanced version came several years later, in 2007, after Yale researchers developed the “transmon qubit.” This new circuit used a complex series of capacitors to protect qubits from outside charge noise. This allowed qubits to be stored for longer periods and reduced error rates to roughly 1 in 500. Below is a simplified circuit diagram of this innovation.

Source

Transmon qubits have since become the “workhorse” of quantum chips. They are considered the most reliable way of creating quantum states in a controlled environment and are preferred to older methods that use physical atoms like an atomic clock does. The challenge is now to bring their 1-in-500 error rates low enough for transmons to do calculations.

The leader of this race is Alphabet.

In 2019, the search giant made a splash after launching its Sycamore quantum chip – the first to pile 54 of these transmon qubits onto a single board. And on December 9, the firm followed up with Willow, a chip with 105 qubits that can maintain coherence for as long as 68 microseconds – a 5X improvement over previous generations.

Alphabet’s Willow chip isn’t perfect yet either. The 105-qubit chip can only handle around three errors at a time, which is still too low for practical applications. In addition, experts estimate that millions of qubits will be needed to tackle complex, real-world problems like encryption breaking; packing that many qubits together is a logistical challenge, since Willow’s superconducting qubits need near-zero temperatures to operate.

Still, Alphabet’s 105 transmon qubit chip represents one of the greatest advances yet in quantum. They’re beginning to tackle the scaling issue of error rates, and it’s perhaps only a matter of time for larger chips to emerge.

The Experimental Play: Amazon

Amazon made its own splash with the Ocelot quantum chip on February 27. This experimental model uses five “cat qubits,” a newer qubit technology that stores quantum information inside a microwave cavity, rather than on superconducting circuit as a transmon qubit does.

Its feline name comes from the famous Schrödinger cat, a thought experiment suggesting a cat in a box can be both dead and alive until someone looks inside. Cat qubits store information in a similarly confusing quantum state.

I must emphasize that cat qubits are still experimental… and they’re not guaranteed to work at larger scales.

But their potential is enormous.

That’s because cat qubits have far lower error rates than traditional qubits. Bit-flip errors (where a qubit accidentally flips from “0” to “1”) can be as low as 1 in 100,000. Think of bit-flip errors as flipping a coin from heads to tails.

These cat qubit systems can also maintain “coherence” for as long as 1 millisecond, since microwave cavities are naturally better at protecting data from the outside environment.

However, cat qubits are not good at preventing phase-flip errors, where the relative phase between qubits is confused. In my previous coin example, this is like keeping the coin on heads, but swapping “heads = good” with “heads = bad.”

To overcome this problem, Amazon’s Ocelot chip uses four transmon qubits (the same established technology Alphabet uses) to help monitor cat qubits. This creates a web of error-correcting qubits that help bring accuracy up to a more acceptable level.

Source

Another issue is that microwave cavities are even harder to pack into the ultra-cold cryogenic environment required by transmon qubits. Microwaves can create thermal noise that can destroy cat states, and tightly packed cavities risk creating cross-talk. Transmon qubits have had over a decade of development and refinement, while cat qubits are still barely out of the gate.

Still, Amazon’s higher-risk, higher-reward wager may pay off. Its prototype has managed to reduce error rates by as much as 90%, and time will tell if this hybrid cat/transmon approach works.

The Dark Horse: Microsoft

Finally, Microsoft has taken the greatest “high-risk, high-reward” approach with its Majorana 1 chip, which was released February 19.

Microsoft’s Majorana 1 uses a “topological qubit,” a special surface that can hold quantum data in a spread-out way. The theory is that a surface would make it easier to scale from several dozens of qubits to several millions of them because you only need to add more surface area to add more qubits. They would also be more error-resistant because quantum information is spread out.

In Microsoft’s case, Majorana 1’s “special surface” consists of semiconductor wires made from indium antimonide (InSb) and indium arsenide (InAs), two materials with favorable properties for storing an electron’s spin. These are then wrapped in a thin aluminum shell, creating a superconductor required for quantum states to form.

It’s crucial to note that Microsoft faces even greater hurdles than Alphabet or Amazon because topological qubits have not yet been proven to work. The Majorana 1 chip, as submitted to the journal Nature, wasn’t a working model of quantum computing. Instead, it only addressed a tiny sliver of the problem ahead.

You see, one of the challenges of topological qubits is how to “read” the information stored across these special surfaces. Information is no longer localized in a single spot, and so the entire system must be analyzed. In addition, the action of reading data from these surfaces can destroy the state. It’s much like having a secret message written in smoke. Open the door too quickly to read it, and even the slightest breeze will change what you see.

The Nature paper on the Majorana 1 chip now describes a new measurement technique to read data on topological surfaces in a single shot. Rather than doing repeated measurements to get an answer (which can introduce error and noise), the system can now read data in one go.

This is an incredible step forward… but also illustrates how far Microsoft has to go in its quantum ambitions. Time will tell whether Microsoft’s approach is the right one.

What Does This Mean for Your Wallet?

Now here’s the thing: The three tech giants aren’t the only companies working on next-generation qubits.

In fact, they might not even become the ultimate winners of the race to a viable quantum computer.

That’s because chipmakers like NVIDIA Corporation (NVDA) know that quantum computing is an existential threat to their dominance. Traditional electricity-based chips have trouble with complex tasks like 3D modeling and encryption. Quantum chips might solve these problems in the blink of an eye.

That’s why firms like NVIDIA are quietly funneling billions of dollars into quantum computing startups. They realize they can’t afford to miss out on the world’s next greatest technology… and neither can you.

That’s why I want you to mark your calendar for NVIDIA’s “Q Day,” Thursday, March 20, at 1 p.m. Eastern.

At that event, NVIDIA is poised to ignite the next phase of the quantum investing cycle. I expect the AI chipmaker to announce a new breakthrough technology that could light a fire under the shares of one of its “Q” partners… a stock 1,000 times smaller than NVIDIA.

To tell you all about it, I’m hosting an urgent summit on Thursday, March 13, at 1 p.m. ET… exactly one week before NVIDIA’s announcement… because I want to get you ahead of the crowd.

Click here now to register your spot.

During this free event, I’ll tell you the story of this tiny small-cap company positioned to be crucial to NVIDIA’s anticipated “Q Day” reveal, thanks to technology protected by 102 patents.

I also want you to know that this isn’t the first time I’ve made this sort of prediction. In fact, I made similar call on NVIDIA itself. So during this free event, I’ll show you how one of my readers held on and made 50X their money from my NVIDIA call all the way back in 2016.

This could be your first shot on the quantum revolution.

Click here to sign up and get all the details.

Sincerely,

Louis Navellier

Louis hereby discloses that as of the date of this email, Louis, directly or indirectly, owns the following securities that are the subject of the commentary, analysis, opinions, advice, or recommendations in, or which are otherwise mentioned in, the essay set forth below:

NVIDIA Corporation (NVDA)


Source link

Worst start to a presidential term since 2009 – United States


Volatility jumps on economic jitters

George Vessey – Lead FX & Macro Strategist

US stocks are heading toward their worst start to a presidential term since 2009, weighed down by recession fears and related uncertainty around tariffs. The Nasdaq 100 sank up to 4% on Monday, its worst day since 2022, while the S&P 500 extended its slide from a record to 8% and closed below its 200-day moving average for the first time since November 2023. Benchmark Treasury yields plunged as bets on supportive Federal Reserve (Fed) rate cuts rose, whilst the US dollar index steadied after suffering its worst week in two years.

US President Donald Trump’s shifting stance on tariffs has been stoking anxiety across financial markets for some time. But more recently, it’s raising concerns that policy uncertainty could tip the US economy into a recession. Indeed, Trump refused to rule out the possibility of a recession in an interview over the weekend, dismissing business concerns over lack of clarity on his tariff plans. This intensified speculation that short term economic pain will be tolerated by his administration in pursuit of longer term goals. Amidst the uncertainty around trade policy, sticky inflation and the unknown pace of the Fed’s interest-rate easing cycle, investors should anticipate continued volatility. We’ve already seen the VIX index, a gauge of expected volatility in the S&P 500 jump to its highest level since December. Implied volatility in the currency space has risen, but remains far from the 2022 and 2020 peaks.

The fundamentals of the Trump plan of deregulation and tax cuts were supposed to be dollar positive, but the execution of his plan with tariffs has soured the market mood and looks like it’s now dollar negative. In the very short term, a consolidation phase or slight correction higher looks feasible for the dollar after last week’s turbulence but we think we’ve already seen peak dollar strength for 2025. US JOLTS job openings data today followed by inflation data on Wednesday will be closely monitored on the data docket.

Chart of VIX volatility index

A watershed moment for the euro

George Vessey – Lead FX & Macro Strategist

After its best week since March 2009, EUR/USD’s momentum looks to be waning given the pair now sits in the overbought zone on the daily chart. Still, a high of $1.0875 today is almost five cents greater than where it was trading this time last week. We may be in for a short period of consolidation before another leg higher, but a few bullish factors remain in focus.

As we’ve reported, the EU plans to adjust fiscal rules to ramp up spending and that has sent yields soaring across Europe but has also fuelled optimism about a boost to the region’s economy. A report that Germany’s Green Party is ready to negotiate and see chances for an agreement over the defence spending by the end of this week is boosting this narrative. The theme may get some fresh impetus from potential US-Ukraine negotiations on Wednesday and further details about provisions by EU states for increased defence spending, including in support of Ukraine. However, there is a hint of overexuberance in the short term because of the slow transmission from an expansionary fiscal policy into growth and ECB’s reaction function. Plus, let’s not forget that a trade war might still be heading Europe’s way. Hence, further gains for the common currency are also going to rely on a continuation of the US slowdown story. One thing seems certain though, the narrative of independent US and European stories stands to lift FX volatility.

In the absence of top-tier economic data from Europe today, focus will also be on ECB speakers. After last Thursday’s interest rate cut, traders are now only fully pricing in one further quarter-point reduction in 2025, which would take the deposit rate to 2.25%. About a week ago they had fully priced in the rate moving to 2% by December.

Chart of EURUSD weekly

Sterling testing key support versus euro

George Vessey – Lead FX & Macro Strategist

The pound is testing its supportive 50-week moving average against the euro this morning. A close below could open up the door to €1.1740 as German and UK yields narrow and prospects for Eurozone growth look stronger in the wake of the bazooka spending plans from Europe. Meanwhile, GBP/USD upside traction has stalled, with the pair perched near the $1.29 handle after last week’s massive 2.7% climb.

With US recession risks rising, the risk sensitive pound lost the most ground against the Japanese yen yesterday as heightened risk aversion drove demand for safe-haven currencies. Although the UK looks better positioned to avert tariffs from the US due to its goods trade deficit, the pound is likely to remain vulnerable via the risk sentiment channel due to its worsening net international investment position and the fact it has a persistent current account deficit. This means sterling is reliant on foreign capital inflows, which often dry up when the market mood turns sour.

Meanwhile, on the macro front, data early this morning showed retail sales in the UK rose by 0.9% y/y in February, a sharp slowdown from January’s 2.5% gain and well below the expected 2.4% increase. Consumers continued to cut back on purchases amid the ongoing cost-of-living crisis. UK GDP figures later this week will be in spotlight for pound traders.

Chart of GBPEUR and real rate differential

Equities, oil and yields tumbling

Table: 7-day currency trends and trading ranges

Table of FX rates

Key global risk events

Calendar: March 10-14

Table of risk events

All times are in GMT

Have a question? [email protected]

*The FX rates published are provided by Convera’s Market Insights team for research purposes only. The rates have a unique source and may not align to any live exchange rates quoted on other sites. They are not an indication of actual buy/sell rates, or a financial offer.


Source link

Watch These Tesla Price Levels as Stock Plunges to Pre-Election Levels


Key Takeaways

  • Tesla shares fell more than 15% on Monday to lead S&P 500 decliners, closing below their Election Day level for the first time.
  • The stock soared in the wake of Donald Trump’s election amid expectations that CEO Elon Musk’s close relationship with the president would benefit the EV maker.
  • Since hitting a record high in mid-December, however, Tesla shares have fallen 55% amid investor concerns about potential fallout from Musk’s extensive involvement in the Trump administration and weak sales figures.
  • Tesla shares fell below the closely watched 200-week moving average in Monday’s trading session.
  • Investors should monitor key support levels on Tesla’s chart around $215 and $165, while also watching major resistance levels near $265 and $300.

Tesla (TSLA) shares tumbled 15% on Monday to lead S&P decliners, closing below their Election Day level for the first time.

Shares in the electric vehicle maker soared after Donald Trump’s victory in the Nov. 5 presidential election amid expectations that CEO Elon Musk’s close relationship with the president would benefit the company. However, since hitting an all-time high on Dec. 18, the stock has plunged 55% amid mounting investor concerns that Musk’s role as leader of the Department of Government Efficiency could hurt the Tesla brand and sales. Recent sales numbers from China and Europe have been weak, while uncertainty about the impact of tariffs on automakers also weighs on sentiment.

The stock, which has lost ground in each of the last seven weeks, fell an additional 3% in extended trading Monday after Musk said in an interview with Fox Business that he is running his businesses “with great difficulty.” Nonetheless, Musk added that he expects to remain in the Trump administration for another year.

Below, we break down Tesla’s weekly chart and apply technical analysis to point out key price levels worth watching out for amid the stock’s heighted volatility.

Stock Falls Below 200-Week Moving Average

Since a shooting star marked the stock’s record high in mid-December, Tesla shares have trended sharply lower, with the price falling below the closely watched 200-week moving average in Monday’s trading session.

Moreover, increasing volumes have accompanied the recent drop, signaling selling participation by larger market players, such as institutional investors and hedge funds.

While the relative strength index (RSI) confirms bearish momentum with a reading below 50, the indicator has moved into a region that has typically corresponded with bounces in the stock stretching back to May 2022.

Let’s identify several key support and resistance levels on Tesla’s chart that investors may be monitoring.

Key Support Levels to Monitor

Tesla shares fell 15.4% to close Monday’s regular trading session at $220.15.

The first level to track sits around $215. This area, currently near Tuesday’s projected opening price, could find support from a series of lows from May to July 2022 and the “shoulders” of an inverse head and shoulders pattern that formed on the chart over a twelve-month period between October 2023 and 2024.

Further downside could see the shares tumble to the $165 level. Investors may seek buying opportunities in this region near the April 2023 pullback low, which also closely aligns with an array of prices positioned just above the bottom of the inverse head and shoulders pattern.

Major Resistance Levels to Watch

During recovery efforts in the stock, it’s worth watching how the price responds to the $265 level, a location on the chart that may provide overhead resistance near the inverse head and shoulders’ neckline.

Finally, a convincing close above this level could see Tesla shares revisit the psychological $300 area. Investors who have bought recent weakness may look to lock in profits near a range of prominent peaks that developed on the chart between January 2021 and July 2023.

The comments, opinions, and analyses expressed on Investopedia are for informational purposes only. Read our warranty and liability disclaimer for more info.

As of the date this article was written, the author does not own any of the above securities.


Source link

Markets Fall as Tariff Fears Deepen


Assessing the “fairness” of tariffs … Bitcoin keeps falling; the level to watch … why the Strategic Bitcoin Reserve didn’t help … a spat among the Mag 7s

As I write Monday mid-afternoon, the markets are a sea of red. The Nasdaq leads the way, down more than 4%.

Behind the crash is the fear of a recession triggered by President Trump’s tariff policy.

Here’s The Wall Street Journal:

President Trump over the weekend refused to rule out the U.S. entering a recession this year, telling Fox News there will be a “period of transition, because what we’re doing is very big.”

Now, though Commerce Secretary Howard Lutnick said, “There’s going to be no recession in America,” investors don’t feel reassured.

Tariffs are at the heart of Trump’s economic plans…and the market’s bewilderment

For an illustration, let’s go to Trump last Friday:

Canada has been ripping us off for years on tariffs for lumber and for dairy products. 250% — nobody ever talks about that — 250% tariff — which is taking advantage of our farmers.

So that’s not going to happen anymore.

Trump went on to say that he may soon implement reciprocal tariffs on Canadian lumber and dairy products.

Back to Trump:

They’ll be met with the exact same tariff unless they drop it, and that’s what reciprocal means.

And we may do it as early as [last Friday], or we’ll wait till Monday or Tuesday, but that’s what we’re going to do. We’re going to charge the same thing. It’s not fair.

This brings up something we should wrestle with…

What “fair” means

If tariffs are placed on Canadian lumber and dairy, it will make those imports more expensive.

U.S. producers can take advantage by selling their goods at higher prices (though still lower than Canadian prices) without as much competition from cheaper Canadian products.

This is great for U.S. dairy and lumber manufacturers – not so great for the U.S. consumers who are now paying higher prices.

Is that fair?

Remember, the U.S. consumer is responsible for about 70% of our GDP. Meanwhile, my back-of-the-napkin calculation of the size of the U.S. dairy and lumber industries clocks in at less than 4% of our GDP.

Perhaps the better question isn’t “what is fair?” but rather “to whom do we want to be fair?”

The economic risk of “cutting off our nose to spite our face”

A leading political/economic theory holds that beneath Trump’s bluster, he’s using tariffs purely as a negotiating tool to force other countries to bring down their levies on U.S. exports.

If this is the case, great. Let’s use them selectively, briefly and then be done with it.

But as we noted in Friday’s Digest, the longer that Trump uses, or even threatens to use tariffs, the greater the risk of stagflation.

Trump’s on-again-off-again tariffs makes it difficult for corporate planners, so they’re pushing off capital investments and hiring decisions. This slows the economy and the velocity of money, threatening low/no-growth (i.e., the “stagnant” part of stagflation).

Trump appears unmoved by C-suite managers asking for clarity. Here’s CNBC from this morning:

President Donald Trump has dismissed the growing chorus of CEOs, investors and policymakers who are pleading with the White House for greater clarity about his sweeping tariff agenda.

“They always say that. ‘We want clarity,’” Trump said in a Fox News interview that aired Sunday.

“They have plenty of clarity.” 

As to the “inflation” part of stagflation, consumers appear to be increasingly worried about the impact of tariffs on prices.

Here’s the Federal Reserve Bank of Richmond last week:

In February 2025, households’ inflation expectations over the next 12 months rose for the third straight month. They now sit at 4.3 percent, which is the highest mark since November 2023…

Worryingly, longer-run inflation expectations rose to 3.5 percent in February, the highest mark in nearly 30 years (April 1995).

Inflation fears risk fueling the attitude of “buy it now before the price rises!” which, unfortunately, serves as a self-perpetuating feedback loop, creating the exact higher prices that are feared.

Meanwhile, there’s a lurking question…

What if Trump’s tariffs don’t prompt the desired foreign tariff reductions, but instead, stoke indignant tariff increases? (Which, so far, has been the case.)

Then we enter a game of economic “chicken” between Trump and foreign leaders with the respective economies as potential collateral damage.

Trump claims tariffs are already having the desired result, spurring new manufacturing jobs. From Trump:

We created almost 9,000 new jobs in the auto production field. And the reason for that is largely they think things are happening so they’re already geared up.

While this is great for the individuals who land those 9,000 new jobs, if the cost of that job creation is higher auto prices for the tens of millions of American consumers – and a recession – is that fair?

Bottom line: We’d love to see a more balanced trade deficit, but not if the cost is a recession and a bear market.

On that last note, as noted at the top of today’s Digest, the market is deep in the red as I write Monday near lunch. For investors hoping that Trump might see this and course correct, this appears unlikely.

Among his comments in recent days, Trump had the following to say about stocks:

Look, what I have to do is build a strong country. You can’t really watch the stock market.

If you look at China, they have a 100-year perspective. We go by quarters. And you can’t go by that.

Despite this, the chances of a bullish mean reversion rally are growing. We’re going to dive into that in tomorrow’s Digest.

But in the meantime, stick with your investment plan. That means abiding by your pre-appointed stop-losses…yet also looking for great buying opportunities that are on sale as other investors panic.

Crypto investors are feeling deflated

Last Friday, President Trump signed an executive order to create a Strategic Bitcoin Reserve. Funding this reserve will be Bitcoin seized in criminal and civil forfeiture cases.

The executive order also establishes a U.S. Digital Asset Stockpile which will hold other confiscated cryptocurrencies. In a post on Truth Social, President Trump wrote that this stockpile will include ether, XRP, Solana’s SOL token, and Cardano’s ADA token.

So, why isn’t the market more bullish?

Because many in the crypto community wanted a more ringing endorsement from the government.

Here’s TD Cowen’s Jaret Seiberg:

We view this as a compromise.

The government is not spending taxpayer dollars to acquire new digital assets. It is simply not selling the ones that it seizes …

We are dubious that government will be acquiring additional bitcoin for the reserve despite the President’s instructions as we believe it will be politically tough to show how purchases are budget neutral and do not impose incremental costs of taxpayers.

To clarify, Trump’s order keeps open the possibility of the government buying Bitcoin. However, according to a factsheet from the White House, such purchases must be “budget-neutral” and “impose no incremental costs on American taxpayers.”

With the market now recognizing that the U.S. government isn’t about to go on a Bitcoin shopping spree, this leaves Bitcoin lacking a new bullish catalyst.

This gives bears room to drive Bitcoin lower, which they’re doing. As I write, the crypto is struggling to hold $80,000.

Chart of Bitcoin struggling to hold $80K

Source: TradingView

From a technical perspective, we’re nearing a “must hold” level

Last week, when Bitcoin traded below $85,000, our crypto expert Luke Lango wrote the following to his Crypto Trader subscribers:

Right now, Bitcoin is caught between two major technical levels:

  • It’s holding its 50-week moving average—historically, the final line of defense in past boom cycles.
  • It has lost its 25-week moving average—a warning sign seen before previous tops.

If Bitcoin reclaims $85,000, the bull market could surge back with a vengeance.

If Bitcoin breaks below $75,000, it could signal the start of a new crypto winter.

Since then, Bitcoin briefly retook $85,000, but as just noted, it’s now threatening to lose $80,000.

For now, Luke recommends just watching. This is neither the time to bail or buy. As he writes to his subscribers, “we’ll let the market tell us what’s next.”

To join Luke in Crypto Trader for timely updates as well as the specific altcoins he’ll recommend if/when bullish spirits return, click here.

Finally, there’s some trash talk breaking out between the AI big dogs

In February, Microsoft announced it created a new state of matter (as Big Tech races toward creating quantum computing).

Amazon isn’t having it.

From Quartz:

Amazon’s head of quantum technologies, Simone Severini, told chief executive Andy Jassy that the company’s scientific paper “doesn’t actually demonstrate” its claims — only that the new chip “could potentially enable future experiments,” Business Insider reported, citing a copy of Severini’s email obtained by the publication.

Severini also reportedly told Jassy that Microsoft has had “several retracted papers due to scientific misconduct” in quantum computing, and that the company has previously had to withdraw some of its research.

To be fair, Amazon isn’t an impartial bystander. It’s also pursuing quantum computing leadership.

Here’s legendary investor Louis Navellier with more details:

Amazon made its own splash with the Ocelot quantum chip on February 27.

This experimental model uses five “cat qubits,” a newer qubit technology that stores quantum information inside a microwave cavity, rather than on superconducting circuit as a transmon qubit does.

Its feline name comes from the famous Schrödinger cat, a thought experiment suggesting a cat in a box can be both dead and alive until someone looks inside. Cat qubits store information in a similarly confusing quantum state.

I must emphasize that cat qubits are still experimental… and they’re not guaranteed to work at larger scales.

But their potential is enormous.

If this all reads like Greek, don’t worry. We’re not about to dive into the details of quantum physics. But there is a budding investment opportunity emerging in quantum computing that’s important to highlight.

As we’ve been covering in the Digest over the last few days, this Thursday at 1 PM Eastern, Louis is holding an exclusive briefing: The Next 50X NVIDIA Call.

He’s going to dive into why quantum computing is an AI gamechanger on a scale we haven’t seen yet – both from a technological and wealth-building perspective.

He’ll also tell you more about his top quantum pick; it’s a small-cap stock protected by 102 patents with close ties to NVIDIA.

Now, we should quickly answer an obvious question – with NVIDIA being mentioned, why not just invest in it to ride quantum computing?

Well, Louis is doing that. But not just that.

Here he is explaining:

Chipmakers like Nvidia Corp. (NVDA) know that quantum computing is an existential threat to [chipmakers’] dominance. Traditional electricity-based chips have trouble with complex tasks like 3D modeling and encryption. Quantum chips might solve these problems in the blink of an eye.

That’s why firms like Nvidia are quietly funneling billions of dollars into quantum computing startups. They realize they can’t afford to miss out on the world’s next greatest technology.

On Thursday, Louis will dive into all these details, as well as prep you for NVIDIA’s first ever “Quantum Day,” or “Q Day,” as Louis calls it.

Q-Day comes one week from Thursday on March 20. Here’s Louis with the significance:

At that event, Nvidia is poised to ignite the next phase of the quantum investing cycle.

I expect them to announce a new breakthrough technology that could light a fire under the shares of one of its “Q” partners… a stock 1,000 times smaller than Nvidia.

To tell you all about it, I’m hosting an urgent video briefing on Thursday, March 13, at 1 p.m. ET… exactly one week before Nvidia’s announcement… because I want to get you ahead of the crowd.

To join Louis, click here to register.

We’ll keep you updated on all these stories here in the Digest.

Have a good evening,

Jeff Remsburg


Source link

Copyright © 2023 | Powered by WordPress | Coin Market Theme by A WP Life