Sustainable Finance Awards 2025: Global And Country Winners


A record year for sustainable bonds, but is the global compact cracking?

For sustainable finance, 2024 was the best of times and the worst of times.

On the positive side, issuance of impact bonds, sometimes called “GSS+” bonds (green, social, sustainability, and sustainability-linked instruments) totaled $1.1 trillion, according to provisional data published by the Climate Bond Initiative (CBI) in January.

However, on the red side of the ledger, the global coalition to contain climate change seemed to be fracturing by the end of the year. The 2024 US presidential elections brought to power the new Donald Trump administration; and Trump immediately ordered US withdrawal from the Paris Agreement, the world’s main treaty to fight climate change.

Given the need to more than double spending on clean energy supply, storage, and grid infrastructure to $300 billion/year for developing countries and $1.3 trillion/year for developed countries by 2035 “to keep the 1.5 target alive” (to achieve the goal of limiting global warming to an increase of no more than 1.5°C), “2024 failed to live up to what is needed,” says Gregor Vulturius, lead scientist and senior adviser on climate and sustainable finance at SEB.

Many market observers, however, still see the glass half full—especially looking beyond North America. “The outlook for 2025 is growth in sustainable finance,” says Timothy Rahill, a credit strategist at ING (Netherlands). “We ended 2024 with an increase over 2023. Of course, in 2021 and 2022, the levels of sustainable-finance issuance were very high, and outliers in the initial rush to do green issuance.”

According to CBI’s preliminary numbers, green bonds dominated in 2024, accounting for approximately 61% of the $1.1 trillion GSS+ debt accrued that year, compared with social and sustainability bonds (34%) and sustainability-linked bonds (1%).

Rahill explains that the EU’s Green Bond Standard (GBS), which took effect in December, should eventually push green bonds further. The standard aims to boost investor confidence by setting “a clear gold standard for green bonds” in the EU.

Still, “Many other issuers, such as sovereigns, view the rigorous new requirements [of the GBS] as a significant hurdle,” according to a late-January blog post by global investment firm Franklin Templeton. “They will likely adopt a wait-and-see approach to understand all potential implications before committing to issuing a [European green bond].”

According to Moody’s Ratings, overall bond issuance soared 35% in 2024, while sustainable bonds remained flat; and the latter’s share of the overall bond market fell from 15% in 2023 and 2022 to 11% in 2024.

However, Rahill predicts that in 2025, “Issuers will return their focus to green/sustainable finance issuance.” Moody’s mostly agrees, anticipating new green bond volumes rising to about $620 billion, 2% more than in 2024, “but eclipsing the previous record of $617 billion in 2021.”

Globally, “Social bonds will be constrained by a lack of benchmark-sized projects, while transition-labeled bonds and sustainability-linked bonds (SLBs) will remain niche segments as they navigate evolving market sentiment,” the ratings agency posted on its website.

For sustainable bonds, “Market conditions will remain the same as 2024,” says SEB’s Vulturius, who predicts growth of around 10%. According to SEB’s data, 2024 saw approximately $1.2 trillion in new sustainable bonds versus roughly $1.1 trillion in 2021, the previous record year, though SEB’s numbers, like CBI’s, are still preliminary.

What about the new administration in Washington, D.C.?

“I don’t expect the sustainable finance market will see a major headwind with the Trump administration. I still think we will see growth in 2025, even in US dollar debt,” says Rahill, though some corporations may not commit until the second quarter.

The CBI identified several factors that will encourage issuance in 2025, including new taxonomic definitions and increased spending by governments, development banks, and corporations on efforts at climate change impact adaptation and resilience. The CBI also expects increased visibility from insurance companies regarding sustainable finance in 2025.

Institutions focusing on sustainable finance in its various forms will have plenty to keep them busy in 2025. With that in mind, Global Finance presents its fifth annual Sustainable Finance Awards, with winners from seven regions and 53 countries, territories, and districts; and global honorees in 14 categories.

Methodology: Behind the Rankings

Global and regional awards require submissions detailing hard metrics of ESG activity, such as year-over-year growth in sustainable finance transactions or sustainable financial instruments as a percentage of total portfolio. Softer metrics also required include goal alignment with leading ESG norms or innovative product development. Entries were not required for country awards, which were judged by the editorial team’s independent research. Evaluation criteria includes governance policies and goals, environmental and social sustainability financing achievements, industry leadership, and third-party assessments. This awards program covers activities from January 2024 to December 2024. There was no fee to enter.


World’s Best Bank for Sustainable Finance: DBS

DBS is striving to green Asia’s economy by acting as an environmental-transition catalyst for anchor companies, mid-caps, and small and midsize enterprises (SMEs). The bank provides transition-related financing for these organizations at the corporate, project, and asset level. Among these offerings are green, sustainability-linked, and social loans and bonds, along with carbon-market financing and other products.

Standout transactions in 2024 include a loan to LG Energy to construct a plant in Poland for the manufacture of batteries used in electric vehicles. A 3 billion Hong Kong dollar (about $385.7 million) loan to the Hong Kong Housing Society will help create affordable residential projects. A 300 million Singapore dollar (about $224.2 million) bond will help the Singaporean developer CapitaLand build projects in alignment with green finance frameworks. In addition, the bank develops analytical tools to track and analyze climate data. It engages with industries (notably in the power, automotive, steel, shipping, real estate, and automotive sectors) and policy makers to chart paths to a healthier environment.       —Laura Spinale

Sustainable Finance Deal of the Year: CTBC (Project Trinity/Offshore Wind)

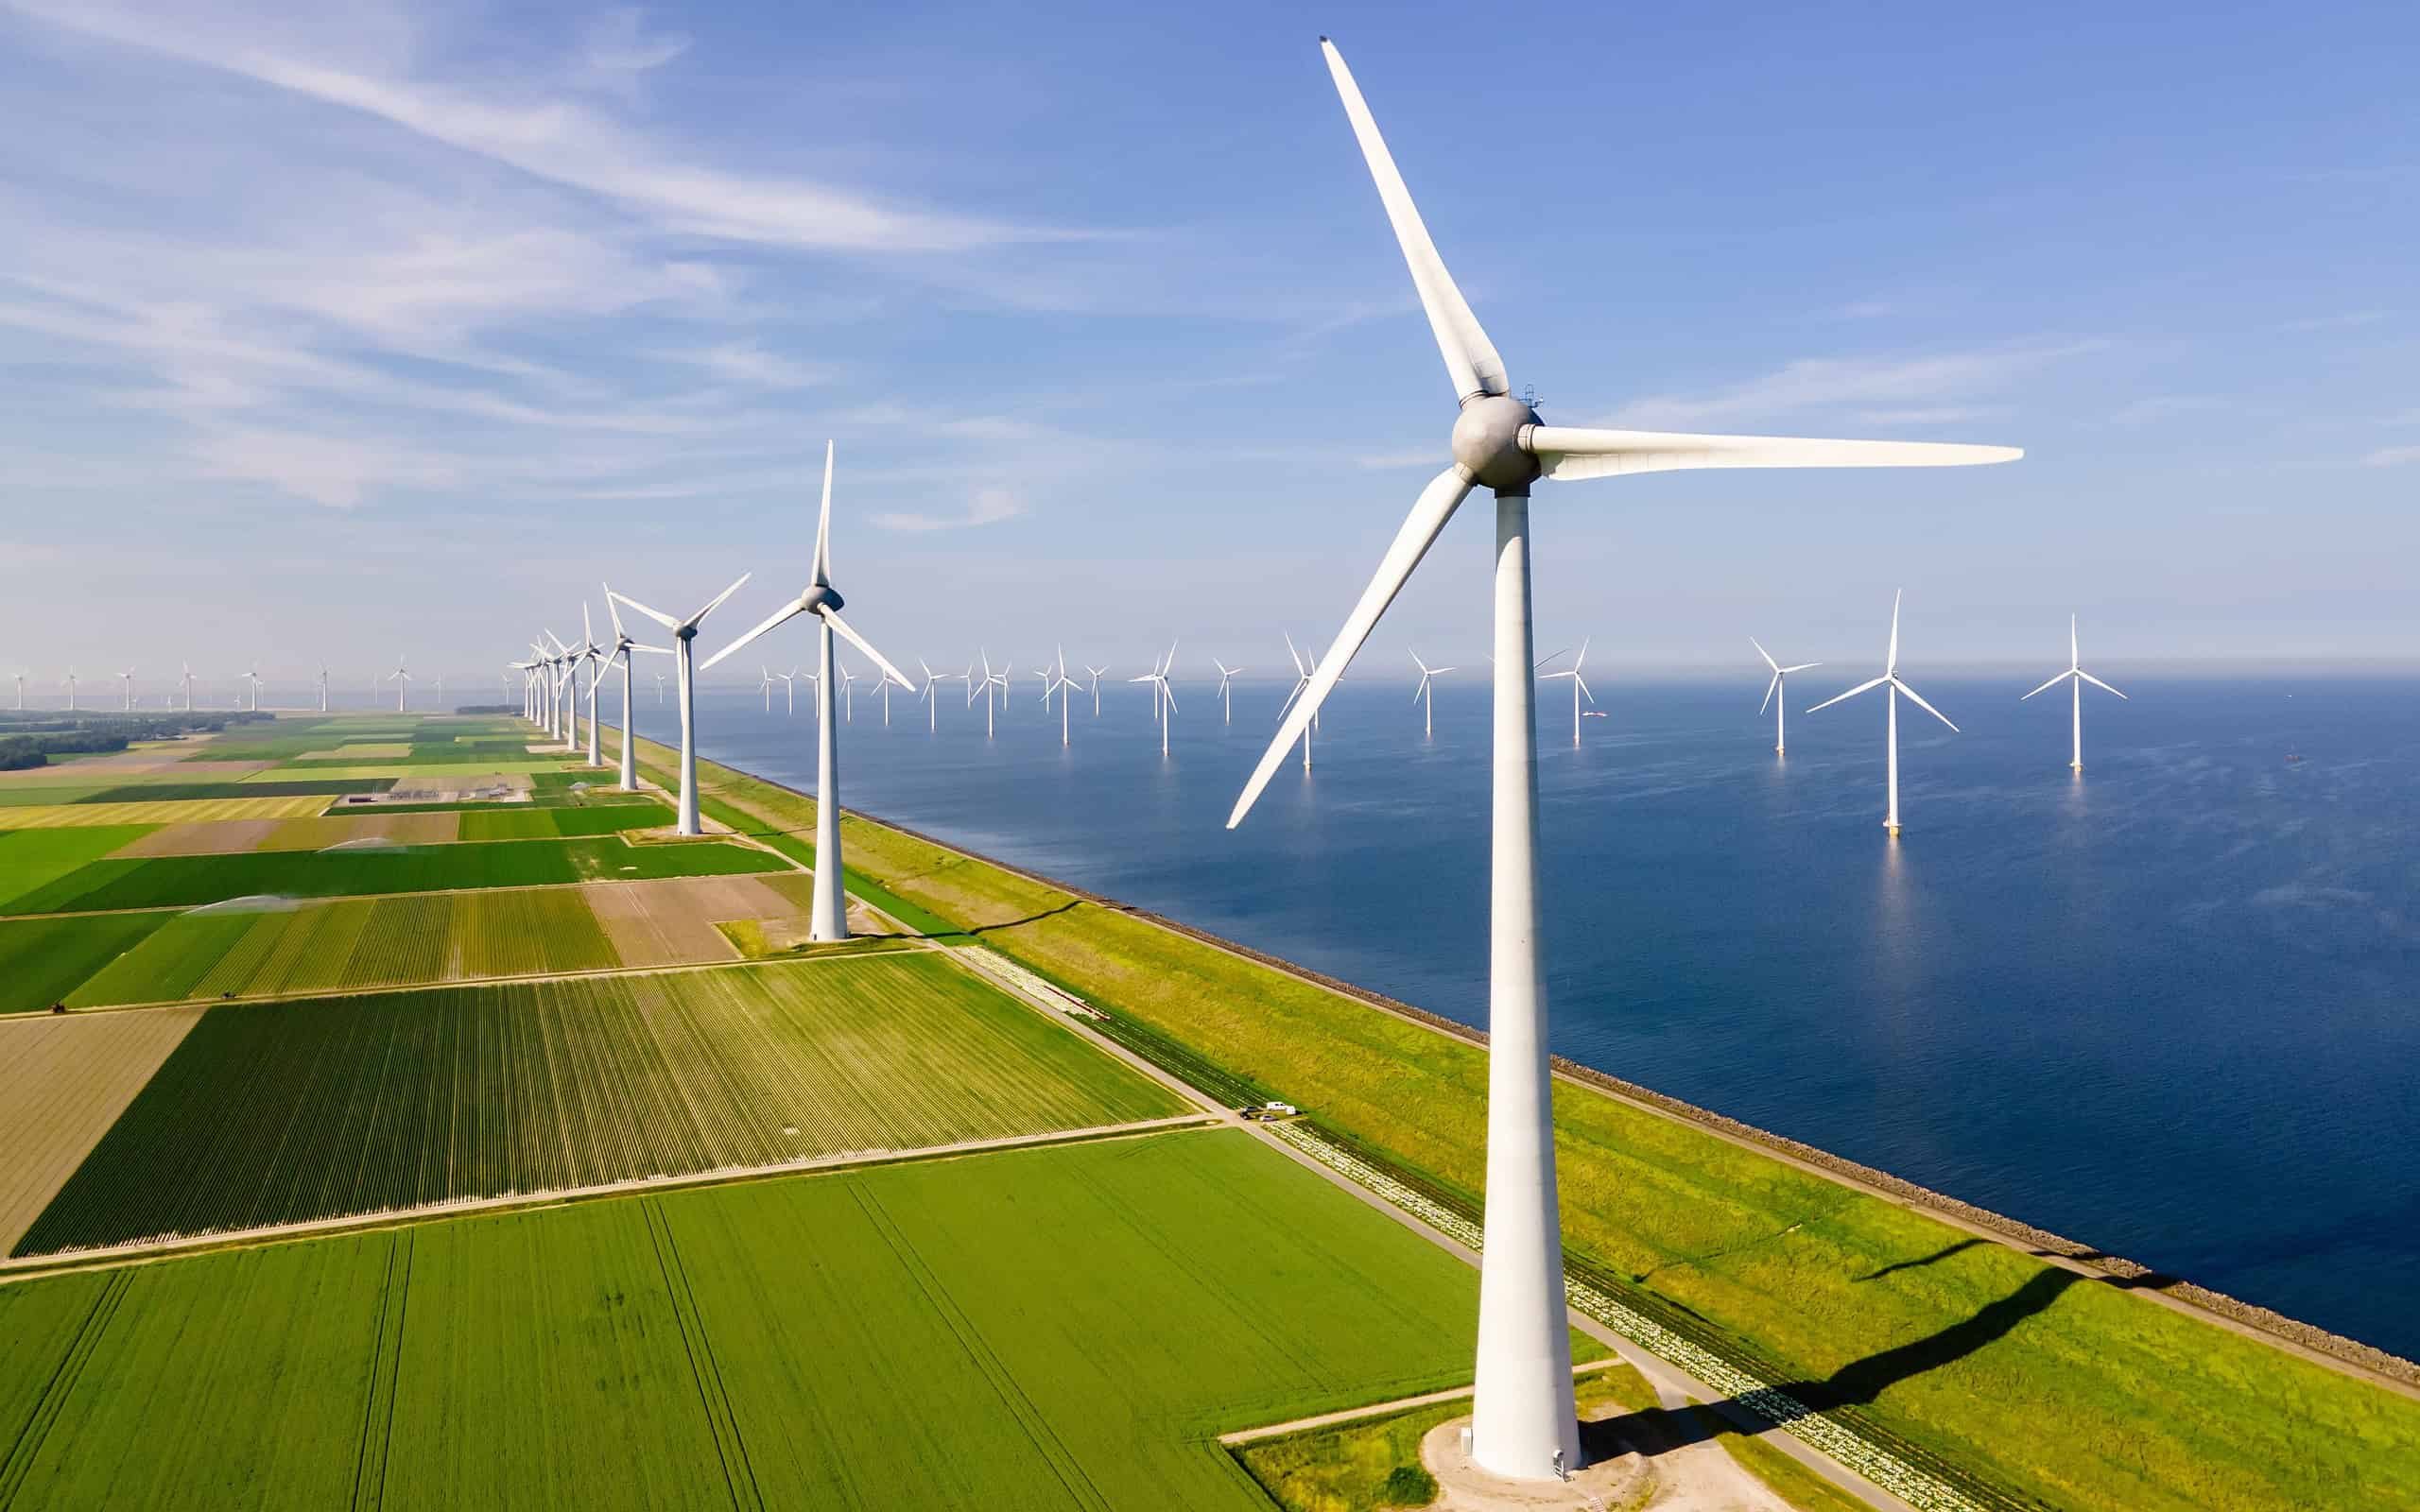
Seeking to help Taiwan transition to a greener economy, CTBC Bank is working with Ørsted, the world’s largest developer of offshore wind-power projects, for the construction of the 61.3 billion Taiwan dollar (about $1.9 billion) Project Trinity.

This project consists of two offshore wind farms with turbines designed to withstand typhoons, seismic activity, and other ecological vagaries. Slated to be operational by the end of 2026, the farms—named Greater Changhua 2b and Greater Changhua 4—will generate 337 MW and 583 MW of electricity, respectively. This is enough to power roughly a million Taiwanese households.

CTBC Bank acted as mandated lead arranger and bookrunner for this syndicated loan. In that capacity, it identified and recruited potential lenders and other partners. These include Cathay Life Insurance, Taiwan’s largest insurance company. Project Trinity marked Cathay’s debut investment in Taiwan’s offshore wind market. CTBC Bank also recruited Taiwan’s National Credit Guarantee Administration to act as local export credit agency for the loan package.       —LS

Best Impact Investing Solution: BTG Pactual

Brazilian-headquartered BTG Pactual has been actively expanding its sustainable funding and transactions that have environmental and social benefits. This includes developing and managing new funds with strong sustainability and impact guidelines for financial products available in local markets.

BTG Pactual raised 542 million Brazilian reais (about $95.3 million) in its impact investing fund, which achieves social and environmental benefits with strong financial returns. The fund invests in small and midsize enterprises through private equity, focusing on educational technology for low-income populations, agribusiness software, alternatives to plastic packaging, and sustainable practices within the Brazilian açaí palm chain.

The bank has also focused on reforestation efforts through its Timberland Investment Group (TIG) subsidiary, which launched in 2021 and has raised $500 million toward its $1 billion target. The group wants to restore about 133,000 hectares (about 328,650 acres) of natural forest and establish sustainable commercial tree farms on an additional 133,000 hectares. As of the first quarter of 2024, TIG had $6.9 billion in assets and commitments and nearly 3 million acres under management throughout the US and Latin America.         —Andrea Murad

Best Platform/Technology Facilitating Sustainable Finance (Non-Bank): China Central Depository & Clearing Co.

China Central Depository & Clearing Co. (CCDC) is a state-funded financial institution responsible for the custody, registration, and settlement of fixed-income securities in China. It functions as an important operations platform for the bond market, a supporting platform for the implementation of macroeconomic policies, a benchmark-services platform, and a key gateway for the opening up of China’s bond market. For example, CCDC provides issuance, registration, depository, settlement, valuation, collateral management, and information-disclosure services for green bonds, social responsibility bonds, and other sustainable finance products.

Its services can help issuers improve information-disclosure transparency and assist investors in identifying sustainable financial products. CCDC also promotes sustainable investment philosophy and otherwise contributes to the development of sustainable finance in China. As part of this work, it develops sustainable development-related indices, including China’s first green bond index, and has developed new standards for ESG evaluation.

—LS

Circular Economy Commitment Award: Nordea

The circular economy is about reusing, repairing, and recycling products and materials instead of simply disposing of them. Pulp and paper technologies provider Valmet has embraced circular economic principles in a big way. It’s now upgrading and extending the lifetime of its machines. The company has learned that modular machine design and smart engineering can often enable the same equipment’s use for other purposes. Valmet is also maximizing the use of recycled metals, reusing metals in its foundries.

Finland’s Nordea was the sole sustainability structuring adviser in Valmet’s March 2024 €200 million (about $206 million) green bond offering, making it easier for Valmet’s customers to manufacture sustainable products from renewable resources in the high-emissions pulp and paper industry. All eligible expenditures from the financing are aligned with the EU Taxonomy Regulation section 5.1 under transition to a circular economy.

—Andrew Singer

Best Bank for Green Bonds: Raiffesen Bank International

Raiffeisen Bank International (RBI) has long been considered a pioneer in green bond issuance in its native Austria. In 2018, it rolled out its green bond program aimed at encouraging sustainable lending across the RBI network of 11 Central and Eastern European (CEE) markets. Along with other banks, it participated last June as bookkeeper for Czech power company CEZ’s second green and sustainability-linked bond issue, worth €750 million ($772 million). The 4.25% bonds are due in 2032 and will be listed on the main market of the Luxembourg Stock Exchange. “With a total outstanding volume of [€2 billion] across 21 bonds in five currencies in Austria as of December 2023, RBI is the largest green bond issuer among financial institutions in the country and a regular issuer of green bonds on the international capital markets and in the retail segment in Austria and CEE,” proclaims the bank in its Green Bond Allocation and Impact Report 2024.

RBI has also developed a Sustainability Bond Framework to facilitate the issue of sustainable bonds. The bank works closely with clients in countries across the region to determine their needs and long-term environmental goals and tailor any forthcoming environmental, social, and governance (ESG) loans accordingly. In total, ESG loans to corporates over 2024 grew some 14% to €8 billion after a 16% increase in 2023 to €7 billion.    —Justin Keay

Best Bank for Social Bonds: Akbank

Akbank issued its first social bonds in 2022, and they have since proven to be suitable for its general bond issuance strategy. The bank issued some 770 million Turkish lira ($21.4 million) in domestic social bonds from 2022 to the end of 2023. The bonds incorporate three main pillars—environmental, technological, and social—that are aligned with Akbank’s Sustainable Finance Framework. The social pillar focuses on financing products and services to improve the health and well-being of communities in underdeveloped regions, facilitate equal opportunity, and generate employment, particularly among less-represented groups.

The bank has complemented its program of social bond issuance with a program of social loans. In 2023, in the wake of the devastating Feb. 6 earthquake that hit Turkey, Akbank announced the country’s first syndicated social loan, some $500 million in support of the Turkish economy, with a 367-day maturity. Thirty banks from 16 countries participated in this syndicated social loan, which was a first in Turkey.        —JK

Best Bank for Sustainable Bonds: BPI

Bank of the Philippine Islands (BPI) in 2024 issued and listed peso-denominated, fixed-rate, sustainable, environmental and equitable development bonds (SEED bonds) totaling nearly 34 billion Philippine pesos (about $587 million). The SEED bonds represent the bank’s largest thematic issuance to date. Proceeds will fund renewable energy, pollution prevention, and sustainable agriculture projects. They will further finance socioeconomic development activities, such as providing access to essential services for poverty-stricken communities.

The bank also served as a joint lead underwriter and bookrunner for Ayala Land’s 6 billion Philippine peso sustainability bond. Ayala Land is one of the largest property developers in the Philippines, and bond proceeds will be used by the company to implement energy and water-saving measures across its real estate portfolio. These measures include energy-efficient cooling systems and water harvesting/recycling systems. These and other activities bolster the bank’s goal of creating a 1 trillion Philippine peso corporate and SME portfolio supporting the UN Sustainable Development Goals. It hopes to reach that milestone by 2026.         —LS

Best Bank for Sustaining Communities: CaixaBank

CaixaBank has long been a global leader in microfinance, social bonds, and support for local communities.

The bank’s commitment was tested in October 2024, when record-breaking rainfall and flash floods battered Spain, causing casualties, massive disruptions, and economic losses, especially in the Valencia region. Caixa responded by opening a line of credit worth more than €2.5 billion for companies affected by the catastrophic weather. The bank also allowed commission-free cash withdrawals for customers with cards from other banks, for seven days, at the 785 ATMs it operates in Valencia.

In the first half of 2024, Caixa dedicated €1.08 billion to financing projects that positively impact local communities. This included its Velindre project, helping to fund the design, construction, and operation of an oncological hospital center in Wales. The bank also focused in 2024 on loans to finance projects linked to affordable housing, education, health, social and economic inclusion, and support for small and midsize enterprises in the Madrid area. —AS

Best Bank for Sustainability Transparency: Scotiabank

Scotiabank’s goals are guided by its motto: “for every future.” This wholesale bank operates in the Americas and focuses on advancing the climate transition and promoting sustainable economic growth.

The bank’s enterprise-wide goals address climate risks by financing solutions for clients in carbon-intensive sectors, advancing net-zero initiatives to reduce emissions, and reducing its own emissions. Scotia’s Climate-Related Finance Framework outlines products and services that meet the bank’s goal of providing 350 billion Canadian dollars (about $246.2 billion) in climate-related finance by 2030.

Scotia’s credit due diligence processes address environmental and climate-related risks across its lending portfolio and are integrated into its credit-risk policies. Scotia Global Asset Management has adopted sustainable investment policies and publishes annual investment transparency reports.

In its Risk Appetite Framework, Scotia uses ESG performance metrics that are also included in its annual industry review process. The climate change risk assessment evaluates physical and transition risks and a client’s awareness of climate risks as a measure of management quality. —AM

Best Bank for Sustainable Financing in Emerging Markets: Maybank

Based in Malaysia, and one of the largest lending banks in Southeast Asia, Maybank is committed to serving the emerging markets in the 20 countries in which it operates. Here are some examples: In Indonesia, the bank has embarked on a social financing program to empower disadvantaged women and support growth through its partnership with Permodalan Nasional Madani. This microfinance company, focusing on women in its work with Maybank, strives to enhance the general welfare by supporting small entrepreneurs’ access to capital, mentorship, and capacity-building programs. Understanding that a healthy environment is key to any business’ success, Maybank is working with BenihBaik.com to support the construction of organic waste facilities in three cities in Bali. These waste management facilities will provide a cleaner environment for residents while also engaging in bioconversion processes that use living organisms to transform waste into substances such as methane that can later be used in energy production.           —LS

Best Bank for Transition/Sustainability-Linked Loans: OTP Bank

OTP Bank, formerly owned by the Hungarian state, now operates across 12 CEE countries. It continues to prioritize ESG targets in all its operations and is a leader in transition/sustainability-linked loan issuance. Such loans typically incorporate ESG criteria into the loan terms. Companies that meet or exceed predefined ESG performance targets may benefit from reduced interest rates, incentivizing sustainable practices. Conversely, failing to meet these targets may result in higher interest rates, thus ensuring a strong commitment to sustainability.

Green loans to corporates (including ESG-related loans) rose 38% year on year (YoY) in the third-quarter of 2024 (over Q3 2023), while retail loans rose 17% YoY. Green loans to corporates constitute around 6% of overall loans, to retail around 1.4%. In 2024, ESG financing as a proportion of the total for OTP reached 3.7%, more than double the 1.7% reached in 2023. According to Sustainalytics’ July 2024 report, “€1.26 billion have been allocated in the categories renewable energy, green buildings, and clean transportation, with projects located in Albania, Bulgaria, Croatia, Hungary, Romania, Serbia, and Slovenia.”         —JK

Best Bank for Sustainable Infrastructure/Project Finance: Societe Generale

The sustainable infrastructure finance work of Societe Generale (SocGen) includes acting as initial coordinating lead arranger and joint bookrunner for the $8.8 billion SunZia Wind and Transmission project. The project consists of a 3.5 GW wind farm in New Mexico, along with a 550-mile transmission line to deliver this clean energy to Arizona. In Europe, SocGen served as senior mandated lead arranger for €4.2 billion (about $4.4 billion) in financing earmarked for the construction of a large-scale facility to produce green steel. Associated financing will fund the construction of a water treatment plant to supply the demineralized water necessary for green steel manufacturing. Among SocGen’s ESG-related loans are €2.6 billion in financing for the Fècamp 497 MW offshore wind farm in France. SocGen also acted as sole structuring bank for ReNew Power’s 600 MW, 35 billion Japanese yen (about $233.2 million), solar project in India; and as sole mandated lead arranger for nearly 11 billion Japanese yen in funding for Shizen Energy’s Kyushu (Japan) solar power plant.   

Global Winners
World’s Best Bank for Sustainable Finance DBS
Sustainable Finance Deal of the Year CTBC (Project Trinity/Offshore Wind)
Best Impact Investing Solution New for 2025 BTG Pactual
Best Platform/Technology Facilitating Sustainable Finance (Non-Bank) New for 2025 China Central
Depository & Clearing Co.
Circular Economy Commitment Award New for 2025 Nordea
Best Bank for Green Bonds Raiffeisen Bank International
Best Bank for Social Bonds Akbank
Best Bank for Sustainable Bonds BPI
Best Bank for Sustaining Communities CaixaBank
Best Bank for Sustainability Transparency Scotiabank
Best Bank for Sustainable
Infrastructure/Project Finance
Societe Generale
Best Bank for Sustainable
Financing in Emerging Markets
Maybank
Best Bank for Transition/Sustainability- Linked Loans OTP Bank
Best Bank for ESG-Related Loans Societe Generale
Country, Territory, And District Winners
AFRICA 
Djibouti iib East Africa
Egypt CIB
Ghana Ecobank
Kenya Absa
Nigeria Bank of Industry (BOI)
South Africa Nedbank
ASIA-PACIFIC
China DBS
Hong Kong OCBC
India Aseem Infrastructure Finance
Indonesia Maybank
Japan Morgan Stanley Japan
Malaysia Maybank Malaysia
South Africa Nedbank
Philippines BPI
Singapore UOB
South Korea Industrial Bank of Korea
Thailand Bangkok Bank
Vietnam SHB
CENTRAL & EASTERN EUROPE
Armenia Ameriabank
Czech Republic CSOB
Hungary OTP Bank
Moldova MAIB
Poland Bank Pekao
Turkey Akbank
LATIN AMERICA
Brazil BTG Pactual
Chile Scotiabank
Colombia Banco Davivienda
Dominican Republic Banco Popular Dominicano
Mexico Banamex
MIDDLE EAST
Bahrain Arab Bank
Jordan Arab Bank
Kuwait National Bank of Kuwait
Qatar QNB
Saudi Arabia SAB
UAE Emirates NBD
NORTH AMERICA
Canada  Scotiabank
United States  Bank of America
WESTERN EUROPE
Austria Erste Bank
Belgium KBC Group
Denmark Nordea
Finland Nordea
France BNP Paribas
Germany Commerzbank
Greece Eurobank
Italy UniCredit
Luxembourg Spuerkeess
Netherlands ING
Norway Nordea
Portugal Millennium BCP
Spain BBVA
Sweden SEB Bank
Switzerland ING
UK HSBC


Source link

Dogecoin’s Momentum Slows While This Rising Crypto Gains 244x in Days


​Dogecoin (DOGE) has shown a weakened price action and is now stagnating after falling 36.59% over the past month. This comes despite Bitcoin (BTC) and the overall crypto market clawing its way back up after the broader market decline.

Interestingly, analysts say this weakening Dogecoin (DOGE) is due to a sentimental shift in the crypto market that will create a 24,400% profit opportunity elsewhere in the altcoin sector.

As investors prepare for another utility-altcoin-focused bull run, analysts say the Dogecoin (DOGE) will be sidelined, while new utility altcoins with disruptive potential like RCO Finance (RCOF) will explode 244x, outperforming the crypto market by Q2.

Dogecoin (DOGE) To Continue its Slump While Utility Altcoins Soar

The Dogecoin price at $0.2077 today is down over the past day (1.25%), week (15.68%), and month (36.59%), signifying just how brutal the recent market decline was. 

However, while other cryptos continue their slow and steady march back up to their January highs, Dogecoin (DOGE) is set to continue falling or stagnate despite another market rally.

According to analysts, this will happen because of a major shift in investor sentiment happening as we speak. Instead of backing on hype-driven meme coins like Dogecoin (DOGE), investors are preparing for a bull run similar to the Q4 market rally that saw utility altcoin prices skyrocket from government and institutional demand.

But what’s even more interesting is that regarding the best altcoin to buy now, forward-thinking investors are ignoring established utility cryptos like Ethereum (ETH), Solana (SOL), and Ripple (XRP) in favor of RCO Finance (RCOF), a new token with a 24,400% growth potential in three months.

Fueling the bullish projections for RCO Finance (RCOF) are not only its game-changing AI trading bot and DeFi trading platform but also the coming wave of altcoin season, RCOF’s low entry price, and the boom in artificial intelligence investments.

Bear Market Whales Are Silently Accumulating, But RCO Finance Ensures You Never Miss Out?

While retail traders panic in bear markets, institutional players and whales are silently accumulating discounted assets. The problem? These moves are often hidden beneath layers of trading volume and on-chain transactions, making it difficult for the average trader to spot the accumulation phase and capitalize before prices surge again.

Picture this: months of declining prices have left you hesitant to buy. Then, out of nowhere, your favourite token jumps 80% in a single week. You missed it. Again. Whales were quietly accumulating, and now you’re forced to buy at inflated prices or sit on the sidelines while others profit.

The frustration of missing the early accumulation phase is something many traders know too well. However, RCO Finance (RCOF) is about to change that with its AI Robo Advisor that deciphers whale behaviour, using advanced blockchain analytics to track institutional and large-wallet movements in real time.

Unlike human traders, who rely on fragmented information and social media speculation, AI-driven algorithms spot subtle accumulation patterns long before a price breakout.

For example, when Shiba Inu (SHIB) shows unusual spikes in large wallet transfers while overall sentiment remains negative, the Robo Advisor recognizes this as a strategic accumulation phase rather than just a temporary price fluctuation. The Robo Advisor issues an alert or automatically executes a buy order, ensuring users enter the trade before the crowd catches on.

Similarly, consider a hypothetical coin called Layer1Gem, which suffered from sell-offs but continues to see developer engagement and rising total value locked (TVL). RCO Finance’s AI Robo Advisor cross-references these metrics with historical accumulation patterns, signaling that smart money is positioning itself.

This insight allows traders to buy confidently before the eventual recovery. By detecting whale movements before the masses, RCO Finance puts retail traders on equal footing with institutions, giving them access to the same early opportunities that define long-term winners.

The interesting part is this isn’t some distant future; it’s already a reality that over 10,000 RCOF holders are testing out on the Beta Platform.

And it’s not just cryptocurrencies; RCO Finance (RCOF) gives users access to capitalize on over 120,000 assets in over 12,000 categories, making it one of the best DeFi platforms to launch in recent years.

RCOF Presale: A Rare 435x Profit Opportunity Emerges as Dogecoin Slows

Meme-driven coins like Dogecoin (DOGE) may have their moment in the spotlight, but hype alone doesn’t build lasting value. RCO Finance (RCOF) takes a different path. Designed for sustained growth, this presale-stage altcoin is packed with real utility, giving it far more potential than speculative tokens already trading on short-lived narratives.

RCOF is entering the market at the perfect time. With AI-powered financial tools gaining traction and a potential bull run on the horizon, this project is positioned for serious momentum. The AI sector alone is projected to reach trillions in value, and the SolidProof-audited RCO Finance is leading the charge by making expert-level investing accessible through automation.

Market projections are overwhelmingly bullish, with some estimates forecasting gains of up to 43,500%. At the current RCOF presale price, a simple $850 investment could grow into an astonishing $369,750, an opportunity that rarely comes around.

The buzz around RCOF is growing fast. Investors are rushing in, recognizing that this combination of AI utility, early-stage pricing, and market timing is a recipe for massive returns. As presale tokens sell out at record speed, it’s clear that this window of opportunity won’t stay open for long.

Round 5 is your last chance to grab RCOF at its lowest price of $0.01. Once this phase ends, the cost will rise, and so will the barrier to maximizing profits. Time is running out. Secure your RCOF tokens now and position yourself at the forefront of AI-driven investing before it’s too late.

For more information about the RCO Finance Presale:

Visit RCO Finance Presale

Join The RCO Finance Community

Disclaimer: The views and opinions presented in this article do not necessarily reflect the views of CoinCheckup. The content of this article should not be considered as investment advice. Always do your own research before deciding to buy, sell or transfer any crypto assets. Past returns do not always guarantee future profits.


Source link

2025 Dividend Kings List | Updated Daily


Updated on March 4th, 2025 by Bob Ciura
Spreadsheet data updated daily

The Dividend Kings are the best-of-the-best in dividend longevity.

What is a Dividend King? A stock with 50 or more consecutive years of dividend increases.

The downloadable Dividend Kings Spreadsheet List below contains the following for each stock in the index among other important investing metrics:

  • Payout ratio
  • Dividend yield
  • Price-to-earnings ratio

You can see the full downloadable spreadsheet of all 54 Dividend Kings (along with important financial metrics such as dividend yields, payout ratios, and price-to-earnings ratios) by clicking on the link below:


The Dividend Kings list includes recent additions such as Automatic Data Processing (ADP), Consolidated Edison (ED), and Kenvue (KVUE).

Each Dividend King satisfies the primary requirement to be a Dividend Aristocrat (25 years of consecutive dividend increases) twice over.

Not all Dividend Kings are Dividend Aristocrats.

This unexpected result is because the ‘only’ requirement to be a Dividend Kings is 50+ years of rising dividends.

On the other hand, Dividend Aristocrats must have 25+ years of rising dividends, be a member of the S&P 500 Index, and meet certain minimum size and liquidity requirements.

Table of Contents

How To Use The Dividend Kings List to Find Dividend Stock Ideas

The Dividend Kings list is a great place to find dividend stock ideas. However, not all the stocks in the Dividend Kings list make a great investment at any given time.

Some stocks might be overvalued. Conversely, some might be undervalued – making great long-term holdings for dividend growth investors.

For those unfamiliar with Microsoft Excel, the following walk-through shows how to filter the Dividend Kings list for the stocks with the most attractive valuation based on the price-to-earnings ratio.

Step 1: Download the Dividend Kings Excel Spreadsheet.

Step 2: Follow the steps in the instructional video below. Note that we screen for price-to-earnings ratios of 15 or below in the video. You can choose any threshold that best defines ‘value’ for you.

Dividend Kings PE ScreenDividend Kings PE Screen

Alternatively, following the instructions above and filtering for higher dividend yield Dividend Kings (yields of 2% or 3% or higher) will show stocks with 50+ years of rising dividends and above-average dividend yields.

Looking for businesses that have a long history of dividend increases isn’t a perfect way to identify stocks that will increase their dividends every year in the future, but there is considerable consistency in the Dividend Kings.

The 5 Best Dividend Kings Today

The following 5 stocks are our top-ranked Dividend Kings today, based on expected annual returns over the next 5 years. Stocks are ranked in order of lowest to highest expected annual returns.

Total returns include a combination of future earnings-per-share growth, dividends, and any changes in the P/E multiple.

Dividend King #5: PepsiCo Inc. (PEP)

  • 5-Year Annual Expected Returns: 14.7%

PepsiCo is a global food and beverage company. Its products include Pepsi, Mountain Dew, Frito-Lay chips, Gatorade, Tropicana orange juice and Quaker foods.

Its business is split roughly 60-40 in terms of food and beverage revenue. It is also balanced geographically between the U.S. and the rest of the world.

Source: Investor Presentation

On February 4th, 2025, PepsiCo announced that it would increase its annualized dividend by 5.0% to $5.69 starting with the payment that was made in June 2025, extending the company’s dividend growth streak to 53 consecutive years.

That same day, PepsiCo announced fourth quarter and full year results for the period ending December 31st, 2025. For the quarter, revenue decreased 0.3% to $27.8 billion, which was $110 million below estimates.

Adjusted earnings-per-share of $1.96 compared favorably to $1.78 the prior year and was $0.02 better than excepted.

For the year, revenue grew 0.4% to $91.9 billion while adjusted earnings-per-share of $8.16 compared to $7.62 in 2023. Currency exchange reduced revenue by 2% and earnings-per-share by 4%.

Click here to download our most recent Sure Analysis report on PEP (preview of page 1 of 3 shown below):

Dividend King #4: PPG Industries (PPG)

  • 5-Year Annual Expected Returns: 15.2%

PPG Industries is the world’s largest paints and coatings company. Its only competitors of similar size are Sherwin-Williams and Dutch paint company Akzo Nobel.

PPG Industries was founded in 1883 as a manufacturer and distributor of glass (its name stands for Pittsburgh Plate Glass) and today has approximately 3,500 technical employees located in more than 70 countries at 100 locations.

On January 31st, 2025, PPG Industries announced fourth quarter and full year results for the period ending December 31st, 2024. For the quarter, revenue declined 4.6% to $3.73 billion and missed estimates by $241 million.

Adjusted net income of $375 million, or $1.61 per share, compared favorably to adjusted net income of $372 million, or $1.56 per share, in the prior year. Adjusted earnings-per-share was $0.02 below expectations.

Source: Investor Presentation

For the year, revenue from continuing operations decreased 2% to $15.8 billion while adjusted earnings-per-share totaled $7.87.

PPG Industries repurchased ~$750 million worth of shares during 2024 and has $2.8 billion, or ~10.3% of its current market capitalization, remaining on its share repurchase authorization. The company expects to repurchase ~$400 million worth of shares in Q1 2025.

For 2025, the company expects adjusted earnings-per-share in a range of $7.75 to $8.05.

Click here to download our most recent Sure Analysis report on PPG (preview of page 1 of 3 shown below):


Dividend King #3: SJW Group (SJW)

  • 5-Year Annual Expected Returns: 16.0%

SJW Group is a water utility company that produces, purchases, stores, purifies and distributes water to consumers and businesses in the Silicon Valley area of California, the area north of San Antonio, Texas, Connecticut, and Maine.

SJW Group has a small real estate division that owns and develops properties for residential and warehouse customers in California and Tennessee. The company generates about $670 million in annual revenues.

Source: Investor Presentation

On October 28th, 2024, SJW Group reported third quarter results for the period ending June 30th, 2024. For the quarter, revenue grew 9.9% to $225.1 million, beating estimates by $11.6 million. Earnings-per-share of $1.18 compared favorably to earnings-per-share of $1.13 in the prior year and was $0.04 more than expected.

As with prior periods, the improvement in revenue was mostly due to SJW Group’s California and Connecticut businesses, which benefited from higher water rates, while growth in customers aided the Texas business.

Higher rates overall added $40 million to results for the quarter, higher customer usage added $4.8 million, and growth in customers contributed $2.4 million. Operating production expenses totaled $166.7 million, which was a 12% increase from the prior year.

Click here to download our most recent Sure Analysis report on SJW (preview of page 1 of 3 shown below):


Dividend King #2: Gorman-Rupp Co. (GRC)

  • 5-Year Annual Expected Returns: 16.5%

Gorman-Rupp began manufacturing pumps and pumping systems back in 1933. Since that time, it has grown into an industry leader with annual sales of nearly $700 million and a market capitalization of $1 billion.

Today, Gorman-Rupp is a focused, niche manufacturer of critical systems that many industrial clients rely upon for their own success.

Gorman Rupp generates about one-third of its total revenue from outside of the U.S.

Source: Investor Presentation

Gorman-Rupp posted fourth quarter and full-year earnings on February 7th, 2025, and results were weaker than expected. Adjusted earnings-per-share came to 42 cents, which was three cents light of estimates.

Revenue was up 1.3% year-over-year to $162.7 million, which matched expectations. The increase in sales was primarily attributed to the impact of pricing increases taken in the year-ago period.

Gross profit was $49.2 million for the quarter, or 30.2% of revenue. These were down from $50.9 million and 31.7%, respectively, in the same period of 2023.

The decline in gross margins of 150 basis points included 220 basis points of increased labor and overhead costs, which were driven by healthcare expenses.

That was partially offset by a 70-basis point improvement in cost of materials, which itself was driven by a 140-basis point improvement in selling prices offset by a 70-basis point decline from inventory costing.

Click here to download our most recent Sure Analysis report on GRC (preview of page 1 of 3 shown below):

Dividend King #1: Stepan Co. (SCL)

  • 5-Year Annual Expected Returns: 20.0%

Stepan manufactures basic and intermediate chemicals, including surfactants, specialty products, germicidal and fabric softening quaternaries, phthalic anhydride, polyurethane polyols and special ingredients for the food, supplement, and pharmaceutical markets.

It is organized into three distinct business lines: surfactants, polymers, and specialty products. These businesses serve a wide variety of end markets, meaning that Stepan is not beholden to just a handful of industries.

Source: Investor presentation

The surfactants business is Stepan’s largest by revenue, accounting for ~68% of total sales in the most recent quarter. A surfactant is an organic compound that contains both water-soluble and water-insoluble components.

Stepan posted fourth quarter and full-year earnings on February 19th, 2025, and results were mixed once again. Revenue was down 1.2% year-on-year to $526 million, but did beat estimates by almost $5 million. Adjusted earnings-per-share came to 12 cents, which missed estimates by 21 cents.

Global sales volume was off 1% year-over-year as double-digit growth in surfactants was offset and then some by demand weakness in polymers. Surfactants were up 3% year-over-year in Q4 to $379 million. Polymer net sales fell 12% to $130 million.

The company managed to generate about $13 million in pre-tax cost savings during the quarter, and about $48 million for the full year.

Click here to download our most recent Sure Analysis report on SCL (preview of page 1 of 3 shown below):

The Dividend Kings In Focus Series

You can see analysis on every single Dividend King below. The newest Sure Analysis Research Database report for each security is included as well.

Consumer Staples

Industrials

Health Care

Consumer Discretionary

Financials

Materials

Energy

Real Estate

Utilities

Performance Of The Dividend Kings

The Dividend Kings out-performed the S&P 500 ETF (SPY) in February 2025. Return data for the month is shown below:

  • Dividend Kings February 2025 total return: 0.4%
  • SPY February 2025 total return: -1.3%

Stable dividend growers like the Dividend Kings tend to underperform in bull markets and outperform on a relative basis during bear markets.

The Dividend Kings are not officially regulated and monitored by any one company. There’s no Dividend King ETF. This means that tracking the historical performance of the Dividend Kings can be difficult.

More specifically, performance tracking of the Dividend Kings often introduces significant survivorship bias.

Survivorship bias occurs when one looks at only the companies that ‘survived’ the time period in question. In the case of Dividend Kings, this means that the performance study does not include ex-Kings that reduced their dividend, were acquired, etc.

But with that said, there is something to be gained from investigating the historical performance of the Dividend Kings. Specifically, the performance of the Dividend Kings shows that ‘boring’ established blue-chip stocks that increase their dividend year-after-year can significantly outperform over long periods of time.

Notes: S&P 500 performance is measured using the S&P 500 ETF (SPY). The Dividend Kings performance is calculated using an equal weighted portfolio of today’s Dividend Kings, rebalanced annually. Due to insufficient data, Farmers & Merchants Bancorp (FMCB) returns are from 2000 onward. Performance excludes previous Dividend Kings that ended their streak of dividend increases which creates notable lookback/survivorship bias. The data for this study is from Ycharts.

In the next section of this article, we will provide an overview of the sector and market capitalization characteristics of the Dividend Kings.

Sector & Market Capitalization Overview

The sector and market capitalization characteristics of the Dividend Kings are very different from the characteristics of the broader stock market.

The following bullet points show the number of Dividend Kings in each sector of the stock market.

  • Consumer Staples: 14
  • Industrials: 12
  • Utilities: 9
  • Consumer Discretionary: 2
  • Health Care: 5
  • Financials: 5
  • Materials: 5
  • Real Estate: 1
  • Energy: 1
  • Communication Services: 0

The Dividend Kings are overweight in the Industrials, Consumer Staples, and Utilities sectors. Interestingly, The Dividend Kings have zero stocks from the Information Technology sector, which is the largest component of the S&P 500 index.

The Dividend Kings also have some interesting characteristics with respect to market capitalization. These trends are illustrated below.

  • 6 Mega caps ($200 billion+ market cap; ABBV, JNJ, PEP, PG, KO, WMT)
  • 26 Large caps ($10 billion to $200 billion market cap)
  • 14 Mid caps ($2 billion to $10 billion)
  • 8 Small caps ($300 million to $2 billion)

Interestingly, 23 out of the 54 Dividend Kings have market capitalizations below $10 billion. This shows that corporate longevity doesn’t have to be accompanied by massive size.

Final Thoughts

Screening to find the best Dividend Kings is not the only way to find high-quality dividend growth stock ideas.

Sure Dividend maintains similar databases on the following useful universes of stocks:

There is nothing magical about investing in the Dividend Kings. They are simply a group of high-quality businesses with shareholder-friendly management teams that have strong competitive advantages.

Purchasing businesses with these characteristics at fair or better prices and holding them for long periods of time will likely result in strong long-term investment performance.


Thanks for reading this article. Please send any feedback, corrections, or questions to [email protected].


Source link

Tariff Chaos Hits the Market – But Here’s Why the Stocks Bounce Back


February was a bumpy month for the overall stock market and our stocks.

Distractions like Trump 2.0’s latest tariff threats, the German elections, DeepSeek’s AI claims, weak consumer confidence and elevated inflation caused some wild market swings. As a result, all of the major indices ended the month of February lower, with the S&P 500 down 1.4%, the Dow down 1.6% and the NASDAQ down nearly 4%.

March has gotten off on equally volatile footing. Yesterday, markets began to sell off as deadlines approached for President Trump’s threatened tariffs against Canada and Mexico. As a result, the S&P fell 1.7% on Monday to post its worst day of the year. Meanwhile, the Dow lost 1.5% and the tech-heavy NASDAQ dropped 2.6%.

The stock market threw another hissy fit over tariffs today, with all of the major indices opening sharply lower this morning. At one point, they were all down by more than 1% before moderating those losses in afternoon trading. As investors digested the tariff news, they began to worry about how they will impact the U.S. economy now that they are in place. 

So, in today’s Market 360, let’s review the latest tariff news. I’ll explain why we shouldn’t worry and what we need to remember during market selloffs. Simply put, good stocks will bounce. I’ll share an example of one such stock… and why quantum computing should serve as a catalyst for it in the future.


Source link

USD hit hard by tariffs as markets worry about US growth – United States


Written by Steven Dooley, Head of Market Insights, and Shier Lee Lim, Lead FX and Macro Strategist

USD loses its shine on growth concerns

The US dollar bucked its usual status as a “safe haven” trade and instead fell for a second session overnight as worries about new tariffs on Canada, Mexico and China caused markets to fret about US growth.

US shares were again weaker overnight with the Dow Jones index down 1.6%.

The USD index fell 1.0% overnight and is now down 1.9% since US president Donald Trump confirmed on Monday that new tariffs would go ahead as planned.

The biggest gains versus the US dollar were in Europe with the euro and British pound jumping higher – both currencies are seen as currently insulated from tariffs while an expectation of increased defence spending also boosted the currencies.

Regionally, the Aussie climbed to three-day highs to gain 0.4%, while the NZD/USD gained 0.6%.

In Asia, the USD fell even faster. The USD/SGD lost 0.6% and neared three-month lows while the USD/CNH dropped a massive 0.7% as it also neared three-month lows.

President Trump and trade policies will likely remain in focus with his 90-minute joint address to the US Congress due at 9.00pm EST (1.00pm AEDT).

USD index

AUD/USD remains at risk despite steady GDP outlook

Away from tariffs, the key release today is Australian December-quarter GDP, due at 11.30am AEDT. 

We predict a more robust 0.5% quarterly (1.2% year-over-year) increase in Q4 GDP.

For now, the AUD/USD remains in the 0.6200 to 0.6400 trading range, but with the market in a long-term downtrend, the risks remain for a break below support at 0.6085 and a possible eventual break below 0.6000.

AUD/USD in downtrend

KRW vulnerable as inflation eases below 2%

Tomorrow, the CPI for South Korea will be released.

Due in part to base effects, we anticipate that inflation will decrease from 2.2% year over year to 1.9% in February.

Additionally, core inflation probably decreased from 2.0% in January to 1.9% year over year in February.

Recent political events, the possibility of US tariffs, and a worse GDP forecast make a more expansionary budget seem more plausible.

However, we have a negative outlook on KRW. Unlike most markets in Asia, which have seen USD weakness, USD/KRW continues to strengthen and 50-day MA of 1441.48 remains key support.

South Korea inflation to fall

USD weaker post tariffs, especially in Asia

Table: seven-day rolling currency trends and trading ranges  

Rates table

Key global risk events

Calendar: 3 – 7 March  

Calendar

All times AEDT

Have a question? [email protected]

*The FX rates published are provided by Convera’s Market Insights team for research purposes only. The rates have a unique source and may not align to any live exchange rates quoted on other sites. They are not an indication of actual buy/sell rates, or a financial offer.


Source link

Navigating The New Trade Order


As global trade fractures in 2025, companies face rising tariffs, supply chain turmoil, and shifting economic dynamics.

Geopolitical pressures are reshaping global economic and financial activity leading to what is commonly called a “fractured” global economy. Among other things, a fractured economy is characterized by increased trade barriers and tariffs, geopolitical tensions and shifts to specific trading blocks (like US vs China), changing investment patterns, and supply chain disruptions.

These are not new phenomena, and over time companies have responded by implementing a variety of strategies, such as rationalizing production lines, finding new markets, or near shoring sources of supply to name but a few. 

However, 2025 is not business as usual. According to the most recent outlook, in January, by chief economists at the World Economic Forum, this global fragmentation will lead to price increases for consumers and cost increases for business, for the next three years. They also agree that developments in the US will alter the trajectory of the global economy, with the majority saying that US domestic policy will bring a long-term global economic shift rather than a short-term disruption. 

Across The Border, Across The Board

In a recent interview, Suzie Petrusic, Senior Analyst in Gartner’s Supply Chain Practice, explains that with respect to US trade policy, the big difference between the way that tariffs have been applied in the past and how they are now, is the sheer scope of the tax.

“In the past it’s usually been like taking a scalpel to the tariffs—market by market,” she said. “But these new tariffs are broadly applied, so it’s actually hard for me to imagine an industry that’s not impacted.”

Impending US tariffs, and the retaliatory protectionism expected from China, the EU, Canada and Mexico will likely have highly complex, long term disruptive effects on traditional supply chains and are expected to impact industries and economies world-wide.

For example, it’s anticipated that US tariffs on EU imports will reduce Europe’s GDP by 1.5% in 2025, US GDP will fall by 1.6%, and a 25% tariff on Canadian exports will push that economy into recession. 

Global corporate investment patterns will also be impacted.  According to recent research by Ernst & Young, the negative direction of US-China relations (as reflected in the recent US ban of TikTok) will likely prompt high-profile Chinese companies to pursue IPOs in alternative markets like Hong Kong or the European exchanges. (EY Global IPO Trends 2024)

And when it comes to specific sectors, there will be winners and losers. At a recent investor conference, Ford CEO Jim Farley, described the potential impact of these sweeping tariffs on both the US automotive industry in general, and more specifically, the bottom lines of non-American automakers.

“Long term, a 25% tariff across the Mexico and Canada borders would blow a hole in the U.S. industry that we’ve never seen,” Farley said. “Frankly, it gives free rein to South Korean, Japanese and European companies that are bringing 1.5 million to 2 million vehicles into the U.S. that wouldn’t be subject to those Mexican and Canadian tariffs. It would be one of the biggest windfalls for those companies ever.” In contrast, upon the announcement of the tax on Canadian producers, American steel maker Alcoa saw a significant bounce in their stock price as investors anticipated higher prices and bloated profit margins for American steel companies. 

Levers—Which Levers?

So, what levers will companies pull in 2025 to strategically navigate through this volatile and uncertain environment? As MP Biomedicals CFO Hendry Lim explains, “Companies like ours will continue to adjust sourcing strategies to countries not impacted by the tariff,  which allows for diversify of supply and reduction of risk.”

MP Biomedicals—a manufacturer and distributer of life science, fine chemical and diagnostic products with offices and facilities throughout Europe, Asia, Australia and the Americas— has turned its eye to imports from India and Singapore. The company is also rerouting production to their other facilities before entering the US. However, this strategy isn’t clear cut. It’s a complex modelling exercise, Lim explains. 

“Of course we’ll have to weigh the freight cost versus the tariff as well as other options, looking at things like geopolitical risk, natural disasters in certain countries, market fluctuations, and then thereafter use financial models to quantify the financial impact and to develop risk mitigation strategies. We then incorporate all these factors into our forecasting. At the end of the day it’s a matter of everyone collaborating and working together to develop a strategy, to actually counteract these risks,” he adds.

Lim, MP Biomedicals: Everyone must collaborate to counteract these risks.

While diversifying supply will likely top strategic agendas in 2025, some companies like General Motors and Walmart will be stockpiling inventory in advance of potential input price increases.  However, for companies that are only reacting now, Petrusic says, they may not have a whole lot of optionality in terms of what they can do to completely avoid the impact.

“You may see organizations taking the hit on holding additional inventory to avoid more costs later, but it all boils down to lead time,” she says, citing the difficulties companies face in trying to use inventory planning to minimize tariff risk.

“When it comes to risk management, scenario planning is an essential muscle in this environment,” she says. “But it’s especially difficult right now, because it’s a multifaceted, dynamic, multi-year probability risk event.”

Ultimately, companies will need to bring geostrategic risk into the fore of their scenario planning.

“In doing so, the most helpful thing that any C-suite executive can do, is create alignment at the C level and clarity all the way down through the organization. If you can create that clarity and alignment strategically at the C-suite then you’re able to more confidently know that your people are making decisions that are pulling and pushing towards the same goal,” she explains.

Data Beats Cash

The ability to understand risk also boils down to a company’s investment in technology, explains Rizwan Khan, Managing Partner at Acclime Vietnam, and experienced regional CFO, CIO and auditor.

“There are multiple factors that will affect production costs in this region, like Chinese investment in a company or the percentage of Chinese inputs or raw material in their products.  So overall, the tariffs that are being imposed pose a significant risk to companies in Southeast Asia as well. Vietnamese companies will need to focus more on cost reducing efficiencies to remain competitive,” Khan says. 

Competitors around the world that are exposed to the same tariffs will have to win on cost reductions, he adds. “My focus is making sure companies are utilizing technology in the most productive way to minimize those costs. In the past, we used to say that cash is king—in the current environment, data is king.” 

With so much data available, whether it is from the procurement point of view or from the production point of view, corporate strategies in a volatile trade environment require end to end visibility, he adds. 

“When it comes to technology innovations, advanced predictive and prescriptive analytic technology can help companies understand the impact of tariff-related disruptions, by helping them quantify the impact across a supply chain, or help identify specific supplier risks, or forecast changes in demand across regions in real time. This type of end-to-end visibility ensures that companies can respond to shifting market dynamics,” he says.

For now, many are still trying to figure out how 2025 will unfold when it comes to the bubbling trade war of the worlds. How companies will fare this year will depend on how quickly they can respond to emerging barriers to trade and a volatile risk environment.


Source link

Crypto Gambling in 2025: Top Trends to Watch


Crypto gambling trends

Crypto gambling has always been a wild ride: one minute, it’s a revolution, the next, regulators are breathing down its neck. What was sci-fi five years ago is now just another Tuesday. And 2025? It’s going to be glorious.

Expect AI casinos reading your soul, meme coins funding your next bet, and, of course, gambling platforms thriving in the chaos. Bitz.io, already a favorite among crypto gamblers, will likely push the boundaries further. Maybe with decentralized tournaments, NFT-based bets, or even AI-powered dealers that know when you really should stop.

Governments will help by launching their own crypto casinos, and smart contracts will be unbreakable until they aren’t. The future is just as bright as a flashing neon sign with a jackpot sound effect.

Governments Will Launch Their Own Crypto Gambling Platforms

In 2025, the same governments that once fought crypto gambling will pivot and embrace it, but on their terms. Expect state-controlled blockchain casinos, where the house edge is set by national authorities and tax collection is instant. 

Some countries will justify this as a way to protect citizens from unregulated gambling, while others will see it as a way to tap into a lucrative industry. Here are some possible ways the government might handle crypto gambling:

  1. State-Owned Blockchain Casinos. Fully controlled by the government, all winnings and transactions are traceable. For instance, Thailand is considering legalizing online gambling to generate significant annual revenue. 
  2. Mandatory KYC for All Crypto Bets. No more anonymity, as personal IDs will be tied to blockchain wallets. The European Union, for example, has implemented comprehensive KYC regulations to combat financial crimes. 
  3. Taxes Embedded in Smart Contracts. A portion of every bet will be automatically sent to tax authorities, ensuring seamless revenue collection.
  4. Banned Private Gambling Platforms. Heavy fines for anyone using non-government crypto gambling sites. In the United States, the federal government is likely to intervene against quasi-gambling products, indicating a move towards stricter regulation. 

Ironically, crypto gambling was supposed to be about decentralization. Yet, 2025 may see it being absorbed into the very regulatory frameworks it tried to escape.

Uprising in Virtual Casinos Driven by AI

Forget traditional online gambling. In 2025, AI-driven, fully immersive casinos will replace static betting sites. These casinos will act as living entities: learning player preferences, tailoring game experiences in real-time, and even simulating human dealers with near-perfect emotional responses. 

No more generic slots or table games, each experience will be dynamically generated based on the player’s behavior.

Feature Description
Adaptive Gameplay AI will adjust game mechanics based on player engagement.
Personalized Odds No universal odds—AI tailors them based on player history.
Deepfake Dealers Realistic AI dealers, are indistinguishable from real humans.
Emotion Tracking AI reads player emotions via webcam or VR sensors.
Blockchain Enforcement Smart contracts ensure fairness without third-party audits.

With these developments, traditional casinos will struggle to compete, as AI-generated environments will offer players an experience they can’t find anywhere else. 

As Ian Tibot, Chief Commercial Officer of Future Anthem, notes, “We see every single spin of a slot, we see every single bet, and we actually understand the experience that the player is having by creating the concept of a session out of that data.”

Meme Coins Will Rule the Gaming Industry

Bitcoin and Ethereum? How boring. In 2025, the real action will be in meme coins, where internet culture collides with high-stakes gambling in the most spectacularly irrational way possible. 

Forget boring betting – your fate now rests in the hands of Twitter trends and Elon Musk’s next cryptic tweet. Plus, putting money into a currency with a frog motif just because someone on Reddit suggested it is the epitome of responsible investing (if you ask me).

Coin Name Concept Price Prediction for 2025
$PEPE A meme coin inspired by the Pepe the Frog character, gaining traction in online gambling communities. Predicted to reach $0.01, contingent on market trends. 
$DOGE The original meme coin, Dogecoin continues to be popular in gambling circles due to its widespread recognition. Expected to maintain stability with modest growth.
$SHIB Shiba Inu coin, often dubbed the ‘Dogecoin killer,’ has found its niche in decentralized gambling platforms. Forecasted to experience gradual appreciation.
$FLOKI Named after Elon Musk’s pet, Floki Inu has carved out a space in meme coin casinos. Anticipated to see incremental value increases.
$MEME A token that embodies the essence of meme culture, used in various online gaming and gambling platforms. Projected to rise to approximately €0.0183 by the end of 2025.

How to gamble responsibly with meme coins or at least minimize regret:

  • Accept That Logic Doesn’t Apply: Traditional market analysis? Cute. The only trend that matters is vibes.
  • Set a Limit: If your investment strategy involves hoping a Shiba Inu GIF pumps your net worth, maybe cap your losses so it won’t ruin your life.
  • Stay Updated on the Circus: Your financial future may depend on the next big meme. Stay vigilant, dear gambler.
  • Enjoy the Madness: You’re not here for safe bets, you’re here for the ride. Might as well have fun.

Will meme coins revolutionize crypto gambling? Probably not. Will they create a spectacularly absurd betting landscape filled with chaos, hype, and just enough wins to keep the dream alive? Absolutely.

Smart Contracts Will Introduce Uncheatable Gambling

The promise of smart contracts in gambling is simple: automated, tamper-proof, and completely fair. The reality? While these self-executing contracts eliminate some traditional risks, they are far from invincible. 

In 2025, expect increasingly sophisticated exploits, creative loopholes, and a never-ending battle between developers and hackers. The difference? Leading online site Bitz casino investing in rigorous audits and proactive security measures to stay ahead of the game.

Risk Type Description
Oracles Can Be Hacked Even decentralized systems rely on external data sources, which can be manipulated.
Hidden Developer Backdoors Smart contracts are “immutable,” but some devs will still find ways to include secret exploits.
Front-Running Attacks Betting transactions could be manipulated via MEV (maximal extractable value) attacks.
Game Theory Exploits Players will find ways to game the system using coordinated blockchain transactions.

Smart contracts are designed to make crypto gambling fairer and more automated, but keeping them secure is still a challenge we need to tackle. It’s really important to have regular audits, keep things updated, and focus on responsible development to make sure we create a safer betting environment.

Conclusion

Crypto gambling in 2025 won’t just evolve, it’ll mutate. AI casinos will know you better than your friends, governments will protect players while taking their cut, and meme coins will turn bets into lottery tickets. Regulators? Still trying to Google Blockchain. One thing’s certain—this game never stops.


Source link

Dividend Aristocrats In Focus: Atmos Energy


Updated on March 3rd, 2025 by Felix Martinez

The Dividend Aristocrats are a group of stocks in the S&P 500 Index with 25+ years of consecutive dividend increases. These companies have high-quality business models that have stood the test of time and shown a remarkable ability to raise dividends every year regardless of the economy.

We have compiled a list of all 69 Dividend Aristocrats, along with relevant financial metrics like dividend yield and P/E ratios. You can download the full Dividend Aristocrats list by clicking on the link below:


Disclaimer: Sure Dividend is not affiliated with S&P Global in any way. S&P Global owns and maintains The Dividend Aristocrats Index. The information in this article and downloadable spreadsheet is based on Sure Dividend’s own review, summary, and analysis of the S&P 500 Dividend Aristocrats ETF (NOBL) and other sources, and is meant to help individual investors better understand this ETF and the index upon which it is based. None of the information in this article or spreadsheet is official data from S&P Global. Consult S&P Global for official information.

The list of Dividend Aristocrats is diversified across multiple sectors, including consumer goods, financials, industrials, and healthcare. Surprisingly, the utility sector is underrepresented.

Only three utility stocks are on the list of Dividend Aristocrats: Consolidated Edison (ED), NextEra Energy (NEE), and Atmos Energy (ATO).

Only three utilities are on the list, which may come as a surprise, especially since utilities are widely regarded as steady dividend stocks. This article will discuss Atmos Energy’s path to becoming a Dividend Aristocrat.

Business Overview

Atmos Energy was formed in 1906 in Texas. Since then, it has grown organically and through mergers. Today, Atmos Energy distributes and stores natural gas in eight states, serving over 3 million customers.

In addition, Atmos owns about 5,700 miles of natural gas transmission lines. The utility should generate about $4.8 billion in revenue last year. The company serves over 3 million natural gas customers in eight states.

Source: Investor Presentation

Atmos posted first quarter earnings on February 5th, 2025. The company reported reported fiscal 2025 Q1 earnings of $2.23 per diluted share, with a net income of $351.9 million. Capital expenditures reached $891.2 million, with 86% dedicated to safety and reliability. The company maintains strong financials, with 60.3% equity capitalization and $5.2 billion in liquidity, alongside $150.5 million in annualized regulatory outcomes.

The company reaffirmed its fiscal 2025 earnings guidance of $7.05–$7.25 per diluted share and expects $3.7 billion in capital expenditures. The Board declared a quarterly dividend of $0.87 per share, raising the annual dividend to $3.48, an 8.1% increase from 2024.

CEO Kevin Akers highlighted the company’s ongoing commitment to safety, reliability, and modernization, crediting its 5,300 employees for delivering strong results that benefit customers and communities.

Growth Prospects

Earnings growth across the utility industry typically mimics GDP growth, plus a couple of percentage points. However, we expect Atmos Energy to continue outperforming this trend due to its focus on capital investment in its regulated operations, a constructive regulatory environment in Texas, and population growth.

As a result, the company should benefit from strong rate base growth, which will generate annual earnings per share growth in accordance with management’s 6%—8% guidance.

New customers, rate increases, and aggressive capital expenditures are Atmos Energy’s growth drivers. One benefit of operating in a regulated industry is that utilities are permitted to raise rates on a regular basis, which virtually assures a steady level of growth.

Source: Investor Presentation

The company’s primary risk is its ability to achieve timely and positive regulatory rate adjustments. If it achieves lower than expected allowed returns, this could significantly harm profits.

However, we believe Atmos can achieve at least 7% annual EPS growth through continued improvements in gross margin, reductions in operating costs as a percentage of revenue, and top-line growth via acquisitions and organic customer growth.

The company continues to file favorable rate cases with its various localities, which also provide for small revenue increases over time, as we saw again in fiscal 2024 fullyear results

Competitive Advantages & Recession Performance

Atmos Energy’s main competitive advantage is the utility industry’s high regulatory hurdles. Gas service is necessary and vital to society. As a result, the industry is highly regulated, making it virtually impossible for a new competitor to enter the market. This provides great certainty to Atmos Energy and its annual earnings.

Another competitive advantage is the company’s stable business model and sound balance sheet, giving it an attractive cost of capital. This enables it to fund accretive acquisitions and growth capital expenditures, driving outsized earnings per share growth.

In addition, the utility business model is highly recession-resistant. While many companies experienced large earnings declines in 2008 and 2009, Atmos Energy’s earnings per share kept growing. Earnings-per-share during the Great Recession are shown below:

  • 2007 earnings-per-share of $1.91
  • 2008 earnings-per-share of $1.99 (4% growth)
  • 2009 earnings-per-share of $2.07 (4% growth)
  • 2010 earnings-per-share of $2.20 (6% growth)

The company still generated healthy growth even during the worst of the economic downturn. Results remained resilient and continued to grow during the pandemic, demonstrating Atmos’ assets’ mission-critical nature.

This resilience has allowed Atmos Energy to continue increasing its dividend each year during these unfavorable market environments.

Valuation & Expected Returns

Atmos Energy is expected to earn $7.20 this year. Based on this, the stock trades with a price-to-earnings ratio of 21.3x. This is above our fair value estimate of 19x earnings, and above the 10-year average price-to-earnings ratio for the stock.

As a result, Atmos Energy shares appear to be overvalued. If the stock valuation compresses from 21.3 to 19 over the next five years, the corresponding multiple compression would decrease annual returns by 1.6%. This could be a slight headwind for future returns.

Fortunately, the stock could still provide positive returns to shareholders, through earnings growth and dividends. We expect the company to grow earnings by 7% per year over the next five years.

In addition, the stock has a current dividend yield of 2.3%. ATO has increased its dividend for 41 consecutive years.

Putting it all together, Atmos Energy’s total expected returns could look like the following:

  • 7% earnings growth
  • 1.6% P/E multiple compression
  • 2.3% dividend yield

Added up, Atmos Energy is expected to generate 7.7% annualized total returns over the next five years, which does not make the stock attractive for investors interested in dividend growth and total returns.

The dividend yield is not substantial but remains attractive, while the dividend appears relatively safe. The company has projected a 2025 payout ratio of ~48%, indicating a sustainable dividend. As a result, we view Atmos Energy as a blue-chip stock.

Final Thoughts

Atmos Energy stock is attractive for investors looking for an above-average yield and regular dividend growth. Because of this, it can serve a valuable purpose in an income investor’s portfolio. The stock offers a very secure and growing dividend income stream, and its dividend yield is well above the average dividend yield of the S&P 500 Index.

Note: Atmos Energy also ranks well using The Chowder Rule.

Atmos Energy is also a Dividend Aristocrat and should raise its dividend each year. With five-year expected returns of 11% per year, ATO stock is a buy.

Additionally, the following Sure Dividend databases contain the most reliable dividend growers in our investment universe:

If you’re looking for stocks with unique dividend characteristics, consider the following Sure Dividend databases:

The major domestic stock market indices are another solid resource for finding investment ideas. Sure Dividend compiles the following stock market databases and updates them monthly:

Thanks for reading this article. Please send any feedback, corrections, or questions to [email protected].


Source link

Crypto Watch: Trump’s Next Move Could Trigger Sizable Surge


Most investors expected stability, but cryptocurrencies have delivered spectacle…

After touting his support all along the campaign trail, President Trump initially had cryptocurrencies tearing higher. But as with the rest of the financial markets, cryptos have been stuck on a rollercoaster that would test even the most iron-stomached investors since November’s election.

Indeed, Bitcoin (BTC/USD) rallied 60% in the month after the election on hopes for pro-crypto policies out of D.C. Then, worries about reinflation sent Bitcoin crashing 15%. 

As those inflation worries abated, BTC rebounded 15%… only to crash 20% on tariff fears. 

Most recently – just this past weekend – Bitcoin popped 10% in a hurry on news that Trump is set to create a strategic national reserve for cryptos. But when the president subsequently announced more tariffs on Monday, BTC gave back all those gains. 

It has been a violent and volatile ride over the past few months. The natural question on everyone’s mind is: What’s next?

We think a rally – and a pretty big one at that… 

This Week’s Bullish Development

Perhaps surprisingly, considering what we’ve just outlined, our bullishness stems from Trump. 

As we mentioned, shortly after the election, Bitcoin surged from $60,000 to $100,000 on the idea that the president would enact a series of pro-crypto policies that would support innovation and growth in the industry. Since then, however, BTC has stumbled on concerns that the president was de-prioritizing cryptos. 

That is, in his first few weeks in office, Trump hit the ground running with tariffs and federal spending cuts. But he moved rather slowly with his crypto-related promises, creating worries that his action would be less than hoped. 

That could all change later this week. 

This Friday, March 7, Trump is set to host the first-ever White House Crypto Summit. Attendees will include prominent founders, CEOs, and investors from the industry. 

We think he could announce more big things at this summit. 

Trump is well-aware of how crypto markets have struggled – and of how some crypto investors who supported him on the campaign trail may be disappointed with how the markets have fared so far during his presidency. 

That’s why we think he tried to ‘save’ the crypto markets with the announcement of a crypto strategic national reserve on Sunday… 


Source link

CFO Corner: Anne-Laure Autret-Cornet, OSE Immunotherapeutics


Since 2016, Anne-Laure Autret-Cornet has been the CFO of OSE Immunotherapeutics, a biotech dedicated to immuno-oncology and immuno-inflammation. The Nantes, France-based company went public on the Euronext Paris stock exchange in late March 2015.

Global Finance: What has been your biggest challenge as CFO?

Anne-Laure Autret-Cornet: In the biotech sector, we are always fundraising. In Europe, it is even more challenging, not only because of the economic and political challenges, but also because the markets have been rather sluggish since 2023. That said, OSE managed to secure funding until first-quarter 2027. Of course, the early stages of the COVID-19 pandemic were very challenging. The uncertainty and rapid changes in the global market required quick adaptation and strategic financial planning to ensure the stability and continuity of our operations.

GF: Where has the bulk of your energy and time been directed in the last year?

Autret-Cornet: Along with our CEO and chief business officer, I was focused on securing funding for our ongoing and upcoming research and development projects. We received a grant of €8.4 million in non-dilutive public funding to support a Phase 3 clinical trial of our cancer vaccine, Tedopi, in lung cancer. In addition, we signed a major strategic partnership with AbbVie last February. This involves the development of OSE-230, a novel monoclonal antibody, and included an upfront payment of $48 million with potential milestone payments and royalties. And we have ongoing important collaborations with other companies such as Boehringer Ingelheim and Veloxis Pharmaceuticals.

These partnerships underscore our commitment to advancing innovative therapies and highlight the value of our research and development capabilities. All this effort last year, in addition to some positive clinical trial results, has increased confidence in our company, resulting in a solid financial position until 2027 and a stock price increase of around 69% year-on-year.

GF: How important is having a top team?

Autret-Cornet: In small companies like ours, resources are stretched, and so it is critical to have the best talent to achieve our strategic goals. I aim to bring on board team members who not only have the right skills and experience but also align with our company values and culture. As CFO, I also head up human resources, legal, and information technology—so it’s critical to have people who are highly accountable, incredibly engaged, and collaborate well across the organization.

GF: Can European governments do more to boost innovation?

Autret-Cornet: European countries can increase investment in research and development, provide tax incentives for innovative companies, and foster collaboration between academia and industry. We are seeing an increased use of artificial intelligence to speed up drug discovery and development processes. OSE recently announced a strategic collaboration in this space with Scienta Lab, a leader in AI-driven precision immunology.

GF: How are you making use of AI in finance at OSE?

Autret-Cornet: AI has been implemented for two years in our financial system. Already we have seen how it helps improve efficiency, accuracy, and decision-making processes: for example, in predictive analytics, scenario modeling, risk management, and automating routine tasks. I see AI evolving to become an integral part of financial operations, providing deeper insights and enabling more strategic decision-making. Beyond the AI tools we are using in our research and development processes, we are deploying tools that help employees in some of their daily tasks, and I’ll be keeping an eye out to see what more we can do.

GF: What keeps you up at night?

Autret-Cornet: Ensuring the financial health and sustainability of the company is always on my mind. Additionally, staying ahead of market trends and regulatory changes is a constant challenge.


Source link

Copyright © 2023 | Powered by WordPress | Coin Market Theme by A WP Life