Dividend Aristocrats In Focus: PepsiCo


Updated on March 7th, 2025 by Nathan Parsh

We believe the Dividend Aristocrats are the “cream of the crop” of the U.S. stock market. The Dividend Aristocrats are a group of S&P 500 stocks that have increased their dividends for at least 25 years, among other requirements.

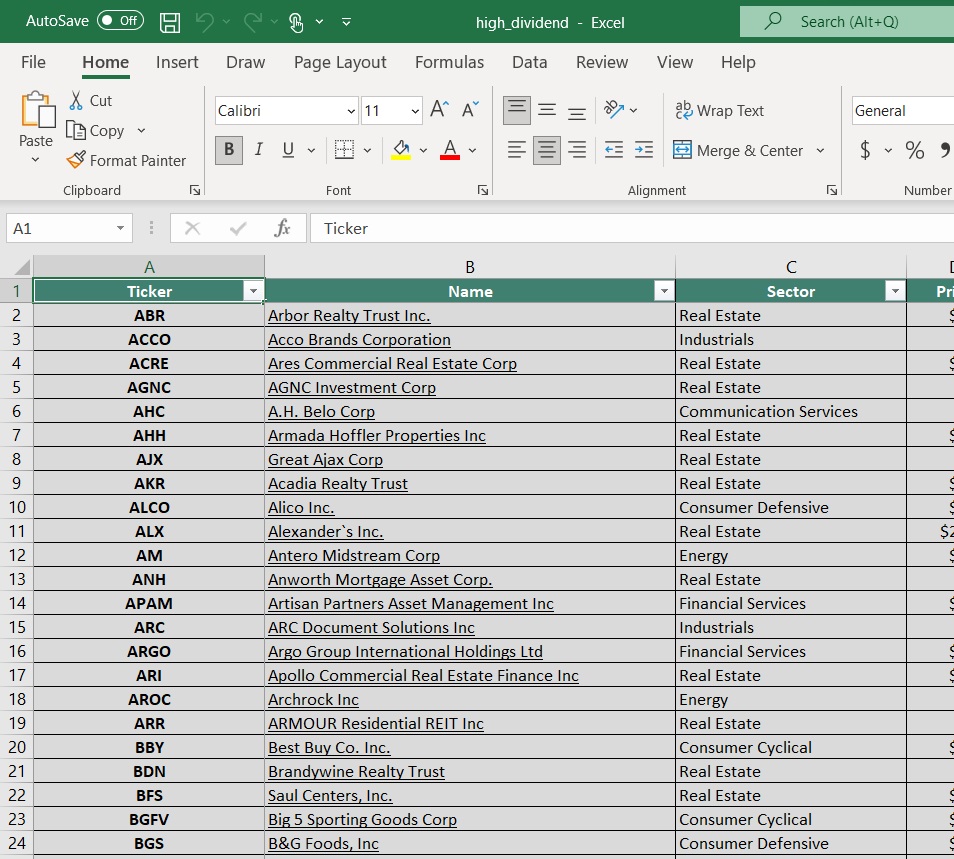
With this in mind, we created a list of all 69 Dividend Aristocrats, along with important financial metrics such as dividend yields and price-to-earnings ratios.

You can download your free list of all 69 Dividend Aristocrats by clicking on the link below:


Disclaimer: Sure Dividend is not affiliated with S&P Global in any way. S&P Global owns and maintains The Dividend Aristocrats Index. The information in this article and downloadable spreadsheet is based on Sure Dividend’s own review, summary, and analysis of the S&P 500 Dividend Aristocrats ETF (NOBL) and other sources, and is meant to help individual investors better understand this ETF and the index upon which it is based. None of the information in this article or spreadsheet is official data from S&P Global. Consult S&P Global for official information.

We review all the Dividend Aristocrats each year. Next up, we will review the food and beverage giant PepsiCo (PEP).

The stock offers a solid 3.6% dividend yield and has increased its dividend for over 50 years in a row. The company’s dividend is very safe, and the stock is suitable for risk-averse income investors.

PepsiCo’s valuation is well below its historical average, and it continues to post solid results.

Business Overview

Pepsi-Cola was created in the late 1890s by Caleb Bradham, a North Carolina pharmacist. Meanwhile, Frito-Lay, Inc. was formed in 1961 from the merger of Frito Company and the H. W. Lay Company. In its current form, PepsiCo came together as a result of the 1965 merger of Pepsi-Cola and Frito-Lay.

Today, PepsiCo is a global food and beverage giant with a market capitalization above $215 billion and approximately $92 billion in annual revenue.

Its business is split roughly 60-40 in terms of food and beverage revenue. It is also balanced geographically between the U.S. and the rest of the world.

Source: Investor Presentation

PepsiCo has a large portfolio and owns many popular brands. Some of the company’s major brands include Pepsi and Mountain Dew sodas and non-sparkling beverages like Pure Leaf, Tropicana, Gatorade, and bottled water.

In addition to PepsiCo’s core beverage brands, it also has a large snacks business under the Frito-Lay brand. The company has also built a portfolio of healthier foods, including Quaker, Naked, and Sabra.

On February 4th, 2025, PepsiCo reported fourth-quarter and full-year results for the period ending December 31st, 2024. For the quarter, revenue decreased 0.3% to $27.8 billion, which was $110 million below estimates. Adjusted earnings-per-share of $1.96 compared favorably to $1.78 in the prior year and was $0.02 better than expected.

For the year, revenue grew 0.4% to $91.9 billion while adjusted earnings-per-share of $8.16 compared to $7.62 in 2023. Currency exchange reduced revenue by 2.0% and earnings-per-share by 4%.

Organic sales were up 2.1% for the quarter and 2.0% for the year. For the quarter, volume for both food and beverage were up 1%. PepsiCo Beverages North America’s revenue was unchanged, but volume fell 3%. Frito-Lay North America declined 2% while volume was also down 3%. Quaker Foods North America was down 2%.

PepsiCo provided an outlook for 2025 as well, with the company expecting mid-single-digit growth for adjusted earnings-per-share growth.

Growth Prospects

PepsiCo has a long history of steady growth. Even in a challenging environment due to declining soda consumption, PepsiCo has continued its consistent growth.

We believe PepsiCo will generate 6% adjusted earnings-per-share growth per year over the next five years. Going forward, two of PepsiCo’s most promising catalysts are growth in healthier foods and beverages and emerging markets.

Large soda companies like PepsiCo have had to adapt to a more health-conscious consumer. To do this, PepsiCo has shifted its portfolio toward healthier foods that are resonating more strongly with changing consumer preferences.

In addition, PepsiCo has a huge growth opportunity in emerging markets like China, Africa, India, and Latin America.

Source: Investor Presentation

These are under-developed regions of the world with large consumer populations and high economic growth rates.

International markets (particularly emerging ones) have been a growth driver over the past few years.

Last quarter, revenue in Europe was up 7%, aided largely by a 3% increase in beverage volume and a 1% improvement in food volume. Revenue in Latin America increased 4%, Africa/Middle East/South Asia was up 14%, and the Asia Pacific/Australia/New Zealand/China region grew 1%.

Competitive Advantages & Recession Performance

PepsiCo has numerous competitive advantages, including strong brands and a global scale. In all, PepsiCo has ~20 individual brands that each collect at least $1 billion in annual revenue. Strong brands give PepsiCo optimal shelf space at retailers and pricing power.

PepsiCo’s financial strength also allows the company to invest in research and development and advertising to retain its competitive advantages.

For example, PepsiCo invests billions each year in research and development to innovate new products and packaging designs. In addition, PepsiCo regularly spends more than $2 billion each year on advertising to maintain market share and build brand equity with consumers.

PepsiCo’s competitive advantages and strong brands make the company highly profitable, even during recessions. Food and beverages always retain a certain level of demand, which is why the company held up so well during the Great Recession.

PepsiCo’s earnings-per-share throughout the Great Recession of 2007-2009 are listed below:

  • 2007 earnings-per-share of $3.34
  • 2008 earnings-per-share of $3.21 (3.9% decline)
  • 2009 earnings-per-share of $3.77 (17% increase)
  • 2010 earnings-per-share of $3.91 (3.7% increase)

As you can see, PepsiCo’s earnings-per-share declined only modestly in 2008. The company then increased earnings by nearly 20% in 2009, which is very impressive. Earnings continued to grow once the recession ended.

The company reported strong growth in 2020 and 2021 when the coronavirus pandemic sent the U.S. economy into a recession. Therefore, PepsiCo is a recession-resistant business.

Valuation & Expected Returns

We expect PepsiCo to generate earnings per share of $8.59 for 2025. Based on this, the stock trades for a price-to-earnings ratio of 18.3. Our fair value estimate is a price-to-earnings ratio of 24.0. Therefore, PEP stock appears undervalued. Multiple expansion could add 5.6% to yearly annual returns over the next five years.

Earnings-per-share growth and the stock’s dividend yield will also drive total returns. We expect PepsiCo to grow earnings-per-share each year by 6%. In addition, PepsiCo also has a 3.6% current dividend yield.

The combination of valuation changes, earnings growth, and dividends results in total expected returns of 14.6% per year over the next five years.

PepsiCo’s dividend is secure, with a projected payout ratio of about 66% for 2025. This gives PepsiCo enough room to continue increasing the dividend at a rate in line with the growth rate of its adjusted EPS.

Given the total return potential and the company’s overall quality, we rate shares of PepsiCo as a buy.

Final Thoughts

PepsiCo is a very strong business with several category-leading brands. Investing heavily in new products and acquisitions will likely continue growing sales and earnings for many years.

Shareholders should continue to benefit from PepsiCo’s strong business through annual dividend increases. Few other companies in the consumer staples sector can match its dividend growth history. PepsiCo recently achieved Dividend King status in February 2022.

We believe that PepsiCo remains a valuable holding for a dividend growth portfolio.

Additionally, the following Sure Dividend databases contain the most reliable dividend growers in our investment universe:

If you’re looking for stocks with unique dividend characteristics, consider the following Sure Dividend databases:

The major domestic stock market indices are another solid resource for finding investment ideas. Sure Dividend compiles the following stock market databases and updates them monthly:

Thanks for reading this article. Please send any feedback, corrections, or questions to [email protected].


Source link

Here’s Exactly When to Buy and Sell!


Editor’s Note: Anyone familiar with my work knows I’m a numbers guy. I don’t buy and sell stocks based on a news article or a gut feeling. My quantitative stock system helps me identify fundamentally superior stocks best positioned to grow in value. The numbers tell me where to look for the best stocks.

That’s why I’m such an admirer of TradeSmith CEO Keith Kaplan.

To improve his own investing, Keith developed software to help him identify the best times to buy and sell a stock.

In a guest essay today, Keith shares an amazing story about how the system he helped develop saved his portfolio before the Covid crash of 2020, and how it helped him to grow his wealth in the historic run that followed.

After you read this, you’ll want to sign up for Keith’s event on Thursday, February 27 at 8 p.m. Eastern. He’s calling it The Last Melt-Up – and in this special event, you’ll learn how Keith’s system works and why it’s so accurate. You’ll also learn why he’s got his eye on an ultra-rare pattern that has only appeared in the markets three times going back 125 years. You can click here to sign up for your free spot now.

In the meantime, I’ll let Keith share his story and tell you more about the alert that saved his portfolio.

**************************

It was one of the most difficult moments of my professional life … but I had saved my portfolio!

It was early 2020 and I had flown to Florida to meet with a group of 50 of my peers where each of us pitched our best and biggest investment ideas.

Person after person was pitching greedy parts of the market that they believed were ready to soar.

When it was my turn, I told them all “I sold almost all my stocks on Friday.”

As you would imagine, I was not the most popular person in the room.

I urged people to protect their investments and consider warning their subscribers that a bear market was rapidly approaching.

I even showed them proof of how I knew we were headed toward the fastest bear market in history — one that would catch everyone by surprise and destroy years of wealth building.

I showed them the alerts I received and then how accurate these alerts have been over the last 20 years.

I was laughed at and told not to panic. Not a single person in the room wanted to hear what I had to say. And I understand why; the CNN Fear and Greed Index at the time was nearing extreme greed levels.

Why would they want to hear a bearish alarm?

But anyone who acted on my system’s advice saved their portfolio … and then made even more money when the system signaled it was time to get back in.

In the last 20 years, we’ve only made the system better…

And we are on the verge of another change in the market’s direction. One that you can be ahead of, while everyone else depends on outdated indicators.

The Alert that Saved my Portfolio

I remember it like yesterday.

On a Friday, Feb. 27, I had received a big, bearish alert from our system.

It basically said, “Run for the hills and sell your stocks.”

At the time I knew almost nothing about COVID-19 and I didn’t know how markets would react to what was coming.

But I did know that I trust our system, so the very next day, I sold nearly all my stocks.

Over the weekend, a quick stop into Target with my family gave us an early glimpse into the world of panic buying and hoarding we can all remember. We noticed a woman with a cart FULL of nothing but Clorox wipes.

Clearly, there was panic in the air, and we were just starting to see and feel it for the first time.

But I knew I didn’t have to panic about my portfolio.

Our system’s alerts are based on proprietary algorithms we created years ago and that routinely test and update. They’re based on momentum and short- and long-term trends. And they’re eerily accurate!

Here are the five most recent drawdowns prior to that day …

Obviously, a lot has changed since then. Indeed, we experienced the fastest bear market onset in history.

But we also experienced one of the fastest recoveries in the history of markets. We haven’t looked back, except for a few small setbacks.

The Alert that Led to Profits

In 2020, my personal portfolio was saved a huge loss thanks to the indicators I got.

And, just a month later, our indicators did it again, alerting me to a bullish set up in the markets.

This signal has been almost always right over 40 years of use and testing:

By this time the CNN Fear and Greed Index had plummeted to extreme fear and people were nervous.

Heck, I was nervous!

But again, I trusted the math and these signals, and I took action. I started gobbling up stocks that had big pullbacks and were noted “healthy” in our system by their green designation.

Boy was that the right decision!

Look what the market did the rest of the year!

As you can tell, I love our products and can’t wait to reveal more to you over the next few days.

In fact, it all started for us years ago when we invented what I call the “single most important number in investing.” And next week, on Feb. 27 at 8 p.m. Eastern, I’ll be unveiling the prediction in TradeSmith’s 20-year history. You can register to hear this prediction for free right here.

Thank you and all the best.

Warm regards,

Keith Kaplan

CEO, TradeSmith


Source link

Leading Cryptos to Buy Now: Leading Picks Under $2 That Could Skyrocket 20x to 30x in 2025


​The crypto market still offers fascinating prospects for investors, particularly those wishing to invest in low-cost assets with great growth potential. Strategic investors are looking for undiscovered gems priced under $2 that could rise 20x to 30x in value, with the 2025 bull run just around the horizon. Given past trends, projects with strong foundations, increasing popularity, and original use cases will likely significantly increase. From blockchain infrastructure advancements to actual asset tokenization, these five cryptocurrencies are destined for notable expansion in 2025.

Rexas Finance (RXS): The Future of Tokenized Real Estate

Blockchain-powered tokenizing from Rexas Finance (RXS) is transforming real estate investment. The project improves liquidity, accessibility, and cost-effectiveness by letting consumers purchase, sell, and trade digital versions of real estate assets. Rexas Finance makes property investment as simple as trading crypto, unlike conventional real estate investments, which require large funds and complicated documentation. The project’s presale attracted great attention, raising $45,992,965 and selling 449,962,538 RXS tokens. Since the presale price went from $0.03 to $0.20, early investors have already locked in a 6.67x return. After listing on three Tier-1 exchanges on June 19, 2025, at $0.25, analysts estimate RXS might spike 20x to 30x, so it is a must-have for 2025. Furthermore, the $1 million RXS token giveaway is increasing community involvement. Rexas Finance is positioned to take center stage in the real-world asset (RWA) tokenization industry, estimated to exceed $50 billion by 2025.

Cardano (ADA)—Poised for Skyrocketing Growth

Still, one of the most fundamentally robust blockchain initiatives is Cardano (ADA). According to recent Santiment statistics, big investors and whales have been aggressively purchasing ADA, which has resulted in an 11% increase in market capitalization despite a general market decline. ADA is a strong contender for a breakthrough since historically such accumulation patterns followed significant price swings. Grayscale’s recent application for a Cardano ETF indicates that major players see ADA’s long-term potential, which indicates additional institutional interest. Currently trading around $0.82, experts predict ADA will be a top performer in 2025; if acceptance keeps rising, a 20x to 30x price rise is possible.

Stellar (XLM) – Charting a Bullish Path

Stellar (XLM) displays strong positive signals. Its price chart forms a declining wedge pattern, a classic technical predictor of an approaching breakout. The coin has challenged a crucial resistance level of $0.33; it may witness a 30% price increase if it breaks. Stellar is a desirable long-term investment because of its increasing acceptance as a link between conventional finance and blockchain technology. Its network makes it a significant rival in the remittance and banking sectors, allowing quick and cheap cross-border transactions. XLM has the explosive potential to climb in the next bull run at less than $2.

Jupiter (JUP): Enhancing Liquidity in the DeFi Landscape

With a market worth $2.23 billion and a present trading price of $0.84, Jupiter (JUP) is among the most exciting DeFi initiatives. Thanks to increasing acceptance and platform enhancements, the coin has risen 30.2% over the previous month. Given decreasing supply frequently results in price appreciation, a newly accepted proposal to burn 30% of JUP’s production should increase its worth. Furthermore, Jupiter’s deliberate airdrop effort with 2.3 million addresses seeks to grow its user base, generating demand for the coin. As DeFi adoption rises, analysts project JUP might reach $1.50 in 2025 and explode 20x to 30x over the long run.

Tron (TRX) – The Stablecoin Powerhouse

Tron (TRX)—With its network handling a record-breaking $1 billion in fresh USDT minting, the stablecoin powerhouse Tron (TRX) has confirmed itself as a major participant in the stablecoin market. Stablecoin demand inside the Tron ecosystem keeps rising, enhancing its value and acceptance. Currently trading between $0.23 and $0.25, Tron’s price has stayed constant even as whale activity has dropped. However, TRX can witness a phenomenal increase as use continues during the next bull cycle. Given its efficient blockchain and rising developer interest, Tron is positioned as a strong investment under $2 with great 20x to 30x potential.

Conclusion

Mass gains are expected from the upcoming crypto bull run; hence, the strongest prospects usually come from underpriced ventures with solid foundations. Rexas Finance (RXS), Cardano (ADA), Stellar (XLM), Jupiter (JUP), and Tron (TRX) all show special benefits that qualify them as excellent contenders for exponential expansion in 2025. Early investors in these businesses could earn life-changing profits as the crypto industry changes rapidly. Now is the time to prepare for the next wave of market development.

For more information about Rexas Finance (RXS) visit the links below:

Website: https://rexas.com

Win $1 Million Giveaway: https://bit.ly/Rexas1M

Whitepaper: https://rexas.com/rexas-whitepaper.pdf

Twitter/X: https://x.com/rexasfinance

Telegram: https://t.me/rexasfinance

Disclaimer: The views and opinions presented in this article do not necessarily reflect the views of CoinCheckup. The content of this article should not be considered as investment advice. Always do your own research before deciding to buy, sell or transfer any crypto assets. Past returns do not always guarantee future profits.


Source link

4 Highest Yielding Royalty Trusts For 2025


Updated on March 7th, 2025 by Bob Ciura

Oil and gas royalty trusts are now offering exceptionally high distributions to their investors, resulting in much higher yields than the ~1.3% average dividend yield of the S&P 500.

We have created a spreadsheet of high dividend stocks with dividend yields of 5% or more…

You can download your free full list of all securities with 5%+ yields (along with important financial metrics such as dividend yield and payout ratio) by clicking on the link below:


In this article, we will discuss the prospects of the 5 highest-yielding royalty trusts.

Table of Contents

You can instantly jump to any specific section of the article by using the links below:

High-Yield Royalty Trust No. 4: Permian Basin Royalty Trust (PBT)

Permian Basin Royalty Trust is an oil and gas trust, which was founded in 1980. In 2023, about 55% of output was oil and 45% was gas, but 85% of revenues came from oil.

PBT is a combination trust: unit holders have a 75% net overriding royalty interest in Waddell Ranch Properties in Texas, which includes several oil and gas wells; and a 95% net overriding royalty interest in the Texas Royalty Properties, which includes various oil wells.

The trust’s assets are static in that no further properties can be added. The trust has no operations but is merely a pass through vehicle for the royalties. PBT had royalty income of $54.4 million in 2022 and $29.0 million in 2023.

In mid-November, PBT reported (11/12/24) financial results for the third quarter of fiscal 2024. The average realized price of oil significantly improved over the prior year’s period. Given also high operating costs at Waddell Ranch properties in last year’s quarter, distributable income per unit more than doubled, from $0.07 to $0.17.

Click here to download our most recent Sure Analysis report on Permian Basin Royalty Trust (PBT) (preview of page 1 of 3 shown below):


High-Yield Royalty Trust No. 3: Permianville Royalty Trust (PVL)

Permianville Royalty Trust (PVL) was incorporated in 2011 and is based in Houston, Texas. It operates as a statutory trust and owns a net profits interest representing the right to receive 80% of the net profits from the sale of oil and natural gas production from properties located in the states of Texas, Louisiana and New Mexico.

It has a market capitalization of $63 million. The trust’s assets are static in that no further properties can be added. In addition, the trust is passive, as it has no control over operating costs and the rate of production.

In mid-November, PVL reported (11/14/24) financial results for the third quarter of fiscal 2024. Oil and gas volumes grew 27% and 19%, respectively, thanks to new Permian wells but the trust was hurt by excessive costs in previous quarters, which were carried forward to the third quarter.

As a result, distributable income decreased -39% over the prior year’s quarter.

Click here to download our most recent Sure Analysis report on PVL (preview of page 1 of 3 shown below):


High-Yield Royalty Trust No. 2: Cross Timbers Royalty Trust (CRT)

Cross Timbers Royalty Trust is an oil and gas trust (about 50/50), set up in 1991 by XTO Energy. Its unitholders have a 90% net profit interest in producing properties in Texas, Oklahoma, and New Mexico; and a 75% net profit interest in working interest properties in Texas and Oklahoma.

In mid-November, CRT reported (11/13/24) results for the third quarter of fiscal 2024. Gas volumes increased 17% over the prior year’s quarter thanks to timing of receipts of Oklahoma net profit interests but oil volumes declined -23%.

In addition, the average realized price of gas dipped -14%. As a result, distributable cash flow (DCF) per unit decreased 37%.

Click here to download our most recent Sure Analysis report on Cross Timbers Royalty Trust (CRT) (preview of page 1 of 3 shown below):

High-Yield Royalty Trust No. 1: PermRock Royalty Trust (PRT)

PermRock Royalty Trust is a trust formed in late 2017 by Boaz Energy, a company that is focused on the acquisition, development and operation of oil and natural gas properties in the Permian Basin. The Trust benefits from the unique characteristics of the Permian Basin, which is the most prolific oil-producing area in the U.S.

On November 13th, 2024, PermRock Royalty reported third quarter 2024 results for the period ending September 30th, 2024. Net profits income received by the trust was $1.55 million, compared to $1.69 million in Q3 2023. The average realized sale price of oil improved 11% year-over-year, while natural gas plummeted by 23%.

Distributable income for the trust came to $1.34 million, down 9% from $1.47 million in the prior year period and distributable income per unit of $0.11 was lower by a penny from $0.12 in the prior year.

Click here to download our most recent Sure Analysis report on PermRock Royalty Trust (PRT) (preview of page 1 of 3 shown below):

Final Thoughts

On the surface, oil and gas royalty trusts are attractive as they widely offer higher yields than the S&P 500 average.

However, oil and gas prices are infamous for their dramatic swings. Oil prices have been on a downtrend for the past several months.

Therefore, investors should be prepared for much lower distributions from royalty trusts going forward. They should also be aware of the excessive risk of all these trusts near the peak of their cycle.

The ideal time to buy these trusts is during a severe downturn of the energy sector, when these stocks plunge and thus become deeply undervalued from a long-term perspective.

As mentioned above, all the oil and gas trusts are highly risky due to the natural decline of their production and their sensitivity to the prices of oil and gas.

If you are interested in finding high-quality dividend growth stocks and/or other high-yield securities and income securities, the following Sure Dividend resources will be useful:

High-Yield Individual Security Research

Other Sure Dividend Resources

Thanks for reading this article. Please send any feedback, corrections, or questions to [email protected].


Source link

Big Tech Is Spending Billions on Quantum – but I’ve Found the Real Winner…


There’s a crazy thing about innovation.

Tech revolutions often happen at a snail’s pace at first…

And then, one day you wake up and the world looks completely different from what you remember.

Consider electricity.

For thousands of years, people saw this “magical” force streak across the sky as lightning. But no one knew what to do with it.

Progress was slow at first. It took people until the 1600s to start experimenting with static electricity. And it wasn’t until 1871 that the phenomenon became commercially useful with the invention of the first electric motor.

It would take another 76 years for transistors to unlock electricity’s full potential.

But since then, the humble transistor has changed the world. The computers enabled by this technology have helped us fly people to the moon… communicated with satellites millions of miles away… even mapped the number “pi” to 105 trillion digits.

And it’s all thanks to understanding how to tame this “magical” power of electricity to power the millions of logic gates that build the modern microprocessor.

Quantum computing is on the same path.

In yesterday’s Market 360, we discussed the ins and outs of quantum computing – and why it represents the next frontier of the AI Revolution.

Investors need to prepare for what’s coming. That’s why I’m hosting The Next 50X NVIDIA Call summit on Thursday, March 13, at 1 p.m. ET.

You can go here to save your spot now.

After you’ve saved your spot, be sure to send me your biggest questions about quantum computing. I’ve already received a number of great questions, so keep them coming! You can reach us at [email protected] and use the subject line “Quantum computing questions” so that I can be sure to see each one of them.

Make no mistake. This could create a transformational wealth opportunity for investors – like the early stages of the AI Revolution did with NVIDIA Corporation (NVDA). As we’ll discuss today, Big Tech knows this, too – which is why they’re scrambling to prepare.

Quantum’s Transistor Moment

In 1955, physicist Louis Essen switched on the world’s first working quantum machine, the cesium atomic clock.

By blasting finely tuned microwaves at a stream of cesium atoms, Essen and his team forced these atoms into a “superposition” state, where they were in more than one energy state at once… a “quantum state” where they are both grounded and excited. This was perhaps the “electric motor” moment of quantum mechanics – another “magical” force first described by German physicist Max Planck in 1900.

Quantum’s “transistor moment” is now at our doorstep.

Indeed, I’m sure you’ve noticed that three top Big Tech companies have made a big deal about their new “quantum chips” in the past couple of months:

  • Alphabet Inc. (GOOG)
  • Amazon.com Inc. (AMZN)
  • Microsoft Corp. (MSFT)

But which of these companies will actually create the first working “quantum transistor”? And where should investors be putting their money?

In this issue, I’m going to take a closer look at all three of these new quantum chips. We’ll do a little comparing and contrasting in order to figure all that out.

Some of this is going to get pretty technical… but we need to know this stuff to help guide our quantum investing decisions today.

Plus, once you finish reading this, you’re going to have a pretty good idea of why I’m making a certain quantum recommendation… one that could even beat these three heavyweights at their own game.

But first, here’s what I can tell you about these three quantum chips…


Source link

Buckle up for high-stakes jobs report – United States


Written by the Market Insights Team

Trump’s tariff flip-flopping continues to rattle confidence amongst consumers, businesses and financial markets. US policy uncertainty is at its highest level since Covid. The tech-heavy Nasdaq index is now down 10% since hitting record highs last month. The US dollar is on track for its worst week in two years. A weak US jobs report today could further damage the dollar, whilst the euro dominates the FX space on the back of looser fiscal and tighter monetary policy expectations. Given the high noise-to-signal ratio, a scenario-based approach to FX forecasting is more justified than ever.

Tariff pendulum continues to swing

George Vessey – Lead FX & Macro Strategist

Tariffs on, tariffs off, is the name of the game. US President Donald Trump has performed another reversal on tariffs, delaying duties on many goods from Canada and Mexico for a month. This is the second month-long delay Trump granted on his own tariffs and the uncertainty continues to take its toll on financial markets. The tech-heavy Nasdaq index, for example, has fallen 10% from its recent peak, defined as a market correction, whilst the US dollar is on track for its worst week in over two years.

The dollar’s status as a safe-haven asset and reserve currency won’t disappear overnight, but the global shift away from it this week has been eye-opening. The acceleration is mainly a result of Trump’s unpredictable policies undermining confidence in the dollar, but also due to US growth scares and dovish Fed repricing, keeping US yields relatively stagnant compared to G10 peers. On the macro front, the US trade deficit widened to a record high in January, driven by a 10% surge in imports ahead of anticipated tariffs. Additionally, job cuts soared to their highest level since 2020, fuelled by significant layoffs at DOGE. However, initial jobless claims came in below expectations, offering some reassurance.

Today, all eyes are on the US jobs report. The data published last month showed a mixed bag for investors. Hiring slowed but wage growth ticked higher and continued the theme of “heightened inflation anxiety” driven by the tariff war and rising inflation expectations. Headline payrolls came in at 143k, below the 175k consensus. However, upward revisions to the past two months added 100k jobs, and the unemployment rate held at 4.0%. As for today, 170,000 new jobs are expected to have been added in February whilst the unemployment rate is seen holding steady at 4%.

Chart of DXY weekly performances

European outperformance rests on stimulus

Boris Kovacevic – Global Macro Strategist

European and Chinese equities have outperformed their US counterparts this week, signaling the emergence of a new macro narrative—one that favors assets in countries benefiting from both fiscal and monetary stimulus. Germany’s commitment to major defense and infrastructure spending, alongside yesterday’s ECB rate cut by 25 basis points to 2.5%, underscores this shift.

The German 10-year yield has surged a historic 42 basis points this week, while the euro’s 4% rally against the dollar marks one of its strongest gains on record. However, both assets retreated slightly after the ECB’s somewhat hawkish press conference, where policymakers debated the need for further easing. Markets now assign a 50% probability to another rate cut in April. The ECB remains data-dependent, but divisions persist over the neutral rate, with slowing disinflation and stronger growth potentially limiting further cuts. Equity outperformance rests on both the fiscal and monetary support continuing in Europe. The hawkish ECB statements explains why the STOXX 600 is on track to record its first loss in ten weeks.

The ongoing tariff saga adds another layer of uncertainty. The Trump administration’s latest delay on Canadian and Mexican tariffs leaves markets guessing about potential levies on European goods—an outcome that could push the ECB toward continued easing, while a tariff-free environment and fiscal expansion would make a pause more justifiable. EUR/USD has found its resistance at the $1.0850 mark and is now dependent on a weak US nonfarm payrolls report to reclimb its weekly high again.

Chart of EURUSD after Trump elections

Pound firm versus dollar, fragile versus euro

George Vessey – Lead FX & Macro Strategist

The pound remains buoyant versus the US dollar near $1.29, one cent higher than its 5-year average rate. However, due to the huge spending plans unveiled by Germany and the EU and surging European yields, sterling has wilted 2% against the euro this week so far – on track for potentially its biggest weekly loss in two years. GBP/EUR downside momentum might wane at its 50-week moving average, which has been a crucial support for over a year – currently located at €1.1878.

On the macro front this week, the final UK PMI figures confirmed the private sector economy grew modestly in February. The services PMI was revised lightly lower but still beat initial estimates of 50.8 and offsetting the decline in manufacturing. Late last month, we also saw a leading indicator for UK GDP growth hit its highest level since 2017. That said, the British Chambers of Commerce yesterday slashed its forecast for the UK economy due to the tax and trade “double whammy” afflicting UK businesses. But due to the the deteriorating US growth outlook as well, the growth rate differential is narrowing between the US and UK. It’s also led to a sharp increase in the UK-US rate differential as more Fed cuts are priced in. Both factors have contributed to the pound’s latest upswing versus the dollar.

Sterling has climbed into overbought territory versus the dollar, but the implied probability of GBP/USD touching $1.30 before the end of the month has jumped to over 60% from just 14% one week ago, according to FX options market pricing. Moreover, traders have the highest conviction in five years that more gains are in store for the pound over the coming weeks, though gains will be constrained from 1-month onwards due to elevated uncertainty in trade and foreign policy globally.

Chart of GBPUSD vs 10-year yield

Dollar crushed this week, euro shines

Table: 7-day currency trends and trading ranges

Table of FX rates

Key global risk events

Calendar: March 3-7

Table of risk events

All times are in GMT

Have a question? [email protected]

*The FX rates published are provided by Convera’s Market Insights team for research purposes only. The rates have a unique source and may not align to any live exchange rates quoted on other sites. They are not an indication of actual buy/sell rates, or a financial offer.


Source link

Aramco’s Dividend Strategy Reflects Shifting Energy Priorities


The oil giant cut its dividend to balance shareholder payouts with rising capital investments amid lower crude prices and evolving market conditions.

Saudi Arabian Oil, better known as Aramco, is recalibrating its dividend strategy as it navigates weaker oil prices and rising capital investment demands. The world’s largest oil and gas producer plans to distribute $85.4 billion in dividends this year—down about 30% from $124.3 billion in 2024—reflecting a shift in financial priorities.

The company reported a 12% decline in net income, falling to $106.2 billion from $121.3 billion the previous year, citing “lower prices, lower production volume, and weaker downstream margins.” Against this backdrop, Aramco is directing more resources toward long-term growth, particularly in natural gas expansion and infrastructure investment.

Brent crude oil, for example, was recently trading at around $70 a barrel, reflecting a prolonged slide in prices. Three years ago, it was approximately $100 a barrel.

For Aramco and other energy companies, dividend payments must be carefully balanced against factors such as energy prices, global demand, geopolitics, and financial obligations—particularly capital expenditures that support future growth.

Aramco said it plans to invest between $52 billion and $58 billion in capital expenditures in 2025, compared with $53.4 billion last year. A key focus of its capex strategy is expanding natural gas opportunities. The company’s financial guidance underscores that capital investment remains a top priority.

Aramco’s dividend structure consists of two components: a base dividend and a variable dividend tied to performance. The company plans to pay a base dividend of $84.6 billion this year, while the variable dividend is expected to be $880 million—down significantly from around $43 billion in 2023, according to Reuters.

Other energy companies have adopted similar dual-dividend frameworks, providing flexibility when oil and gas prices decline.

At the same time, Aramco said it plans to boost its first-quarter base dividend by 4.2% to $21.1 billion. However, with the variable dividend dropping so sharply, total shareholder payouts will decline compared with last year.

During the company’s fourth-quarter conference call with analysts on March 3, Aramco executives highlighted its substantial dividend distributions in recent years.

“We have paid more dividends than any other listed company over the past five years, with around $440 billion distributed,” President and CEO Amin Nasser said, according to a transcript of the call.

The company’s variable dividend is linked to performance, paying out 50–70% of free cash flow after subtracting the base dividend and external investments. The first-quarter dividend will be at the high end of that range.

The dividend cut doesn’t just impact shareholders—it also affects Saudi Arabia, which holds a majority stake in Aramco and has used dividend proceeds to help fund the country’s economic development.

Additionally, the lower dividend will reduce the stock’s dividend yield.

In a research note this week, Morningstar analyst Allen Good wrote that he had anticipated Aramco would slash its performance-linked dividend “given rising debt, lower oil prices, and increased capital investment.”

However, he added that the lower payout means “Aramco’s yield is much less competitive with American and European global integrated energy companies.”

Aramco executives will undoubtedly be keeping a close eye on this.


Source link

KuCoin introduces KCS Loyalty Level Program with tiered rewards for token holders


KuCoin Launches KCS Loyalty Level Program

Key takeaways:

  • KuCoin’s new KCS Loyalty Level Program introduces four tiers, rewarding users based on their KCS holdings.
  • Benefits include increased staking yields, trading fee discounts, withdrawal fee rebates, and KuCard cashback.
  • To celebrate the launch, KuCoin is hosting airdrops, subscription contests, and exclusive rewards for top-tier participants.

A new loyalty program for KuCoin’s KCS holders

KuCoin, a major global cryptocurrency exchange, has unveiled the KCS Loyalty Level Program, a tiered system designed to improve benefits for users holding and staking the platform’s native token, KCS. This initiative introduces structured incentives, encouraging long-term engagement with KuCoin’s ecosystem.

The program features four tiers—Explorer, Navigator, Voyager, and Pioneer—allowing users to unlock benefits by staking as little as 1 KCS. As users progress through the levels, they gain access to increasingly valuable rewards, reinforcing KCS’s role within the platform.

Key perks of the program include higher staking yields, additional staking bonuses, participation in GemPool activities, discounts on trading fees, rebates on withdrawal fees, KuCard cashback rewards, and expanded zero-interest credit limits for institutional and VIP participants.

Special promotions to mark the launch

To celebrate the introduction of the KCS Loyalty Level Program, KuCoin is launching several promotional events:

  • Airdrop for existing KCS holders – Eligible users who meet a predefined holding threshold will receive an automatic airdrop to their staking accounts.
  • Subscription contest for new holders – New participants in the program can compete for rewards, with prizes distributed based on leaderboard rankings.
  • Exclusive Pioneer-level bonuses – Users who achieve the highest tier can participate in additional promotions to win KCS tokens and trading coupons.

“This new loyalty program underscores our commitment to enhancing user benefits and solidifying the market value of our platform coin. We’re dedicated to providing our users with more ways to benefit from being part of the KuCoin ecosystem.” —Alicia Kao, Managing Director of KuCoin

The bottom line

With the launch of the KCS Loyalty Level Program, KuCoin is providing new incentives for both existing and potential KCS holders, integrating staking benefits with broader platform utilities. As the cryptocurrency market evolves, this program aims to foster a more engaged and loyal user base while strengthening the overall value of KCS within the KuCoin ecosystem.


Source link

2025 Kevin O’Leary Complete Stock Portfolio List & Top 10 Dividend Picks Now


Updated on March 7th, 2025 by Bob Ciura

Kevin O’Leary is Chairman of O’Shares Investment Advisors, but you probably know him as “Mr. Wonderful”.

He can be seen on CNBC as well as the television show Shark Tank. Investors who have seen him on TV have likely heard him discuss his investment philosophy.

Mr. Wonderful looks for stocks that exhibit three main characteristics:

  1. First, they must be quality companies with strong financial performance and solid balance sheets.
  2. Second, he believes a portfolio should be diversified across different market sectors.
  3. Third, and perhaps most important, he demands income—he insists the stocks he invests in pay dividends to shareholders.

You can download the complete list of all of O’Shares Investment Advisors stock holdings by clicking the link below:


OUSA owns stocks that display a mix of all three qualities. They are market leaders with strong profits, diversified business models, and they pay dividends to shareholders.

The list of OUSA portfolio holdings is an interesting source of quality dividend growth stocks.

This article analyzes the fund’s largest holdings in detail.

Table of Contents

The top 10 holdings from the O’Shares FTSE U.S. Quality Dividend ETF are listed in order of their weighting in the fund, from lowest to highest.

No. 10: Cisco Systems (CSCO)

Dividend Yield: 2.6%

Percentage of Portfolio: 3.36%

Cisco Systems is the global leader in high performance computer networking systems. The company’s routers and switches allow networks around the world to connect to each other through the internet. Cisco also offers data center, cloud, and security products.

On February 12th, 2025, Cisco announced a 2.5% dividend increase in the quarterly payment to $0.41. That same day, Cisco announced results for the second quarter of fiscal year 2025 for the period ending January 25th, 2025.

For the quarter, revenue grew 9.4% to $13.99 billion, which beat estimates by $120 million. Adjusted earnings-per-share of $0.94 compared favorably to adjusted earnings-per-share of $0.87 in the prior year and was $0.03 ahead of expectations.

Excluding the company’s recent acquisition of Splunk, total revenue grew 11% for the quarter. Networking fell 3% while Security grew 117%, Observability was up 47%, and Collaboration improved 1%. By region, the Americas increased 9%, Europe/Middle East/Africa was higher by 11%, and Asia-Pacific/Japan/China was up 8%.

Click here to download our most recent Sure Analysis report on Cisco Systems (CSCO) (preview of page 1 of 3 shown below):

No. 9: McDonald’s Corporation (MCD)

Dividend Yield: 2.2%

Percentage of OUSA Portfolio: 3.53%

McDonald’s is the world’s leading restaurant chain with 41,822 locations in about 119 countries at end of 2022. The highest store counts are in the US (13,449), China (5,903), Japan (2,982), France (1,560), and Canada (1,466).

Approximately 95% of the stores are franchised or licensed and the rest are company owned. However, the company owns about 55% of the real estate and 80% of the buildings in its network.

Total system sales were approximately $129.5B in 2023 and total revenue was around $25.5B in 2023.

On February 10th, McDonald’s reported Q4 2024 results. Total revenue came in at $6.38 billion, flat compared to Q4 2023, on 2% higher system-wide sales (adjusting for currency).

Diluted earnings were flat at $2.80 per share compared to $2.80 per share in comparable periods on pre-tax charges.

On a geographic basis, comparable sales were -1.4% in the US, +0.1% in the International Operated Markets, and +4.1% in the International Developmental Licensed Markets.

The firm’s focus on value deals and the McValue platform should boost traffic and sales.

Click here to download our most recent Sure Analysis report on MCD (preview of page 1 of 3 shown below):


No. 8: Merck & Co. (MRK)

Dividend Yield: 3.4%

Percentage of OUSA Portfolio: 3.81%

Merck & Company is one of the largest healthcare companies in the world. Merck manufactures prescription medicines, vaccines, biologic therapies, and animal health products.

Merck employs 68,000 people around the world and generates annual revenues of more than $63 billion.

Source: Investor Presentation

On February 4th, 2025, Merck announced fourth quarter and full year results for the period ending December 31st, 2024.

For the quarter, revenue improved 7% to $15.6 billion, which was $110 million above estimates. Adjusted earnings-per-share was $1.72 compared to $0.03 the prior year and $0.04 more than expected.

For the year, revenue increased 7% to $64.2 billion while adjusted earnings-per-share of $7.65.

Keytruda, which treats cancers such as melanoma that cannot be removed by surgery and non-small cell lung cancer, continues to be the key driver of growth for the company as sales for the drug were up 19% to $7.8 billion during the period.

Click here to download our most recent Sure Analysis report on MRK (preview of page 1 of 3 shown below):


No. 7: Alphabet Inc. (GOOGL)

Dividend Yield: 0.47%

Percentage of OUSA Portfolio: 3.92%

Alphabet is a technology conglomerate that operates several businesses such as Google search, Android, Chrome, YouTube, Nest, Gmail, Maps, and many more. Alphabet is a leader in many of the areas of technology that it operates.

On February 4th, 2025, Alphabet announced fourth quarter and full year results for the period ending December 31st, 2024. For the quarter, revenue grew 11.8% to $96.5 billion, but this was $170 million less than expected.

Adjusted earnings-per-share of $2.15 compared very favorably to $1.64 in the prior year and was $0.02 above estimates. For the year, revenue grew 14% to $350 billion while adjusted earnings-per-share of $8.04 compared to $5.80 in 2023.

Most businesses performed well during the period. For the quarter, revenue for Google Search, the largest contributor to results, grew 12.5% to $54 billion. YouTube ads increased 13.8% to $10.5 billion while Google Network declined 4.1% to just under $8 billion.

Click here to download our most recent Sure Analysis report on GOOGL (preview of page 1 of 3 shown below):


No. 6: MasterCard Inc. (MA)

Dividend Yield: 0.57%

Percentage of OUSA Portfolio: 4.13%

MasterCard is a world leader in electronic payments. The company partners with 25,000 financial institutions around the world to provide an electronic payment network. MasterCard has more than 3.1 billion credit and debit cards in use.

On January 30th, 2025, MasterCard announced fourth quarter and full year results for the period ending December 31st, 2024.

For the quarter, revenue improved 15.4% to $7.5 billion, which was $120 million above estimates. Adjusted earnings-per-share of $3.82 compared favorably to $3.18 in the prior year and was $0.13 more than expected.

For the year, revenue grew 12% to $28.2 billion while adjusted earnings-per-share of $14.60 compared to $12.26 in 2023.

On a local currency basis, gross dollar volumes for the quarter grew 12% worldwide to $2.56 trillion during the quarter, with the U.S. improving 9% and the rest of the world higher by 13%.

Cross border volumes remained strong, growing 20% from the prior year and 17% from Q3 2024.

Click here to download our most recent Sure Analysis report on Mastercard (preview of page 1 of 3 shown below):

No. 5: Microsoft Corporation (MSFT)

Dividend Yield: 0.86%

Percentage of OUSA Portfolio: 4.52%

Microsoft Corporation manufactures and sells software and hardware to businesses and consumers. Its offerings include operating systems, business software, software development tools, video games and gaming hardware, and cloud services.

In late January, Microsoft reported (1/29/25) financial results for the second quarter of fiscal 2025 (its fiscal year ends June 30th).

The company grew its revenue 12% over the prior year’s quarter. Growth came from Intelligent Cloud and Productivity & Business Processes, which grew 19% and 14%, respectively.

Sales of Azure, Microsoft’s high-growth cloud platform, grew 31%. Earnings-per-share grew 10%, from $2.94 to $3.23, and exceeded the analysts’ consensus by $0.13.

Click here to download our most recent Sure Analysis report on MSFT (preview of page 1 of 3 shown below):


No. 4: Johnson & Johnson (JNJ)

Dividend Yield: 3.0%

Percentage of OUSA Portfolio: 4.54%

Johnson & Johnson is a diversified health care company and a leader in the area of innovative medicines and medical devices Johnson & Johnson was founded in 1886 and employs nearly 132,000 people around the world.

On January 22nd, 2025, Johnson & Johnson announced fourth quarter and full year results for the period ending December 31st, 2024.

Source: Investor Presentation

For the quarter, revenue grew 5.1% to $22.5 billion, which beat estimates by $50 million. Adjusted earnings-per-share of $2.04 compared to $2.29 in the prior year, but this was $0.02 above expectations.

For the year, revenue grew 4.3% to $88.8 billion while adjusted earnings-per-share of $9.98 was up slightly from the prior year. Results included adjustments related to the costs of acquisitions.

Click here to download our most recent Sure Analysis report on JNJ (preview of page 1 of 3 shown below):


No. 3: Home Depot (HD)

Dividend Yield: 2.5%

Percentage of OUSA Portfolio: 4.95%

Home Depot was founded in 1978 and since that time has grown into a juggernaut home improvement retailer with over 2,300 stores in the US, Canada and Mexico that generate around $153 billion in annual revenue.

Home Depot reported fourth quarter 2025 results on February 25th, 2025. The company reported sales of $39.7 billion, up 14% year-over-year. Comparable sales in the quarter increased 0.8%.

Net earnings equaled $3.0 billion, or $3.02 per share, compared to $2.8 billion, or $2.82 per share in Q4 2023. Adjusted EPS was $3.13.

Average ticket improved 0.3% compared to last year, from $88.87 to $89.11. Additionally, sales per retail square foot rose 1.2% from $550.50 to $556.90.

The company spent $649 million on common stock repurchases in 2024, compared to $8.0 billion in the prior year.

Click here to download our most recent Sure Analysis report on HD (preview of page 1 of 3 shown below):


No. 2: Apple (AAPL)

Dividend Yield: 0.42%

Percentage of OUSA Portfolio: 5.14%

Apple is a technology company that designs, manufactures, and sells products such as iPhones, iPads, Mac, Apple Watch and Apple TV. Apple also has a services business that sells music, apps, and subscriptions.

On January 30th, 2025, Apple reported financial results for the first quarter of fiscal year 2025 (Apple’s fiscal year ends the last Saturday in September).

Total sales grew 4% over the prior year’s quarter, to a new record of $124.3 billion, thanks to sustained growth in iPhone, iPad and Wearables across all regions.

Earnings-per-share grew 10%, from $2.18 to $2.40, and exceeded the analysts’ consensus by $0.05. Notably, Apple has missed the analysts’ estimates only once in the last 25 quarters.

Going forward, Apple’s earnings growth will be driven by several factors. One of these is the ongoing cycle of iPhone releases, which creates lumpy results. In the long run, Apple should be able to grow its iPhone sales, albeit in an irregular fashion.

Click here to download our most recent Sure Analysis report on AAPL (preview of page 1 of 3 shown below):

No. 1: Visa Inc. (V)

Dividend Yield: 0.70%

Percentage of OUSA Portfolio: 5.86%

Visa is the world’s leader in digital payments, with activity in more than 200 countries. The company’s global processing network provides secure and reliable payments around the world and is capable of handling more than 65,000 transactions a second.

On January 30th, 2025, Visa reported first quarter 2025 results for the period ending December 31st, 2024. (Visa’s fiscal year ends September 30th.)

For the quarter, Visa generated revenue of $9.5 billion, adjusted net income of $5.5 billion and adjusted earnings-per-share of $2.75, marking increases of 10%, 11% and 14%, respectively.

These results were driven by a 9% gain in Payments Volume, a 16% gain in Cross-Border Volume and an 11% gain in Processed Transactions. Visa processed 63.8 billion transactions in the quarter.

Click here to download our most recent Sure Analysis report on Visa (preview of page 1 of 3 shown below):

Final Thoughts

Kevin O’Leary has become a household name due to his appearances on the TV show Shark Tank. But he is also a well-known asset manager, and his investment philosophy largely aligns with Sure Dividend’s.

Specifically, Mr. Wonderful typically invests in stocks with large and profitable businesses, with strong balance sheets and consistent dividend growth every year.

Not all of these stocks are currently rated as buys in the Sure Analysis Research Database, which ranks stocks based on expected total return due to a combination of earnings per share growth, dividends, and changes in the price-to-earnings multiple.

However, several of these 10 stocks are valuable holdings for a long-term dividend growth portfolio.

Additional Resources

If you are interested in finding more high-quality dividend growth stocks suitable for long-term investment, the following Sure Dividend databases will be useful:

The major domestic stock market indices are another solid resource for finding investment ideas. Sure Dividend compiles the following stock market databases and updates them monthly:

Thanks for reading this article. Please send any feedback, corrections, or questions to [email protected].


Source link

This Contrarian Indicator Strongly Suggests Stocks Could Surge 30%


Maybe we should follow Buffett’s advice and be greedy now when others are fearful

The stock market is crashing right now. But one contrarian indicator suggests that stocks could be close to a major bottom – before they go on to soar about 30% over the next 12 months. 

You’ve probably heard Warren Buffett’s famous saying: “Be greedy when others are fearful.” 

Others are certainly fearful right now. According to the weekly American Association of Individual Investors (AAII) survey, ~60% of individual investors are feeling bearish on the market right now. 

Let’s put that number in context… The AAII has been conducting this survey since the late 1980s. In that time, the percentage of bearish investors in the survey has surpassed 60% only six times before. We saw surges like this twice in late 1990, twice during the 2008 financial crisis, and twice during 2022’s red-hot inflation plight. 

In other words, investor sentiment is historically negative right now. 

Who can blame them? 

We’re in the midst of the biggest global trade war in nearly a century. Layoff announcements last month spiked to their highest level since July 2020, surging 245% to 172,017. Consumer sentiment is crashing, -9.8% from January, according to the University of Michigan’s survey. Federal spending cuts are rattling the job market. One estimate for U.S. GDP growth has plunged from +2.3% last quarter to -2.8% this quarter. 

Things look bleak right now. No wonder investors feel so bearish. 

But history suggests that when investors are feeling this bearish, it is always a good time to be buying stocks… 


Source link

Copyright © 2023 | Powered by WordPress | Coin Market Theme by A WP Life