Technology’s Creepy Next Step | InvestorPlace


Technology’s spooky next step … enormous potential market size … the easiest way to invest today … nervous about a market crash? Keith Kaplan has you covered

In the pantheon of business/investing clichés, high on the list is the phrase immortalized by hockey legend Wayne Gretzky:

I skate to where the puck is going, not where it has been.

The quote has been recycled and mangled by countless investment professionals in PowerPoint presentations for years.

However, it accurately reflects how wise investors set themselves up for life-changing investment returns.

So, where is the puck going today?

Here’s a clue from Tesla CEO Elon Musk:

“[This cutting-edge technology product] will be overwhelmingly the value of the company” with “the potential to be north of $10 trillion in revenue.”

Got your guess?

Sci-Fi meets real life

Congrats if you answered “humanoids.”

Humanoids are advanced robotic machines that can mirror human movements, reasoning, and day-to-day activities. They sit at the convergence of multiple technological trends: AI, biomechanics, machine learning and sensor connectivity.

Whether you think they’re cool or creepy, they’re coming…and bringing with them a multi-trillion-dollar investment opportunity.

Let’s jump to our technology expert, Luke Lango:

These creations are finally stepping out of science fiction and into reality, possibly poised to become the most disruptive AI advancement yet.

From factory floors to elder care, these machines could easily reshape industries, redefine labor… maybe even challenge what it means to be human…

Everyone who’s anyone in the tech world is betting on humanoid robots being the next big AI breakthrough. 

Tesla’s Optimus humanoid is the most visible example. And as noted earlier, Musk believes the future of Tesla isn’t in electric cars, it’s in humanoids.

Picture of Tesla’s Optimus humanoid

Source: @Tesla

Optimus is already being used inside Tesla factories to complete a variety of tasks. Reports suggest Tesla will sell them to outside companies next year.

And after that, they’re headed to a household near you.

Here’s Luke:

We could soon have our own personal humanoid robot assistant in our homes, doing everything from unloading groceries and cleaning to safeguarding our house while we’re away. 

It’s not just Tesla – all the Big Tech players are moving on humanoids

Luke points toward, Meta, Apple, Alphabet, Nvidia, and OpenAI as just a few of the companies working on aspects of humanoid technology.

Meanwhile, many private companies are involved as well. A Polish startup called Clone Robotics just released a video of “Protoclone.” This is its “faceless, anatomically accurate synthetic human.”

Image of Protoclone” from a Polish startup called Clone Robotics

Source: @clonerobotics

Whether this thrills or terrifies you, some version of it is headed your way over the next 5-10 years.

Sizing the market potential

Let’s go to ETF provider and research shop, GlobalX:

The potential market opportunity for humanoids is massive, and it’s accelerating.

Tesla CEO Elon Musk and industry stakeholders believe there could be over 1 billion humanoids on Earth by the 2040s.

While adoption of single-purpose collaborative robots (cobots) is already widespread in industrial settings, the potential of general-purpose humanoid robotics remains largely untapped, with their appeal being their versatility.

Humanoids are now a tangible reality, capable of working in diverse settings like hazardous factories, and elderly homes, bringing innovative solutions to sectors like logistics, manufacturing, and healthcare.

Given the widespread potential use cases for industrial humanoids, GlobalX puts the total industrial addressable market size at nearly $2 trillion over the next decade.

But the market for household humanoids could be even bigger. GlobalX estimates 15% household penetration and a price point of $10,000 – $15,000. That results in a market size of almost $3 trillion by 2035.

So, how do you invest?

We profiled the easiest way to invest back in September.

Regular Digest readers will recall an issue in which I shared part of an internal email from InvestorPlace’s CEO Brian Hunt to a few members of our leadership team.

Brian described the technological advancements coming (like humanoids), the potential for market volatility, but the even greater potential to make enormous wealth over the next five to 10 years.

With that as our context, here’s Brian from that email with the most effortless way to ride this trend:

If you want to make it simple, easy, and powerful, just look up the five largest AI/robotics ETFs and buy them in equal parts and go to sleep for a while. Maybe throw in some QQQ.

Ignore the corrections. They will be painful but temporary.

This tailwind will blow with hurricane force.

As our experts make their single-stock humanoid recommendations over the coming quarters, we’ll highlight them for you. For now, Luke is eyeing the next step in the evolution toward humanoids – self-driving cars:

The next stage of the AI Revolution has begun. 

But it’s about more than just humanoid robots unloading groceries or doing factory work. It also includes robotic driving systems – like self-driving cars. 

This future may still seem many years away. But it’s already a reality… Of course, the arrival of the Age of Autonomous Vehicles also means the arrival of huge opportunities in AV stocks. 

If you’d like a deeper dive into the opportunity, Luke just put together a special informational presentation focused solely on the Autonomous Vehicle Revolution. You can check it out here.

What if you can’t handle the market corrections that Brian referenced?

Not everyone has a decade-long investment horizon.

What if you’re a few years from retirement and can’t afford the type of painful pullback Brian referenced?

What if you’re saving for a downpayment on a home, or a child’s tuition, or an aging parent’s healthcare needs, and you can’t absorb a haircut of, say, 30% on your capital?

You need a tool to help you sidestep the worst of a bear market crash. And that’s where the quant-based market tools from our corporate partner, TradeSmith, come in.

Here’s a quick story from TradeSmith’s CEO Keith Kaplan to illustrate:

It was early 2020 and I had flown to Florida to meet with a group of 50 of my peers where each of us pitched our best and biggest investment ideas.

When it was my turn, I told them all “I sold almost all my stocks on Friday.”

As you would imagine, I was not the most popular person in the room.

I urged people to protect their investments and consider warning their subscribers that a bear market was rapidly approaching.

I even showed them proof of how I knew we were headed toward the fastest bear market in history — one that would catch everyone by surprise and destroy years of wealth building.

I showed them the alerts I received and then how accurate these alerts have been over the last 20 years.

I was laughed at and told not to panic. Not a single person in the room wanted to hear what I had to say.

But anyone who acted on my systems advice saved their portfolio.

Keith was using a quant-based trading tool that sent him “bear market” alerts.

Here’s an example of what he saw on Friday February 27, 2020…

an example of a quant-based trading tool that sent Keith “bear market” alerts.an example of a quant-based trading tool that sent Keith “bear market” alerts.

…which was shortly before the S&P 500 suffered its steepest plunge in the Covid crash…

Chart showing when bear market alerts came to Keith before the worst of the Covid drawdownChart showing when bear market alerts came to Keith before the worst of the Covid drawdown

Back to Keith:

In 2020, my personal portfolio was saved a huge loss thanks to the indicators I got.

Next Thursday at 8 PM ET, Keith is holding an event to explain how this tool works, and how it could help protect your wealth from a similar crash

If protecting the money that you already have is as important as generating new investment gains, this event is for you.

That said, I’ll point out that this same tool works in reverse – notifying investors when to buy back in after a crash.

Returning to Keith, here he is describing what happened not long after those sell alerts arrived:

Just a month later, our indicators did it again, alerting me to a bullish set up in the markets.

Image of the buy alert that Keith got after the Covid stock market bottomImage of the buy alert that Keith got after the Covid stock market bottom

By this time the CNN Fear and Greed Index had plummeted to extreme fear and people were nervous.

Heck, I was nervous!

But again, I trusted the math and these signals, and I took action. I started gobbling up stocks that had big pullbacks and were noted “healthy” in our system by their green designation.

Boy was that the right decision!

As you know, the S&P would go on to soar nearly 70% from its March 2020 low through the end of that year.

Chart showing the S&P climbing almost 70% form its 2020 low to the end of the year

Source: TradingView

I’ll bring you more on TradeSmith’s market timing tool over the next few days, but to reserve your seat for next Thursday’s presentation right now, click here.

During the event, Keith will walk through how this tool helps you know:

  • When to buy a stock
  • How much of a stock to buy
  • When to sell a stock
  • And how risky that stock is – how much movement you should expect

He’s also going to unveil the biggest market prediction in his company’s 20-year history.

It’s all next Thursday at 8 PM ET.

More on this to come…

In the meantime, start looking into humanoids. It’s going to be a big one.

Have a good evening,

Jeff Remsburg


Source link

Loonie holds steady on US dollar soft patch – United States


Written by the Market Insights Team

Between rumors and dollar softness

Kevin Ford –FX & Macro Strategist

Despite the U.S. ISM services PMI (a measure of U.S. service sector activity) exceeding expectations in February, the narrative of a U.S. economic slowdown, coupled with Germany’s significant shift in fiscal policy, has driven markets to adopt a short-term bearish stance on the U.S. dollar. The DXY index has continued to struggle, losing approximately 2.8% in the last few days. This decline has capped gains for the Loonie above the 1.445 level, which has eased some of its tariff premium amid confirmation that President Trump is exempting automakers from newly imposed tariffs on Mexico and Canada for one month, and renewed hopes that tariffs could be lifted altogether if an agreement is reached soon. While the Loonie remains in uncertain territory and seeks firmer footing on trade policy, it has, for now, benefited from tariff rumors and the unexpected shift in U.S. dollar sentiment.

Altogether, the recent U.S. macro data published this week (ISM Services PMI, ISM Prices Paid, S&P Manufacturing PMI, and ISM Manufacturing) challenges the market narrative of an economic slowdown. This Friday’s payroll data will provide a more complete picture in what has been seen as a key test of the U.S. economy, amid fears of cooling following two years of failed recession predictions. The two-year Treasury yield has rebounded above 4%, reaching 4.03%, in response to this week’s positive macro news. The narrative of a U.S. economic slowdown has gained traction, supported by the Atlanta Fed GDP nowcast. However, given the indicator’s inherent volatility, it may serve as a key variable in shaping investor sentiment ahead of next month’s data, which will account for recent tariff developments.

There is also speculation that payroll data may eventually reflect the impact of DOGE’s federal employee layoffs, which number at least in the tens of thousands. However, these layoffs are unlikely to significantly influence this Friday’s payroll report, which reflects February’s data. Their effect may instead show up in March payroll figures, expected next month.

The USD/CAD is trading close to its 60-day SMA of 1.436 and has found some around the 1.433 level. In the near term, rebounds toward the 1.443 level could present shorting opportunities, especially if no significant tariff news emerges and U.S. dollar weakness persists.

The next 36 hours will be packed with market-moving events, including the ECB policy meeting outcome, remarks from U.S. Secretary Scott Bessent, key Fedspeak led by Chair Jerome Powell, the U.S. jobs report, and additional data releases from Europe, Canada and the U.S.

Chart: US slowdown scenario reflected in Fed pricing.

Tearing down the black zero and euro bears

Boris Kovacevic – Global Macro Strategist

This is what European investors have eagerly been waiting for. Germany’s likely next coalition of the CDU and SPD is preparing for a major fiscal expansion, potentially widening the deficit to 4% of GDP over the next decade. While details remain unclear and implementation risks are high, the plan aims to bolster military deterrence, drive economic recovery, and reshape Germany’s lagging infrastructure.

Around €500 billion could potentially be available for investment over the next ten years. How much of this will go into the expansion of the military complex is unclear. However, a report from the European Commission estimated that about €800 billion or 4.5% of the EU’s GDP could be mobilized in the coming years. To illustrate how significant the likely adjustment of the German black zero (rule of not increasing debt levels) is, we can take a look at their market impact. The 10-year government bond yield surged by an incredible 28 basis points to 2.8%. This is the largest single-day increase in financing costs since the reunification of East and West Germany in the 1990s.

It is also safe to say that no analyst saw the euro surging by 4% this week. However, we have consistently highlighted two key points over the past few weeks: first, that the dollar’s tariff-driven gains were likely to lose momentum as the US economy slowed, and second, that European pessimism had reached extreme levels—making positive surprises far more impactful on markets than any disappointing data or news. The German defense bazooka and signs that the Trump administration is monitoring the impact of tariff announcements on markets and the economy have pushed EUR/USD to the highest level this year above $1.08.

From now on, we warn on turning too optimistic too soon. First, the adjustment of the deficit rule needs a 2/3 majority in the German parliament which is still not guaranteed. Second, the global (US vs. RoW) tariff war has just started. Both can still act as headwinds for the euro. Still, the real rate differential makes it clear that levels such as $1.07 or $1.08 are not unjustified.

Chart: Real rates are supportive for euro now.

Dollar down 4% in 2025

Boris Kovacevic – Global Macro Strategist

Yesterday was probably the first trading session of the year in which global markets were not driven by developments in the US, but by the news flow coming out of Europe. The proposed increase of German defence spending and signs that the US economy are slowing have put the dollar on track for its worst week since November 2022.

The 3% drawdown is happening despite Trump’s rhetoric becoming more hawkish. This is likely due to two factors. First, investors are looking beyond the short-term safe haven flows and are asking what damage tariffs will do to the US economy. Second, despite this week’s tariff increases on Mexico, Canada, and China, potential exemptions and the undefined duration of the tariffs continue to confuse investors. Statements by the Trump administration have signalled that they are watching the impact of tariffs on markets and the economy. The White House excluded automakers from the newly imposed tariffs on Mexico and Canada for example. Could that mean that a large enough drop in equity prices or economic momentum could make Trump pivot?

Economic data came in mixed yesterday. The services sector beat forecasts and expanded modestly. Anxiety is high but the employment index rose from 52.3 to 53.9. This does contradict the ADP report, which showed that private hiring fell to the lowest level since July at 77,000. Against this ambiguous backdrop, all eyes will be on the nonfarm payrolls report tomorrow. The dollar needs an upside surprise on the jobs figure to stop the bleeding.

Chart: Q1 the polar opposite of Q4

Pound now 7% higher than January low

George Vessey – Lead FX & Macro Strategist

As the US dollar dump continues, GBP/USD marches to fresh 4-month highs above the $1.29 handle. The pair has broken above key resistance levels including key moving averages like the closely watched 200-day and 200-week moving averages, which is a bullish signal. Moreover, in FX options markets, short-term risk reversals, favouring further sterling strength, have surged to their highest in around five years.

Expectations of the US dollar outperforming on escalating trade war tensions are fading as investors focus more on the negative repercussions on the US economy, with stagflation fears overwhelming. Instead of safe haven USD demand, traders are focused on a recent slowdown in US data, versus improvement in UK and European data, and the potential for relative outperformance between the economies. This is also having a positive impact on interest rate differentials between Europe and the UK versus the US, given the rise in Fed easing bets. Moreover, the spillover effect from surging German bund yields as a result of the proposed bazooka spending plan, saw the UK 10-year yield jump by the most in over a year yesterday, to over 1-month highs. This sent UK-US 10-year spreads soaring to an 18-month high, which has helped the pound’s rally against the battered and bruised US dollar.

But the near 7% climb from the low of $1.21 in January, and the 2.6% rally this week has pushed the pound into the overbought zone according to the 14-day relative strength index. A period of consolidation or a correction lower may be in the offing, but the psychological $1.30 level now serves as next resistance. Elsewhere, GBP/EUR has dropped 1.5% this week after enduring its biggest single day loss in five months as stronger flows into the euro dominate.

Chart: Short-term GBP sentiment most bullish since 2020

Pound now 7% higher than January low

Table: 7-day currency trends and trading ranges

7-day currency trends and trading ranges.

Key global risk events

Calendar: March 03-07

Key global risk events calendar.

All times are in ET

Have a question? [email protected]

*The FX rates published are provided by Convera’s Market Insights team for research purposes only. The rates have a unique source and may not align to any live exchange rates quoted on other sites. They are not an indication of actual buy/sell rates, or a financial offer.


Source link

Kuwait: Balancing Revenue Growth With Stability


Kuwait’s economy is undergoing critical transformation as the authorities implement long-awaited reforms to develop the non-oil sector and diversify income. 

The Kuwaiti economy is at a turning point. In early February, the Cabinet approved a draft budget for fiscal year 2025-2026, signaling an 11% year-over-year increase in the deficit on slightly lower revenues. The proposal, still awaiting the approval of Emir Mishal Al-Ahmad Al-Jaber Al-Sabah, comes as the Persian Gulf state grapples with the need to diversify the economy in the face of persistent dependence on oil production.

Kuwait’s economy contracted by 1% in 2024 following a 3.6% decline during a 2023 recession. With hydrocarbons accounting for 90% of exports and government revenue, economic performance remains closely tied to OPEC+ production policy, global demand, and competitor output. While the World Bank projects GDP growth will surpass 2% this year, recent calls from US President Donald Trump to cut global oil prices are pressing Kuwait to accelerate its diversification efforts.

For years, political gridlock has stalled reforms. Since 2020, the Cabinet has resigned 10 times and Kuwait has held four legislative elections. But a shift is underway. Last May, the emir dissolved Parliament and partially suspended the constitution for up to four years, a dramatic move aimed at fast-tracking key structural reforms in coordination with international institutions.

“We were very skeptical in the beginning, because they made promises before, but we can see the actions and seriousness about certain reforms,” says Ahmad Al-Duwaisan, acting CEO and general manager of Corporate Banking at Al Ahli Bank of Kuwait (ABK).

Game-changing transformations such as cutting public-sector wages and subsidies, which account for 80% of total spending; introducing a value-added tax (VAT); updating the emirate’s mortgage law (see sidebar, page 78); and passing a new debt law aimed at allowing Kuwait to borrow on international markets, are still under discussion. But some legislation has been approved, signaling momentum toward reform.

In line with the Organization for Economic Cooperation and Development’s Pillar Two requirements on minimum tax rules, Kuwait is introducing a 15% corporate tax for foreign firms with revenues exceeding $750 million in at least two of the last four years. Finance Minister Noora Al-Fassam estimates the tax will target over 300 companies, raising up to $825 million annually.

“This is part of a government strategy to build a more diversified economy, attract foreign investment, and create jobs for citizens,” Al-Fassam told the local media. It also shows Kuwait is “serious in going ahead with the fiscal and economic reforms.”

While some multinationals may look to increase local partnerships or relocate regional headquarters away from Kuwait to mitigate compliance costs, the overall objective of the new measures is to position Kuwait as a competitive business hub, compliant with best global and regional practices.

“The alignment of Kuwait with global tax standards could improve credibility at a global stage and prevents the country from being seen as a tax haven for foreign investors, which could drive more sustainable and high quality FDI [foreign direct investment] inflows,” says Ali Khalil, CEO of Markaz, a Kuwaiti asset management and investment bank. “In addition, this reform sets the base for the implementation of further tax reforms, which could diversify revenue sources for the government. The additional revenue would likely be ploughed back into the non-oil economy to aid in further improving business infrastructure.”

In parallel, the government aims to improve investment frameworks and litigation procedures, and ease foreign ownership rules.

“Kuwait’s economic reforms are paving the way for significant opportunities for financial institutions,” says Khaled Yousef Al-Shamlan, CEO of Kuwait Finance House (KFH), the emirate’s second largest bank, behind the National Bank of Kuwait. “Initiatives aimed at enhancing the business environment, such as public-private partnerships and regulatory simplifications, will facilitate greater investment inflows.”

Infrastructure Revamp

Improving infrastructure is also a priority. Kuwait’s road system, once ranked the worst in the Gulf Cooperation Council (GCC), will be revamped thanks to $1.3 billion in maintenance contracts signed last October with 18 companies.

Project activity has surged in sectors including housing, health, water, waste management, electricity, and oil and gas (see sidebar, page 80). Last year, $8.7 billion worth of projects were awarded, marking a 44% year-over-year increase and the highest value since 2017, according to reports from National Bank of Kuwait (NBK), the emirate’s largest bank. Along with the 2025-2026 budget, the Cabinet has approved close to $5.6 billion for 124 projects.

KAMCO Invest, one of Kuwait’s leading non-banking financial institutions, expects “thriving economic activity, government’s resolve to execute projects before the deadlines, a supportive and strong banking sector, an expected fall in interest rates, stability in the regional geopolitical scenario, elevated oil prices, and supportive government policies for private sector participation” will continue to drive markets this year.

Overall, Kuwait has $121 billion worth of planned projects in the pipeline, with several to be awarded this year. 

Al-Shamlan, KFH Group: Economic reforms are paving the way for significant opportunities for financial institutions.

Among the most recent, Turkey’s Proyapi Consulting in January won the first phase of a 110-kilometer railway tender to connect Kuwait to Saudi Arabia by 2030. The new line will be part of a broader, 2,100-kilometer network spanning the GCC, expected to transport 8 million passengers and 95 million tons of cargo annually by 2045. Also last month, the Cabinet inked a contract with China State Construction Engineering Corporation to implement, manage, and operate the new Mubarak Al Kabeer port.

For banks, this is all good news. Reforms and capital expenditure could enhance the momentum of economic recovery and growth, in turn driving more lending activity.

“As a bank, we have to take advantage of the contracts that are rolling out as we speak,” says Al-Duwaisan, noting that ABK has received a fair share of the new projects. “We have a very good coverage in multiple industries, be it infrastructure, civil, power, energy.”

Adds KFH’s Al-Shamlan, “I see growth potential in sectors that are critical to the global economy’s infrastructure and energy needs: specifically, oil and gas, construction, and services.”

Changing Landscape For Banks

The financial sector stands at the cornerstone of Kuwait’s non-oil economy. Despite fluctuating global energy prices and a tense regional geopolitical landscape, Kuwaiti lenders are showing resilience.

Standard & Poor’s (S&P) assigned a stable outlook to Kuwaiti banks in January, noting that they “operate with strong capital buffers and typically retain 50% or more of their bottom line, which supports their capitalization. The quality of capital remains strong, with a modest share of hybrid instruments.”

The financial landscape nevertheless is undergoing significant change.

In July, the government introduced legislation to bolster transparency and reduce fraud by adding more stringent screening measures for opening bank accounts. At the same time, the banking sector is beginning to mirror regional trends as consolidation efforts gain momentum.

In December, Burgan Bank announced plans to acquire Bahrain’s United Gulf Bank in a $190 million deal, set to close in the coming months. The deal “aligns with the bank’s new asset reallocation strategy and efforts to build new and diversified revenue streams,” said Burgan Group CEO Tony Daher in an announcement. With subsidiaries in Algeria, Tunisia, and Turkey as well as a corporate office in the United Arab Emirates, Burgan may also leverage the merger to expand further across the MENA region.

Other deals are in the works. In January, Warba Bank announced it would buy a 32.75% share in Gulf Bank from Alghanim Trading, one of Kuwait’s largest family businesses. Last summer, Boubyan Bank floated the idea that it might acquire Gulf Bank which would have created Kuwait’s third-largest bank, with assets exceeding $50 billion. The transaction was later called off.

Since 2018, the number of banks in the GCC has dropped from 77 to 60, primarily through mergers and acquisitions that have created regional giants. Kuwait, however, largely stayed on the sidelines until KFH completed the acquisition of Bahrain’s Ahli United Bank (AUB) in 2022, marking the MENA region’s first major cross-border consolidation and creating the world’s second largest Islamic bank, with $120 billion in combined assets.

But with 21 regulated banks serving a population of over 4 million, Kuwait, like many GCC countries, is still considered overbanked. Moreover, the sector is largely dominated by NBK and KFH, which collectively hold some two thirds of total banking-sector assets, resulting in severe competition between the other players.

“We’re all fighting over good clients, and that creates compression in margins and returns,” says ABK’s Al-Duwaisan.

The anticipated mergers are unlikely to cause significant disruption, however. Typically in GCC bank consolidations, the major shareholders—powerful families or state-owned entities—remain unchanged, with only asset restructuring taking place.

In the case of Burgan and United Gulf Bank, both entities are subsidiaries of Kuwait Projects Company (KIPCO), one of the MENA region’s largest holding companies, backed by the royal family. Boubyan Bank is a subsidiary of NBK, and had it acquired Gulf Bank or any other retail bank, it would have ended up reinforcing NBK’s already dominating position on the market.

Kuwait’s recent initiatives to promote the financial sector also focus on building up its capital markets to drive private-sector growth. The expansion of the Kuwait Stock Exchange (KSE) and reforms to streamline foreign ownership rules are starting to show results.

Last year, 69 million shares were trades on the KSE, making it one of the GCC’s most active and best performing stock markets. While investors remain mainly locals, foreign participation in trading activity represented 7.8% of total trades in 2024, up from 5.8% in 2021.

“Reforms undertaken to deepen the capital markets and improve liquidity have helped increase the visibility of Kuwait markets among foreign investors and allowed asset managers to launch new products such as ETFs and REITs, which was previously not possible,” says Markaz’s Khalil, who recently launched the GCC Momentum Fund, Kuwait’s first passive investment fund. Markaz also hopes to widen its product portfolio focus on thematic funds and products based on alternative asset classes like Private equity and Private Credit.

Following the privatization of Boursa Kuwait, which operates the KSE, in 2016, the stock exchange was upgraded to “emerging market” by global index providers MSCI, FTS Russell, and S&P. It is currently in the third phase an ambitious Market Development Plan, with attracting local family businesses to list being one of the main challenges ahead.

“The IPO wave sweeping through some other GCC countries is yet to take off in Kuwait markets,” notes Khalil. “Similarly, deal activity in Kuwait is subdued. Measures to incentivize the listing of family businesses, privatization of state assets, introduction of parallel markets, and products like ETFs would aid in market development.”

The Road Ahead

For the first time in a long while, change has come to Kuwait. By modernizing its fiscal framework and ramping up project activity, the authorities are demonstrating commitment to enact some of the long-awaited changes observers have said the country needs to step away from oil dependency.

Enthusiasm over ongoing reforms, in turn, supports increasingly positive investor sentiment. But much remains to be done to encourage and support private-sector growth that eases the state’s dependence on hydrocarbon revenues, especially as the government plans to increase oil production substantially.


Source link

Dividend Aristocrats In Focus: Genuine Parts Company


Updated on March 3rd, 2025 by Felix Martinez

The Dividend Aristocrats are among the highest-quality dividend growth stocks an investor can buy. They have increased their dividends for 25+ consecutive years.

Becoming a Dividend Aristocrat is no small feat. Beyond certain market capitalization and trading volume requirements, Dividend Aristocrats must have raised their dividends each year for at least 25 years, and be included in the S&P 500 Index.

This presents a high hurdle that relatively few companies can clear. For example, there are currently 69 Dividend Aristocrats out of the 500 companies that comprise the S&P 500 Index.

We created a complete list of all 69 Dividend Aristocrats, along with important financial metrics like dividend yields and price-to-earnings ratios. You can download an Excel spreadsheet of all 69 Dividend Aristocrats by clicking the link below:


Disclaimer: Sure Dividend is not affiliated with S&P Global in any way. S&P Global owns and maintains The Dividend Aristocrats Index. The information in this article and downloadable spreadsheet is based on Sure Dividend’s own review, summary, and analysis of the S&P 500 Dividend Aristocrats ETF (NOBL) and other sources, and is meant to help individual investors better understand this ETF and the index upon which it is based. None of the information in this article or spreadsheet is official data from S&P Global. Consult S&P Global for official information.

An even smaller group of stocks have raised their dividends for 50+ years in a row. These are known as the Dividend Kings.

Genuine Parts (GPC) has increased its dividend for 69 consecutive years, giving it one of the longest dividend growth streaks in the market. You can see all 54 Dividend Kings here.

There is nothing overly exciting about Genuine Parts’ business model. Still, its steady annual dividend increases prove that a “boring” business can be just what income investors need for long-term dividend growth.

Business Overview

Genuine Parts traces its roots back to 1928, when Carlyle Fraser purchased Motor Parts Depot for $40,000 and renamed it Genuine Parts Company. The original Genuine Parts store had annual sales of just $75,000 and only 6 employees.

It has grown into a sprawling conglomerate that sells automotive and industrial parts, electrical materials, and general business products. Its global reach includes North America, Australia, New Zealand, and Europe and is comprised of more than 3,000 locations.

Source: Investor Presentation 

The industrial parts group sells industrial replacement parts to MRO (maintenance, repair, and operations) and OEM (original equipment manufacturer) customers. Customers are derived from a wide range of segments, including food and beverage, metals and mining, oil and gas, and health care.

Genuine Parts posted fourth quarter and full-year earnings on February 18th, 2025. The company reported steady growth in 2024, with fourth-quarter sales rising 3.3% to $5.8 billion and full-year sales reaching $23.5 billion. Adjusted diluted EPS was $1.61 for Q4 and $8.16 for the year. The company generated $1.3 billion in operating cash flow and returned $705 million to shareholders through dividends and buybacks.

Global automotive sales grew 6.1%, while industrial sales declined 1.2%. GPC continued its restructuring efforts, achieving significant cost savings. It also increased its dividend for the 69th consecutive year, raising the annual payout to $4.12 per share.

For 2025, GPC forecasts 2%–4% revenue growth, adjusted EPS of $7.75–$8.25, and up to $1.0 billion in free cash flow. The company remains focused on efficiency, cost control, and shareholder value.

Growth Prospects

Genuine Parts should benefit from structural trends, as the environment for auto replacement parts is highly positive. Consumers are holding onto their cars longer and increasingly making minor repairs to keep cars on the road longer, rather than buying new cars.

As average costs of vehicle repair increase as the car ages, this directly benefits Genuine Parts.

According to Genuine Parts, vehicles aged six years or older now represent over ~70% of cars on the road. This bodes very well for Genuine Parts.

In addition, the automotive aftermarket products and services market is significant. Genuine Parts has a sizable portion of the $200 billion (and growing) automotive aftermarket business.

Source: Investor Presentation

One way the company has historically captured market share in this space has been through acquisitions. It has made several acquisitions throughout its history.

For example, Genuine Parts acquired Alliance Automotive Group for $2 billion. Alliance is a European vehicle parts, tools, and workshop equipment distributor. More recently, in 2022, Genuine Parts completed its $1.3 billion all-cash purchase of Kaman Distribution Group, a leading power transmission, automation, and fluid power company.

Finally, expense reductions will aid earnings growth. The company noted it is undergoing a corporate restructuring to lower headcount and improve efficiency. These changes should result in better operating margins over time.

We expect 9% annual EPS growth over the next five years for Genuine Parts.

Competitive Advantages & Recession Performance

The biggest challenge facing the retail industry right now, is the threat of e-commerce competition. However, automotive parts retailers like NAPA are not exposed to this risk.

Automotive repairs are often complex, challenging tasks. NAPA is a leading brand, thanks partly to its reputation for quality products and service. Customers value being able to ask questions to qualified staff, which gives Genuine Parts a competitive advantage.

Genuine Parts has a leadership position across its businesses. All four of its operating segments represent the #1 or #2 brand in their respective categories, leading to a strong brand and steady customer demand.

Genuine Parts’ earnings-per-share during the Great Recession are below:

  • 2007 earnings-per-share of $2.98
  • 2008 earnings-per-share of $2.92 (2.0% decline)
  • 2009 earnings-per-share of $2.50 (14% decline)
  • 2010 earnings-per-share of $3.00 (20% increase)

Earnings-per-share declined significantly in 2009, which should come as no surprise. Consumers tend to tighten their belts when the economy enters a downturn.

That said, Genuine Parts remained highly profitable throughout the recession, and returned to growth in 2010 and beyond. The company remained highly profitable in 2020, despite the economic damage caused by the coronavirus pandemic.

There will always be a certain level of demand for automotive parts, which gives Genuine Parts’ earnings a high floor.

Valuation & Expected Returns

Based on the most recent closing price of ~$124 and expected 2025 earnings-per-share of $7.95, Genuine Parts has a price-to-earnings ratio of 15.6. Our fair value estimate for Genuine Parts is a price-to-earnings ratio of 15.

As a result, Genuine Parts is slightly overvalued at present. Multiple expansion could decrease annual returns by 0.7% per year over the next five years.

Genuine Parts’ future earnings growth and dividends will add to future returns. We expect Genuine Parts to grow its earnings-per-share by 9% annually over the next five years.

The stock also has a 3.3% current dividend yield. Genuine Parts has a highly sustainable dividend. The company has paid a yearly dividend since it went public in 1948.

Adding it all up, Genuine Parts’ total annual returns could consist of the following:

  • 9% earnings growth
  • 3.3% dividend yield
  • 0.7% valuation multiple compression

Genuine Parts is expected to generate total annual returns of 11.6% over the next five years. This is a strong rate of return, making the stock a buy.

Final Thoughts

Genuine Parts does not get much coverage in the financial media. It is far from the high-flying tech startups that typically receive more attention. However, Genuine Parts is a very appealing stock for investors looking for stable profitability and reliable dividend growth.

Due to favorable industry dynamics, the company has a long runway of growth ahead. It should continue to raise its dividend each year, as it has for the past 69 years.

Given its history of dividend growth, Genuine Parts is suitable for investors desiring income and steady dividend increases each year. With an 11.6% expected rate of return, GPC stock is a buy.

If you are interested in finding more high-quality dividend growth stocks suitable for long-term investment, the following Sure Dividend databases will be useful:

The major domestic stock market indices are another solid resource for finding investment ideas. Sure Dividend compiles the following stock market databases and updates them monthly:

Thanks for reading this article. Please send any feedback, corrections, or questions to [email protected].


Source link

Use This Spear to Protect Yourself Against Woolly Mammoths… and Tariffs


Hello, Reader.

Over the course of human evolution, we Homo sapiens have developed a survival instinct called the “negativity bias.”

This rather pessimistic term refers to the theory that negative events impact us more significantly than positive or neutral events, even if the positive or neutral events far outweigh the negative ones.

As early humans, this trait served us well. Our ancestors faced greater immediate dangers, like predators and environmental hazards.

We can all agree that when confronted with a woolly mammoth, you’d want to consider every dire outcome. So, prioritizing negative stimuli provided an evolutionary advantage.

As modern humans, though, this cognitive bias can cause a lot of mental turmoil. Especially since our current president is the master of creating dizzying headlines.

Truth be told, I believe that “headline risk,” is probably the most significant new risk investors will face throughout the Trump administration.

However, a lot of present-day fear is grounded in reality.

Yesterday, President Trump made good on his tariff threats against Mexico, Canada, and China. Citing ineffective border controls (and other grievances), he implemented additional 25% tariffs on imports from our neighbors to the north and south and a 10% additional tariff on imports from China.

Canada responded with a package of tariffs on $107 billion worth of goods. China responded by announcing additional tariffs of up to 15% on imports of U.S. farm products such as poultry, chicken, and beef. Mexican President Claudia Sheinbaum condemned the tariffs and said her government would respond soon.

Markets began to sell off yesterday as a result of the tariffs. All of the major indices opened sharply lower in the morning. And at one point, they were all down by more than 1%.

Now, as investors, it’s important not to let negativity bias get the best of us when the market is volatile. While the headlines may be scary, there’s always a chance that negative events, like the woolly mammoth, will become extinct.

So today, I’d like to share the best course of action to take when faced with market volatility… and the best way to hedge against the chaos.

Stay Steadfast

Brian Hunt, the CEOhere at InvestorPlace, puts it well…

Our instincts make us pay close attention to potential dangers… both real and imagined. So, our subconscious minds compel us to click on bearish headlines, fixate on disasters, worry about elections, buy magazines with gloomy forecasts on their covers, and fret over 15% stock market corrections.

I encourage you to let common sense and the facts shape your actions instead of leaving it up to caveman thinking.

You’ll be far more successful investor if you do.

Why do I say that? And what are the facts?

Well, just consider that the stock market has averaged a positive annual return of 10% for the past 100 years. This is because the trend of increasing prosperity that is powered by free markets and free enterprise is one of the strongest trends in human history.

And here’s another important fact…

During the 20th century, stocks appreciated in value by 1,500,000%.

A 1,500,000% return turns every $100 invested into $1.5 million.

Of course, the 20th century was fraught with its own turbulence. The Great Depression… World War I and World War II… the Korean War… the Cuban Missile Crisis… the Watergate scandal… the list goes on.

However, as Hunt says…

Despite all these things, U.S. stocks appreciated in value by 1,500,000% during the 20th century.

Despite something bad happening every decade, incredible wealth was created by innovative businesses like The Coca-Cola Co. (KO), Ford Motor Co. (F), Hershey Co. (HSY)Intel Corp. (INTC)General Electric Co. (GE)McDonald’s Corp. (MCD)The Procter & Gamble Co. (PG)Tootsie Roll Industries Inc. (TR)Pfizer Inc. (PFE)Walmart Inc. (WMT), Starbucks Corp. (SBUX), and thousands of others.

We all know there are problems in America…

These topics are covered daily in the news. They are the subjects of best-selling books. They have many people paralyzed by fear.

But if you know your history and know how powerful American innovation is, you know this is no cause to sell your stocks and crawl into a hole.

John W. Gardner, the Secretary of Health, Education, and Welfare under President Lyndon B. Johnson, once said, “History never looks like history when you are living through it.”

But the reality is that history does rhyme, and there is precedent for remaining steadfast in the face of market volatility.

So, in agreement with Hunt, I still prefer the wait-and-see approach. In fact, this approach has already worked in the last 24 hours. Trump may soon announce tariff compromise deals with Canada and Mexico.

Yesterday, Commerce Secretary Howard Lutnick said, “I think [Trump] is going to work something out with them – it’s not going to be a pause, none of that pause stuff, but I think he’s going to figure out: you do more and I’ll meet you in the middle some way.”

Following Lutnick’s remarks, the stock futures tied to all three major averages rose.

So, it is important to curb our negativity bias.

Protection Against the Unknown

That said, if we want to pass by a woolly mammoth unscathed, it’s prudent to have a spear. Likewise, we want our portfolios to offer us the same sense of protection.

I believe that gold and gold stocks offer security in the face of uncertainty or market volatility.

When the S&P 500 index, the Dow Jones Industrial Average, the Nasdaq Composite, and the Russell 2000 were all in the red yesterday, gold was not. In fact, the futures contract for the price of gold in April 2025 ended the trading day yesterday 0.67% higher… and it is up 0.42% as I write today.

Now, I do not recommend “loading the boat” with precious metals. But I do recommend buying them as a hedge against unforeseen financial trauma. In other words, buy scarcity, at least as a hedge.

While many investors may rush to buy physical gold or gold stocks, there is a more powerful way to capitalize on this golden hedge – one that multiplies your returns.

It’s by using long-term equity anticipation securities (LEAPS), which are long-dated options contracts with expiration dates one to three years away. (Options may sound scary, but they don’t have to be. You can learn more about trading options in my free special broadcast, here.)

Every option is identified with a specific stock. And we’ve had major success with a recent LEAPS option on SPDR Gold Shares (GLD), the first U.S.-traded gold ETF.

I recommended a LEAPS option on GLD to my Leverage subscribers on March 21, 2024. The call had an expiration date of June 20, 2025.

Since then, we’ve sold…

  • A one-fourth position on April 18, 2024, for a 379% gain…
  • A one-fourth position on September 19, 2024, for a 94% gain…
  • A one-fourth position on September 20, 2024, for a 110% gain…
  • And the final one-fourth position on October 18, 2024, for a 292% gain.

Overall, those who followed my LEAPS strategy in Leverage pocketed a whopping 220% gain on this GLD call.

To learn more about this strategy, I’ve created a special presentation that explains how anyone can take advantage of LEAPS. In the broadcast, you’ll also learn how to access a special report that lays out three LEAPS trades with the potential to double your money in just a few months.

Click here to learn how to join Leverage and take advantage of this powerful options strategy.

Regards,

Eric Fry

P.S. Tariffs, along with geopolitical uncertainty and stalled-out price action, have been throwing a wrench into the works this year.

But our partners at TradeSmith couldn’t be more certain about what’s coming.

And what’s coming is the continuation of an epic melt-up that officially began in April of last year… and will likely only accelerate over the next 12 months.

Click here to watch TradeSmith CEO Keith Kaplan’s free special broadcast that includes full details on his Mega Melt-Up thesis… and a breakdown of his new trading strategy.


Source link

A new narrative forming: Is Europe back? – United States


Written by the Market Insights Team

Tariffs are effectively a tax on consumers, which is a headwind to growth by nature. Thus, in an already weakening US economic backdrop, bets of more Fed rate cuts are rising, which is weighing heavily on the US dollar. The dollar index is down over 4% year-to-date. Meanwhile, Germany’s multi-billion commitment to boost infrastructure and defence spending has sent the euro 4% higher this week against the dollar, to almost 4-month highs above $1.08. GBP/USD has also marched nearly 3% higher this week with eyes on November highs of $1.30, but both the euro and pound are now in overbought territory.

Tearing down the black zero and euro bears

Boris Kovacevic – Global Macro Strategist

This is what European investors have eagerly been waiting for. Germany’s likely next coalition of the CDU and SPD is preparing for a major fiscal expansion, potentially widening the deficit to 4% of GDP over the next decade. While details remain unclear and implementation risks are high, the plan aims to bolster military deterrence, drive economic recovery, and reshape Germany’s lagging infrastructure.

Around €500 billion could potentially be available for investment over the next ten years. How much of this will go into the expansion of the military complex is unclear. However, a report from the European Commission estimated that about €800 billion or 4.5% of the EU’s GDP could be mobilized in the coming years. To illustrate how significant the likely adjustment of the German black zero (rule of not increasing debt levels) is, we can take a look at their market impact. The 10-year government bond yield surged by an incredible 28 basis points to 2.8%. This is the largest single-day increase in financing costs since the reunification of East and West Germany in the 1990s.

It is also safe to say that no analyst saw the euro surging by 4% this week. However, we have consistently highlighted two key points over the past few weeks: first, that the dollar’s tariff-driven gains were likely to lose momentum as the US economy slowed, and second, that European pessimism had reached extreme levels—making positive surprises far more impactful on markets than any disappointing data or news. The German defense bazooka and signs that the Trump administration is monitoring the impact of tariff announcements on markets and the economy have pushed EUR/USD to the highest level this year above $1.08.

From now on, we warn on turning too optimistic too soon. First, the adjustment of the deficit rule needs a 2/3 majority in the German parliament which is still not guaranteed. Second, the global (US vs. RoW) tariff war has just started. Both can still act as headwinds for the euro. Still, the real rate differential makes it clear that levels such as $1.07 or $1.08 are not unjustified.

Chart of EURUSD and rate differentials

Dollar down 4% in 2025

Boris Kovacevic – Global Macro Strategist

Yesterday was probably the first trading session of the year in which global markets were not driven by developments in the US, but by the news flow coming out of Europe. The proposed increase of German defence spending and signs that the US economy are slowing have put the dollar on track for its worst week since November 2022.

The 3% drawdown is happening despite Trump’s rhetoric becoming more hawkish. This is likely due to two factors. First, investors are looking beyond the short-term safe haven flows and are asking what damage tariffs will do to the US economy. Second, despite this week’s tariff increases on Mexico, Canada, and China, potential exemptions and the undefined duration of the tariffs continue to confuse investors. Statements by the Trump administration have signalled that they are watching the impact of tariffs on markets and the economy. The White House excluded automakers from the newly imposed tariffs on Mexico and Canada for example. Could that mean that a large enough drop in equity prices or economic momentum could make Trump pivot?

Economic data came in mixed yesterday. The services sector beat forecasts and expanded modestly. Anxiety is high but the employment index rose from 52.3 to 53.9. This does contradict the ADP report, which showed that private hiring fell to the lowest level since July at 77,000. Against this ambiguous backdrop, all eyes will be on the nonfarm payrolls report tomorrow. The dollar needs an upside surprise on the jobs figure to stop the bleeding.

Chart of USD performances versus global peers

Pound now 7% higher than January low

George Vessey – Lead FX & Macro Strategist

As the US dollar dump continues, GBP/USD marches to fresh 4-month highs above the $1.29 handle. The pair has broken above key resistance levels including key moving averages like the closely watched 200-day and 200-week moving averages, which is a bullish signal. Moreover, in FX options markets, short-term risk reversals, favouring further sterling strength, have surged to their highest in around five years.

Expectations of the US dollar outperforming on escalating trade war tensions are fading as investors focus more on the negative repercussions on the US economy, with stagflation fears overwhelming. Instead of safe haven USD demand, traders are focused on a recent slowdown in US data, versus improvement in UK and European data, and the potential for relative outperformance between the economies. This is also having a positive impact on interest rate differentials between Europe and the UK versus the US, given the rise in Fed easing bets. Moreover, the spillover effect from surging German bund yields as a result of the proposed bazooka spending plan, saw the UK 10-year yield jump by the most in over a year yesterday, to over 1-month highs. This sent UK-US 10-year spreads soaring to an 18-month high, which has helped the pound’s rally against the battered and bruised US dollar.

But the near 7% climb from the low of $1.21 in January, and the 2.6% rally this week has pushed the pound into the overbought zone according to the 14-day relative strength index. A period of consolidation or a correction lower may be in the offing, but the psychological $1.30 level now serves as next resistance. Elsewhere, GBP/EUR has dropped 1.5% this week after enduring its biggest single day loss in five months as stronger flows into the euro dominate.

Chart of GBPUSD risk reversals

EUR/USD up 4% in last seven days

Table: 7-day currency trends and trading ranges

Table of FX rates

Key global risk events

Calendar: March 3-7

Table of risk events

All times are in GMT

Have a question? [email protected]

*The FX rates published are provided by Convera’s Market Insights team for research purposes only. The rates have a unique source and may not align to any live exchange rates quoted on other sites. They are not an indication of actual buy/sell rates, or a financial offer.


Source link

Proposed Mortgage Law Would Be A ‘Game Changer’ For Kuwaiti Banks


One of the most anticipated reforms of 2025 is a new mortgage law, now under discussion between government ministries, banks, and the Central Bank of Kuwait (CBK). If approved, the legislation, which has been under discussion for years, would allow commercial lenders to issue housing loans; currently, only the state-owned Kuwait Credit Bank may do so.

“That’s a game changer for banks in Kuwait,” says Ahmed Al-Duwaisan, acting CEO and managing director of Corporate Banking at Al Ahli Bank of Kuwait. “Once the mortgage law comes out, it would help the retail business significantly. That’s a new avenue for conventional banks like us.”

According to local media reports, the new law would allow commercial banks to lend up to $750,000 over a term of up to 25 or 30 years; the current cap is 15 years. The required debt-to-income ratio is also expected to increase, giving borrowers more flexibility.

With over 100,000 pending home-loan applications, demand is immense, but also a significant growth opportunity for Kuwait’s banking industry.

“As government discussions on mortgages ramp up again,” says Abdullah Al-Tuwaijri, CEO of Consumer, Private & Digital Banking at Boubyan Bank, “we believe there to be an opportunity for all banks to contribute to solving the housing problem in Kuwait, which in turn will lead to additional potential growth opportunities.”

The proposed reforms are also expected to impact real estate investment.

“Reforms such as the proposed mortgage law and the recently implemented laws to prevent land monopoly will support local real estate, which is an important asset class for investors,” says Ali Khalil, CEO of Markaz, a Kuwaiti asset management and investment bank. The emirate’s real estate market has already shown impressive growth, as sales increased 36% year-over-year in 2024. And housing is expected to be a key driver in the government’s ambitious $121 billion suite of megaprojects, further fueling the sector’s expansion.


Source link

Heritage’s Long Beach US Coins Auction Tops $22 Million


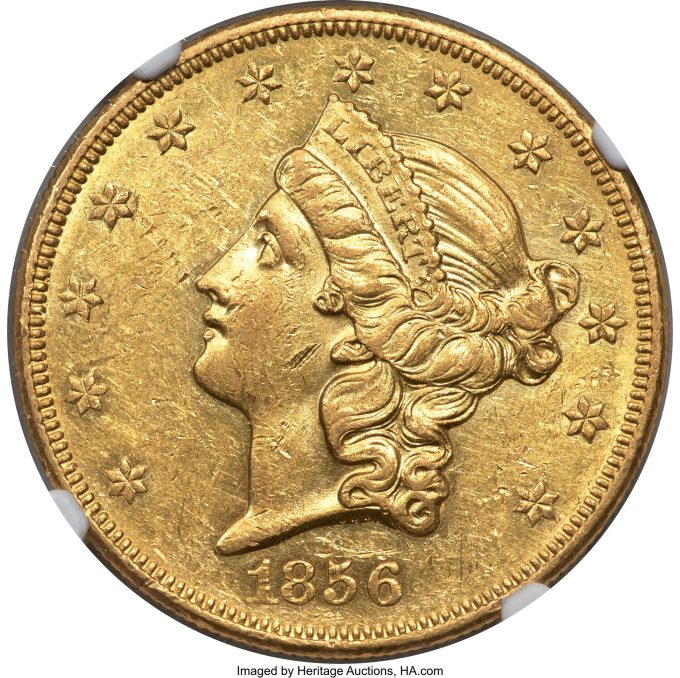
An 1856-O Liberty Double Eagle, AU58 PCGS. Winter 1 sold for a record $690,000 to lead Heritage’s February 27-March 2 Long Beach Expo US Coins Signature® Auction to $22,246,194.

1856-O Liberty Double Eagle, AU58

The result for this magnificent coin raced past the previous record of $576,150 that was set at Heritage Auctions in 2008.

Part of The Mississippi Collection of Double Eagles, Part II that produced many of the top results in the auction, this exceptional coin once was a part of the prestigious collection of Louis E. Eliasberg, Sr. It is the third-finest of the 1856-O, which is a premier rarity in the Liberty double eagle series, a group that boasts the smallest mintage – 2,250 – of any double eagle from the New Orleans Mint.

“This record is a fitting result for such a magnificent coin coming from such an exceptional collection,” says Greg Rohan, President of Heritage Auctions. “It’s an exceedingly rare coin that understandably drew major interest from serious double eagle collectors on its way to this record result.”

The 1856-O Liberty Double Eagle flew highest, but was hardly the only record setter.

  • The finest of three known examples of an 1836 Gobrecht Dollar, Judd-63 Restrike, PR63 Cameo PCGS. CAC drew 40 bids on its way to $192,000, surpassing the previous auction record of $149,500 that was set first in 2003 and then matched in 2009 at Heritage. Any Judd-63 is an exceptional rarity, including this beautiful example, which can be traced to 1884.
    1836 Gobrecht Dollar, PR63 Cameo
    1836 Gobrecht Dollar, PR63 Cameo
  • An 1896-S Liberty Eagle, MS67 PCGS. CAC brought a winning bid of $156,000, smashing the previous auction record of $31,200 that was set at Heritage in 2021. This is the finest certified example of this elusive rarity by two full grading points.
    1896-S Liberty Eagle, MS67 CAC
    1896-S Liberty Eagle, MS67 CAC
  • Also setting a new record at $156,000 was the finest of just six known examples of an 1841 Seated Dollar, PR64 PCGS CAC. Further elevating the demand is the fact that of the six examples, not all have been available to the collecting community; one is impounded in the Smithsonian’s National Numismatic Collection, and another is a recently discovered impaired proof, meaning the coin offered here is one of just four confirmed non-impaired proofs available to collectors.
    1841 Seated Dollar, PR64 CAC
    1841 Seated Dollar, PR64 CAC
  • Like the top lot in the auction, an 1850-O Double Eagle, MS61 PCGS. CAC. Winter-1 came from the Mississippi Collection of Double Eagles to achieve a record result when it sold for $132,000, eclipsing the record of $111,625 that was set in 2014 at Heritage Auctions. This example is one of just two awarded a Mint State grade by PCGS out of more than 320 it has certified in all grades.
    1850-O Double Eagle, MS61
    1850-O Double Eagle, MS61

In all, 16 lots in the auction brought more than $100,000 – a list that included:

  • Eighty-six bids poured in for one of the highest-graded examples of an 1870-CC Liberty Double Eagle, AU53 NGC. Winter 1-A before it ended at $588,000. The 1870-CC is a classic rarity in the Liberty double eagle series, from the first year of coinage operations at the famous Carson City Mint. It has the lowest mintage – 3,789 – in the Carson City series, and estimates of the surviving population range from 40 to 65.
    1870-CC Liberty Double Eagle, AU53
    1870-CC Liberty Double Eagle, AU53
  • A magnificent example of a coin of virtually unsurpassed historical, economic and social importance, an 1851 Humbert Fifty Dollar, Lettered Edge, 887 Thous., 50 Reverse, MS62+ PCGS drew a winning bid of $456,000. Once a part of the Bob R. Simpson Collection, Part III, this example stands as one of the finest known representatives of this storied issue.
    1851 Humbert Fifty Dollar, MS62+
    1851 Humbert Fifty Dollar, MS62+
  • From the Ron L. Cates Collection, an extraordinary1870-CC Double Eagle, XF40 PCGS. Winter 1-A brought $348,000. The 1870-CC is one of the most famous issues that originated at the historic Carson City Branch Mint, and is coveted by collectors. One of just 10 examples carrying a PCGS grade of 40, this beauty sparked 107 bids before landing in a new collection.
    1870-CC Double Eagle, XF40
    1870-CC Double Eagle, XF40
  • One of the unquestioned treasures in the auction was a 58.77-ounce Kellogg & Humbert Gold Ingot from the S.S. Central America that reached $186,000. It comes from one of the most respected private assayers of California’s Gold Rush period, a firm that produced gold coinage alongside the early operations of the San Francisco Mint. Gold bars produced by the Kellogg & Humbert firm eventually were absorbed into various mints and melted down for sovereign coinage, but a large number of bars survived via the S.S. Central America shipwreck, including this stunner.
    Kellogg & Humbert Gold Ingot
    Kellogg & Humbert Gold Ingot
  • A 1921 Saint-Gaudens Double Eagle, MS62+ NGC climbed to $144,000. Demand for gold coinage diminished when foreign trade was limited during World War I, so the Mint stopped striking gold coinage between 1916 and 1920. Large denomination coins were still convenient for settling large accounts in foreign trade, however, and the government was required to back its paper currency with a substantial gold reserve. The 1921 Saint-Gaudens double eagle is a sought-after rarity in the popular series today. Roger Burdette estimates no more than 175 examples survive in all grades, and high-quality specimens are especially elusive. David Akers called the 1921 the premier condition rarity of the Saint-Gaudens double eagle series.
    1921 Saint-Gaudens Double Eagle, MS62+
    1921 Saint-Gaudens Double Eagle, MS62+

Other top results in the auction included, but were not limited to:

Complete results can be found at HA.com/1381.

About Heritage Auctions

Heritage Auctions is the largest fine art and collectibles auction house founded in the United States, and the world’s largest collectibles auctioneer. Heritage maintains offices in New York, Dallas, Beverly Hills, Chicago, Palm Beach, London, Paris, Amsterdam, Brussels, Munich, Hong Kong and Tokyo.

Heritage also enjoys the highest Online traffic and dollar volume of any auction house on earth (source: SimilarWeb and Hiscox Report). The Internet’s most popular auction-house website, HA.com, has more than 1,750,000 registered bidder-members and searchable free archives of more than 6,000,000 past auction records with prices realized, descriptions and enlargeable photos. Reproduction rights routinely granted to media for photo credit.


Source link

2025 High Dividend Stocks List


Article updated on March 5th, 2025 by Bob Ciura

Spreadsheet data updated daily

High dividend stocks are stocks with a dividend yield well in excess of the market average dividend yield of ~1.3%.

The resources in this report focus on truly high yielding securities, often with dividend yields multiples higher than the market average.

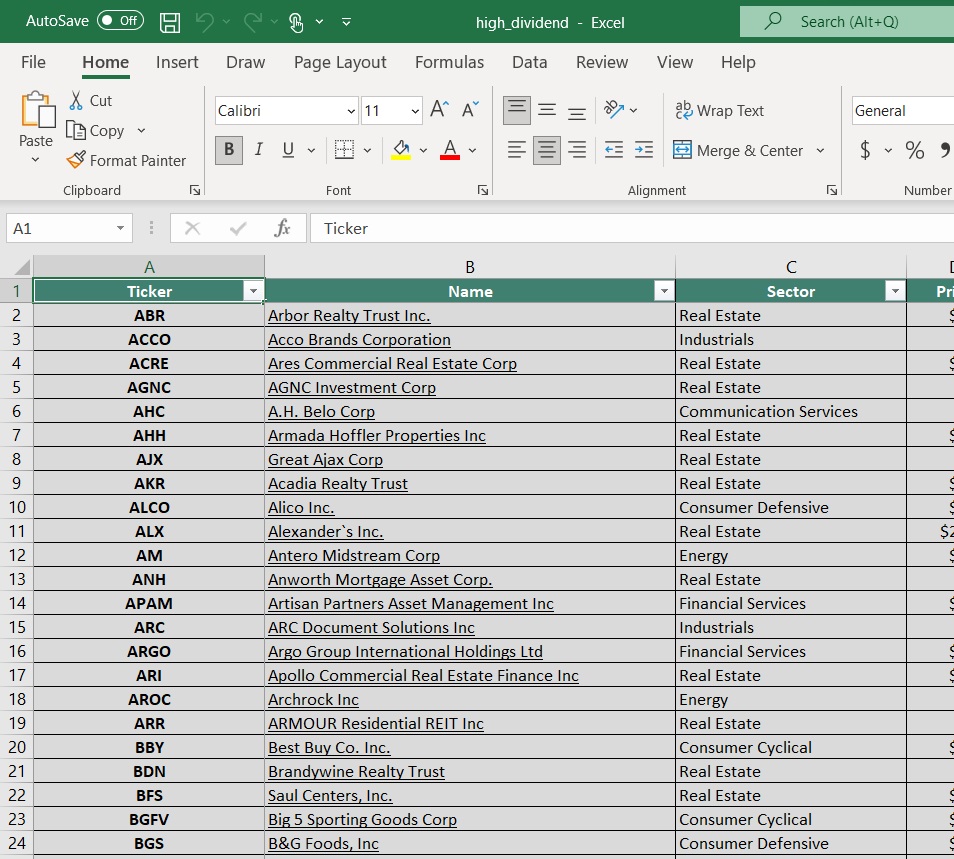
Resource #1: The High Dividend Stocks List Spreadsheet


Note: The spreadsheet uses the Wilshire 5000 as the universe of securities from which to select, plus a few additional securities we screen for with 5%+ dividend yields.

The free high dividend stocks list spreadsheet has our full list of ~140 individual securities (stocks, REITs, MLPs, etc.) with 5%+ dividend yields.

The high dividend stocks spreadsheet has important metrics to help you find compelling ultra high yield income investing ideas. These metrics include:

  • Market cap
  • Payout ratio
  • Dividend yield
  • Trailing P/E ratio
  • Annualized 5-year dividend growth rate

Resource #2: The 7 Best High Yield Stocks Now
This resource analyzes the 7 best high-yield stocks in detail. The criteria we use to rank high dividend securities in this resource are:

  • Is in the 870+ income security Sure Analysis Research Database
  • Rank based on dividend yield, from highest to lowest
  • Dividend Risk Scores of C or better
  • Based in the U.S.

Additionally, a maximum of three stocks are allowed for any single sector to ensure diversification.

Resource #3: The High Dividend 50 Series
The High Dividend 50 Series is where we analyze the 50 highest-yielding securities in the Sure Analysis Research Database. The series consists of 50 stand-alone analysis reports on these securities.

Resource #4: More High-Yield Investing Research
– How to calculate your income per month based on dividend yield
– The risks of high-yield investing
– Other high dividend research

The 7 Best High Yield Stocks Now

This resource analyzes the 7 best high yielding securities in the Sure Analysis Research Database as ranked by the following criteria:

  • Rank based on dividend yield, from highest to lowest
  • Dividend Risk Scores of C or better
  • Based in the U.S.

Note: Ranking data is from the current edition of the Sure Analysis spreadsheet.

Additionally, a maximum of three stocks are allowed for any single market sector to ensure diversification.

It’s difficult to define ‘best’. Here, we are using ‘best’ in terms of highest yields with reasonable and better dividend safety.

A tremendous amount of research goes into finding these 7 high yield securities. We analyze more than 850 income securities every quarter in the Sure Analysis Research Database. This is real analysis done by our analyst team, not a quick computer screen.

“So I think it was just looking at different companies and I always thought if you looked at 10 companies, you’d find one that’s interesting, if you’d look at 20, you’d find two, or if you look at 100 you’ll find 10. The person that turns over the most rocks wins the game. I’ve also found this to be true in my personal investing.”
– Investing legend Peter Lynch

Click here to download a PDF report for just one of the 850+ income securities we cover in Sure Analysis to get an idea of the level of work that goes into finding compelling income investments for our audience.

The 7 best high yield securities are listed in order by dividend yield below, from lowest to highest.

High Dividend Stock #7: Enterprise Products Partners LP (EPD)

  • Dividend Yield: 6.4%
  • Dividend Risk Score: B

Enterprise Products Partners was founded in 1968. It is structured as a Master Limited Partnership, or MLP, and operates as an oil and gas storage and transportation company.

Enterprise Products has a large asset base which consists of nearly 50,000 miles of natural gas, natural gas liquids, crude oil, and refined products pipelines.

It also has storage capacity of more than 250 million barrels. These assets collect fees based on volumes of materials transported and stored.

Source: Investor Presentation

Enterprise Products Partners reported strong fourth-quarter 2024 earnings, delivering $1.6 billion in net income, or $0.74 per common unit, representing a 3% increase over the prior year.

Adjusted cash flow from operations rose 4% to $2.3 billion, with the company declaring a quarterly distribution of $0.535 per unit, a 4% year-over-year increase.

Enterprise also continued its capital return strategy, repurchasing 2.1 million common units during the quarter and 7.6 million units for the full year, bringing total buybacks under its program to $1.1 billion.

For the full year, the company posted $9.9 billion in EBITDA, moving 12.9 million barrels of oil equivalent per day.

Click here to download our most recent Sure Analysis report on EPD (preview of page 1 of 3 shown below):

High Dividend Stock #6: Polaris Inc. (PII)

  • Dividend Yield: 6.6%
  • Dividend Risk Score: B

Polaris designs, engineers, and manufactures snowmobiles, all-terrain vehicles (ATVs) and motorcycles. In addition, related accessories and replacement parts are sold with these vehicles through dealers located throughout the U.S.

The company operates under 30+ brands including Polaris, Ranger, RZR, Sportsman, Indian Motorcycle, Slingshot and Transamerican Auto Parts. The global powersports maker, serving over 100 countries, generated $7.2 billion in sales in 2024.

Source: Investor Presentation

On January 28th, 2025, Polaris announced fourth quarter and full year results. For the quarter, revenue declined 23.6% to $1.75 billion, but this was $70 million higher than excepted. Adjusted earnings-per-share of $0.92 compared very unfavorably to $1.98 in the prior year, but topped estimates by $0.02.

For the year, revenue fell 19.7% to $7.12 billion while adjusted earnings-per-share of $3.25 was down from $9.16 in 2023.

For the quarter, Marine sales declined 4%, On-Road was lower by 21%, and Off-Road, the largest component of the company, decreased 25%.

As with previous quarters, decreases in all three businesses were mostly due to lower volumes. Off-Road was also negatively impacted planned reductions in shipments. Parts, Garments, and Accessories were weaker in the Off-Road and On-Road segments.

Click here to download our most recent Sure Analysis report on PII (preview of page 1 of 3 shown below):

High Dividend Stock #5: MPLX LP (MPLX)

  • Dividend Yield: 7.2%
  • Dividend Risk Score: C

MPLX LP is a Master Limited Partnership that was formed by the Marathon Petroleum Corporation (MPC) in 2012. In 2019, MPLX acquired Andeavor Logistics LP.

The business operates in two segments:

  • Logistics and Storage, which relates to crude oil and refined petroleum products
  • Gathering and Processing, which relates to natural gas and natural gas liquids (NGLs)

In early February, MPLX reported (2/4/25) financial results for the fourth quarter of fiscal 2024. Adjusted EBITDA and distributable cash flow (DCF) per share grew 9% and 7%, respectively, primarily thanks to higher tariff rates and increased volumes of liquids and gas.

MPLX maintained a healthy consolidated debt to adjusted EBITDA ratio of 3.1x and a solid distribution coverage ratio of 1.5x.

Click here to download our most recent Sure Analysis report on MPLX (preview of page 1 of 3 shown below):

High Dividend Stock #4: Altria Group (MO)

  • Dividend Yield: 7.2%
  • Dividend Risk Score: B

Altria is a tobacco stock that sells cigarettes, chewing tobacco, cigars, e-cigarettes, and more under a variety of brands, including Marlboro, Skoal, and Copenhagen, among others.

With a current dividend yield of nearly 8%, Altria is an ideal retirement investment stock.

This is a period of transition for Altria. The decline in the U.S. smoking rate continues. In response, Altria has invested heavily in new products that appeal to changing consumer preferences, as the smoke-free category continues to grow.

Source: Investor Presentation

The company also has a 35% investment stake in e-cigarette maker JUUL, and a 45% stake in the Canadian cannabis producer Cronos Group (CRON).

Altria Group reported solid financial results for the fourth quarter and full year of 2024. For the fourth quarter, revenue of $5.1 billion beat analyst estimates by $50 million, and increased 1.6% year-over-year. Adjusted EPS of $1.29 beat by a penny.

For the full year, Altria generated adjusted diluted EPS growth of 3.4% and returned over $10.2 billion to shareholders through dividends and share repurchases.

For 2025, Altria expects adjusted diluted EPS in a range of $5.22 to $5.37. This represents an adjusted diluted EPS growth rate of 2% to 5% for 2025.

Click here to download our most recent Sure Analysis report on Altria (preview of page 1 of 3 shown below):

High Dividend Stock #3: Universal Health Realty Income Trust (UHT)

  • Dividend Yield: 7.3%
  • Dividend Risk Score: B

Universal Health Realty Income Trust operates as a real estate investment trust (REIT), specializing in the healthcare sector. The trust owns healthcare and human service-related facilities.

Its property portfolio includes acute care hospitals, medical office buildings, rehabilitation hospitals, behavioral healthcare facilities, sub-acute care facilities and childcare centers. Universal Health’s portfolio consists of 69 properties in 20 states.

On October 24, 2024, UHT reported its third quarter results. Funds from Operations (FFO) saw a slight improvement, rising to $11.3 million, or $0.82 per diluted share, from $11.2 million, or $0.81 per diluted share, in the third quarter of 2023. This increase in FFO was mainly due to the rise in net income during the period.

The company maintained a strong liquidity position with significant cash reserves and continued strategic investments to enhance its property portfolio.

Click here to download our most recent Sure Analysis report on UHT (preview of page 1 of 3 shown below):

High Dividend Stock #2: Whirlpool Corp. (WHR)

  • Dividend Yield: 7.7%
  • Dividend Risk Score: B

Whirlpool Corporation, founded in 1955 and headquartered in Benton Harbor, MI, is a leading home appliance company with top brands Whirlpool, KitchenAid, and Maytag.

Roughly half of the company’s sales are in North America, but Whirlpool does business around the world under twelve principal brand names. The company, which employs about 44,000 people, generated nearly $17 billion in sales in 2024.

On January 29th, 2025, Whirpool reported fourth quarter 2024 results. Sales for the quarter totaled $4.14 billion, down 18.7% from fourth quarter 2023. Ongoing earnings per diluted share was $4.57 for the quarter, 19% higher than the previous year’s $3.85 per share.

Whirlpool issued its 2025 guidance, seeing ongoing earnings-per-share coming in at approximately $10.00 on revenue of $15.8 billion. Additionally, Whirlpool expects cash provided by operating activities to total roughly $1 billion, with $500 to $600 million in free cash flow.

Click here to download our most recent Sure Analysis report on WHR (preview of page 1 of 3 shown below):


High Dividend Stock #1: Western Union (WU)

  • Dividend Yield: 9.2%
  • Dividend Risk Score: C

The Western Union Company is the world leader in the business of domestic and international money transfers. The company has a network of approximately 550,000 agents globally and operates in more than 200 countries.

About 90% of agents are outside of the US. Western Union operates two business segments, Consumer-to-Consumer (C2C) and Other (bill payments in the US and Argentina).

Western Union reported mixed Q4 2024 results on February 4th, 2025. Revenue increased 1% and diluted GAAP earnings per share increased to $1.14 in the quarter, compared to $0.35 in the prior year on higher revenue and a $0.75 tax benefit on reorganizing the international operations.

Revenue rose, despite challenges in Iraq on higher Banded Digital transactions and Consumer Services volumes.

CMT revenue fell 4% year-over-year even with 3% higher transaction volumes. Branded Digital Money Transfer CMT revenues increased 7% as transactions rose 13%. Digital revenue is now 25% of total CMT revenue and 32% of transactions.

Consumer Services revenue rose 56% on new products and expansion of retail foreign exchange offerings. The firm launched a media network business, expanded retail foreign exchange, and grew retail money orders.

Click here to download our most recent Sure Analysis report on WU (preview of page 1 of 3 shown below):

The High Dividend 50 Series

The High Dividend 50 Series is analysis on the 50 highest-yielding Sure Analysis Research Database stocks, excluding royalty trusts, BDCs, REITs, and MLPs.

Click on a company’s name to view the high dividend 50 series article for that company. A link to the specific Sure Analysis Research Database report page for each security is included as well.

More High-Yield Investing Resources

How To Calculate Your Monthly Income Based On Dividend Yield

A common question for income investors is “how much money can I expect to receive per month from my investment?”

To find your monthly income, follow these steps:

  1. Find your investment’s dividend yield
    Note: Dividend yield can be calculated as dividends per share divided by share price
  2. Multiply it by the current value of your holding
    Note: If you haven’t yet invested, multiply dividend yield by the amount you plan to invest
  3. Divide this number by 12 to find monthly income

To find the monthly income from your entire portfolio, repeat the above calculation for each of your holdings and add them together.

You can also use this formula backwards to find the dividend yield you need from your investments to make a certain amount of monthly dividend income.

The example below assumes you want to know what dividend yield you need on a $240,000 investment to generate $1,000/month in dividend income.

  1. Multiply $1,000 by 12 to find annual income target of $12,000
  2. Divide $12,000 by your investment amount of $240,000 to find your target yield of 5.0%

In practice most dividend stocks pay dividends quarterly, so you would actually receive 3x the monthly amount quarterly instead of receiving a payment every month. However, some stocks do actually pay monthly dividends.

You can see our monthly dividend stocks list here.

The Risks Of High-Yield Investing

Investing in high-yield stocks is a great way to generate income. But it is not without risks.

First, stock prices fluctuate. Investors need to understand their risk tolerance before investing in high dividend stocks. Share price fluctuations means that your investment can (and almost certainly will) decline in value, at least temporarily (and possibly permanently) do to market volatility.

Second, businesses grow and decline. Investing in a stock gives you fractional ownership in the underlying business. Some businesses grow over time. These businesses are likely to pay higher dividends over time.

The Dividend Champions are an excellent example of this; each has paid rising dividends for 25+ consecutive years.

What’s dangerous is when a business declines. Dividends are paid out of a company’s cash flows. If the business sees its cash flows decline, or worse is losing money, it may reduce or eliminate its dividend.

Business decline is a real risk with high yield investing. Business declines often coincide with and or accelerate during recessions.

A company’s payout ratio gives a good gauge of how much ‘room’ a company has to pay its dividend. The payout ratio is calculated as dividends divided by income.

The lower the payout ratio, the better, because dividends have more earnings coverage.

A company with a payout ratio over 100% is paying out more in dividends than it is making in profits, a long-term unsustainable situation.

For example, a company with a payout ratio of 50% is making double in income what it is paying out in dividends, so it has ‘room’ for earnings to decline significantly without reducing its dividend.

Third, management teams can change their dividend policies. Even if a company isn’t declining, the company’s management team may change priorities and reduce or eliminate its dividend.

In practice, this typically occurs if a company has a high level of debt and wants to focus on debt reduction. But it could in theory happen to any dividend paying stock.

The risks of high yield investing can be reduced (but not eliminated) by investing in higher quality businesses in a diversified portfolio of 20 or more stocks.

This reduces both business decline risk (by investing in high quality businesses) and the shock to your portfolio if any one stock does reduce or eliminate its dividend (through diversification).

Other High Dividend Research

The free spreadsheet of 5%+ dividend yield stocks in this article gives you more than 140 high yield income securities to review. You can download it below:


Investors should continue to monitor each stock to make sure their fundamentals and growth remain on track, particularly among stocks with extremely high dividend yields.

See the resources below to generate additional compelling investment ideas for dividend growth stocks and/or high-yield investment securities.

Thanks for reading this article. Please send any feedback, corrections, or questions to [email protected].


Source link

Copyright © 2023 | Powered by WordPress | Coin Market Theme by A WP Life