Use This Spear to Protect Yourself Against Woolly Mammoths… and Tariffs


Hello, Reader.

Over the course of human evolution, we Homo sapiens have developed a survival instinct called the “negativity bias.”

This rather pessimistic term refers to the theory that negative events impact us more significantly than positive or neutral events, even if the positive or neutral events far outweigh the negative ones.

As early humans, this trait served us well. Our ancestors faced greater immediate dangers, like predators and environmental hazards.

We can all agree that when confronted with a woolly mammoth, you’d want to consider every dire outcome. So, prioritizing negative stimuli provided an evolutionary advantage.

As modern humans, though, this cognitive bias can cause a lot of mental turmoil. Especially since our current president is the master of creating dizzying headlines.

Truth be told, I believe that “headline risk,” is probably the most significant new risk investors will face throughout the Trump administration.

However, a lot of present-day fear is grounded in reality.

Yesterday, President Trump made good on his tariff threats against Mexico, Canada, and China. Citing ineffective border controls (and other grievances), he implemented additional 25% tariffs on imports from our neighbors to the north and south and a 10% additional tariff on imports from China.

Canada responded with a package of tariffs on $107 billion worth of goods. China responded by announcing additional tariffs of up to 15% on imports of U.S. farm products such as poultry, chicken, and beef. Mexican President Claudia Sheinbaum condemned the tariffs and said her government would respond soon.

Markets began to sell off yesterday as a result of the tariffs. All of the major indices opened sharply lower in the morning. And at one point, they were all down by more than 1%.

Now, as investors, it’s important not to let negativity bias get the best of us when the market is volatile. While the headlines may be scary, there’s always a chance that negative events, like the woolly mammoth, will become extinct.

So today, I’d like to share the best course of action to take when faced with market volatility… and the best way to hedge against the chaos.

Stay Steadfast

Brian Hunt, the CEOhere at InvestorPlace, puts it well…

Our instincts make us pay close attention to potential dangers… both real and imagined. So, our subconscious minds compel us to click on bearish headlines, fixate on disasters, worry about elections, buy magazines with gloomy forecasts on their covers, and fret over 15% stock market corrections.

I encourage you to let common sense and the facts shape your actions instead of leaving it up to caveman thinking.

You’ll be far more successful investor if you do.

Why do I say that? And what are the facts?

Well, just consider that the stock market has averaged a positive annual return of 10% for the past 100 years. This is because the trend of increasing prosperity that is powered by free markets and free enterprise is one of the strongest trends in human history.

And here’s another important fact…

During the 20th century, stocks appreciated in value by 1,500,000%.

A 1,500,000% return turns every $100 invested into $1.5 million.

Of course, the 20th century was fraught with its own turbulence. The Great Depression… World War I and World War II… the Korean War… the Cuban Missile Crisis… the Watergate scandal… the list goes on.

However, as Hunt says…

Despite all these things, U.S. stocks appreciated in value by 1,500,000% during the 20th century.

Despite something bad happening every decade, incredible wealth was created by innovative businesses like The Coca-Cola Co. (KO), Ford Motor Co. (F), Hershey Co. (HSY)Intel Corp. (INTC)General Electric Co. (GE)McDonald’s Corp. (MCD)The Procter & Gamble Co. (PG)Tootsie Roll Industries Inc. (TR)Pfizer Inc. (PFE)Walmart Inc. (WMT), Starbucks Corp. (SBUX), and thousands of others.

We all know there are problems in America…

These topics are covered daily in the news. They are the subjects of best-selling books. They have many people paralyzed by fear.

But if you know your history and know how powerful American innovation is, you know this is no cause to sell your stocks and crawl into a hole.

John W. Gardner, the Secretary of Health, Education, and Welfare under President Lyndon B. Johnson, once said, “History never looks like history when you are living through it.”

But the reality is that history does rhyme, and there is precedent for remaining steadfast in the face of market volatility.

So, in agreement with Hunt, I still prefer the wait-and-see approach. In fact, this approach has already worked in the last 24 hours. Trump may soon announce tariff compromise deals with Canada and Mexico.

Yesterday, Commerce Secretary Howard Lutnick said, “I think [Trump] is going to work something out with them – it’s not going to be a pause, none of that pause stuff, but I think he’s going to figure out: you do more and I’ll meet you in the middle some way.”

Following Lutnick’s remarks, the stock futures tied to all three major averages rose.

So, it is important to curb our negativity bias.

Protection Against the Unknown

That said, if we want to pass by a woolly mammoth unscathed, it’s prudent to have a spear. Likewise, we want our portfolios to offer us the same sense of protection.

I believe that gold and gold stocks offer security in the face of uncertainty or market volatility.

When the S&P 500 index, the Dow Jones Industrial Average, the Nasdaq Composite, and the Russell 2000 were all in the red yesterday, gold was not. In fact, the futures contract for the price of gold in April 2025 ended the trading day yesterday 0.67% higher… and it is up 0.42% as I write today.

Now, I do not recommend “loading the boat” with precious metals. But I do recommend buying them as a hedge against unforeseen financial trauma. In other words, buy scarcity, at least as a hedge.

While many investors may rush to buy physical gold or gold stocks, there is a more powerful way to capitalize on this golden hedge – one that multiplies your returns.

It’s by using long-term equity anticipation securities (LEAPS), which are long-dated options contracts with expiration dates one to three years away. (Options may sound scary, but they don’t have to be. You can learn more about trading options in my free special broadcast, here.)

Every option is identified with a specific stock. And we’ve had major success with a recent LEAPS option on SPDR Gold Shares (GLD), the first U.S.-traded gold ETF.

I recommended a LEAPS option on GLD to my Leverage subscribers on March 21, 2024. The call had an expiration date of June 20, 2025.

Since then, we’ve sold…

  • A one-fourth position on April 18, 2024, for a 379% gain…
  • A one-fourth position on September 19, 2024, for a 94% gain…
  • A one-fourth position on September 20, 2024, for a 110% gain…
  • And the final one-fourth position on October 18, 2024, for a 292% gain.

Overall, those who followed my LEAPS strategy in Leverage pocketed a whopping 220% gain on this GLD call.

To learn more about this strategy, I’ve created a special presentation that explains how anyone can take advantage of LEAPS. In the broadcast, you’ll also learn how to access a special report that lays out three LEAPS trades with the potential to double your money in just a few months.

Click here to learn how to join Leverage and take advantage of this powerful options strategy.

Regards,

Eric Fry

P.S. Tariffs, along with geopolitical uncertainty and stalled-out price action, have been throwing a wrench into the works this year.

But our partners at TradeSmith couldn’t be more certain about what’s coming.

And what’s coming is the continuation of an epic melt-up that officially began in April of last year… and will likely only accelerate over the next 12 months.

Click here to watch TradeSmith CEO Keith Kaplan’s free special broadcast that includes full details on his Mega Melt-Up thesis… and a breakdown of his new trading strategy.


Source link

A new narrative forming: Is Europe back? – United States


Written by the Market Insights Team

Tariffs are effectively a tax on consumers, which is a headwind to growth by nature. Thus, in an already weakening US economic backdrop, bets of more Fed rate cuts are rising, which is weighing heavily on the US dollar. The dollar index is down over 4% year-to-date. Meanwhile, Germany’s multi-billion commitment to boost infrastructure and defence spending has sent the euro 4% higher this week against the dollar, to almost 4-month highs above $1.08. GBP/USD has also marched nearly 3% higher this week with eyes on November highs of $1.30, but both the euro and pound are now in overbought territory.

Tearing down the black zero and euro bears

Boris Kovacevic – Global Macro Strategist

This is what European investors have eagerly been waiting for. Germany’s likely next coalition of the CDU and SPD is preparing for a major fiscal expansion, potentially widening the deficit to 4% of GDP over the next decade. While details remain unclear and implementation risks are high, the plan aims to bolster military deterrence, drive economic recovery, and reshape Germany’s lagging infrastructure.

Around €500 billion could potentially be available for investment over the next ten years. How much of this will go into the expansion of the military complex is unclear. However, a report from the European Commission estimated that about €800 billion or 4.5% of the EU’s GDP could be mobilized in the coming years. To illustrate how significant the likely adjustment of the German black zero (rule of not increasing debt levels) is, we can take a look at their market impact. The 10-year government bond yield surged by an incredible 28 basis points to 2.8%. This is the largest single-day increase in financing costs since the reunification of East and West Germany in the 1990s.

It is also safe to say that no analyst saw the euro surging by 4% this week. However, we have consistently highlighted two key points over the past few weeks: first, that the dollar’s tariff-driven gains were likely to lose momentum as the US economy slowed, and second, that European pessimism had reached extreme levels—making positive surprises far more impactful on markets than any disappointing data or news. The German defense bazooka and signs that the Trump administration is monitoring the impact of tariff announcements on markets and the economy have pushed EUR/USD to the highest level this year above $1.08.

From now on, we warn on turning too optimistic too soon. First, the adjustment of the deficit rule needs a 2/3 majority in the German parliament which is still not guaranteed. Second, the global (US vs. RoW) tariff war has just started. Both can still act as headwinds for the euro. Still, the real rate differential makes it clear that levels such as $1.07 or $1.08 are not unjustified.

Chart of EURUSD and rate differentials

Dollar down 4% in 2025

Boris Kovacevic – Global Macro Strategist

Yesterday was probably the first trading session of the year in which global markets were not driven by developments in the US, but by the news flow coming out of Europe. The proposed increase of German defence spending and signs that the US economy are slowing have put the dollar on track for its worst week since November 2022.

The 3% drawdown is happening despite Trump’s rhetoric becoming more hawkish. This is likely due to two factors. First, investors are looking beyond the short-term safe haven flows and are asking what damage tariffs will do to the US economy. Second, despite this week’s tariff increases on Mexico, Canada, and China, potential exemptions and the undefined duration of the tariffs continue to confuse investors. Statements by the Trump administration have signalled that they are watching the impact of tariffs on markets and the economy. The White House excluded automakers from the newly imposed tariffs on Mexico and Canada for example. Could that mean that a large enough drop in equity prices or economic momentum could make Trump pivot?

Economic data came in mixed yesterday. The services sector beat forecasts and expanded modestly. Anxiety is high but the employment index rose from 52.3 to 53.9. This does contradict the ADP report, which showed that private hiring fell to the lowest level since July at 77,000. Against this ambiguous backdrop, all eyes will be on the nonfarm payrolls report tomorrow. The dollar needs an upside surprise on the jobs figure to stop the bleeding.

Chart of USD performances versus global peers

Pound now 7% higher than January low

George Vessey – Lead FX & Macro Strategist

As the US dollar dump continues, GBP/USD marches to fresh 4-month highs above the $1.29 handle. The pair has broken above key resistance levels including key moving averages like the closely watched 200-day and 200-week moving averages, which is a bullish signal. Moreover, in FX options markets, short-term risk reversals, favouring further sterling strength, have surged to their highest in around five years.

Expectations of the US dollar outperforming on escalating trade war tensions are fading as investors focus more on the negative repercussions on the US economy, with stagflation fears overwhelming. Instead of safe haven USD demand, traders are focused on a recent slowdown in US data, versus improvement in UK and European data, and the potential for relative outperformance between the economies. This is also having a positive impact on interest rate differentials between Europe and the UK versus the US, given the rise in Fed easing bets. Moreover, the spillover effect from surging German bund yields as a result of the proposed bazooka spending plan, saw the UK 10-year yield jump by the most in over a year yesterday, to over 1-month highs. This sent UK-US 10-year spreads soaring to an 18-month high, which has helped the pound’s rally against the battered and bruised US dollar.

But the near 7% climb from the low of $1.21 in January, and the 2.6% rally this week has pushed the pound into the overbought zone according to the 14-day relative strength index. A period of consolidation or a correction lower may be in the offing, but the psychological $1.30 level now serves as next resistance. Elsewhere, GBP/EUR has dropped 1.5% this week after enduring its biggest single day loss in five months as stronger flows into the euro dominate.

Chart of GBPUSD risk reversals

EUR/USD up 4% in last seven days

Table: 7-day currency trends and trading ranges

Table of FX rates

Key global risk events

Calendar: March 3-7

Table of risk events

All times are in GMT

Have a question? [email protected]

*The FX rates published are provided by Convera’s Market Insights team for research purposes only. The rates have a unique source and may not align to any live exchange rates quoted on other sites. They are not an indication of actual buy/sell rates, or a financial offer.


Source link

Proposed Mortgage Law Would Be A ‘Game Changer’ For Kuwaiti Banks


One of the most anticipated reforms of 2025 is a new mortgage law, now under discussion between government ministries, banks, and the Central Bank of Kuwait (CBK). If approved, the legislation, which has been under discussion for years, would allow commercial lenders to issue housing loans; currently, only the state-owned Kuwait Credit Bank may do so.

“That’s a game changer for banks in Kuwait,” says Ahmed Al-Duwaisan, acting CEO and managing director of Corporate Banking at Al Ahli Bank of Kuwait. “Once the mortgage law comes out, it would help the retail business significantly. That’s a new avenue for conventional banks like us.”

According to local media reports, the new law would allow commercial banks to lend up to $750,000 over a term of up to 25 or 30 years; the current cap is 15 years. The required debt-to-income ratio is also expected to increase, giving borrowers more flexibility.

With over 100,000 pending home-loan applications, demand is immense, but also a significant growth opportunity for Kuwait’s banking industry.

“As government discussions on mortgages ramp up again,” says Abdullah Al-Tuwaijri, CEO of Consumer, Private & Digital Banking at Boubyan Bank, “we believe there to be an opportunity for all banks to contribute to solving the housing problem in Kuwait, which in turn will lead to additional potential growth opportunities.”

The proposed reforms are also expected to impact real estate investment.

“Reforms such as the proposed mortgage law and the recently implemented laws to prevent land monopoly will support local real estate, which is an important asset class for investors,” says Ali Khalil, CEO of Markaz, a Kuwaiti asset management and investment bank. The emirate’s real estate market has already shown impressive growth, as sales increased 36% year-over-year in 2024. And housing is expected to be a key driver in the government’s ambitious $121 billion suite of megaprojects, further fueling the sector’s expansion.


Source link

Heritage’s Long Beach US Coins Auction Tops $22 Million


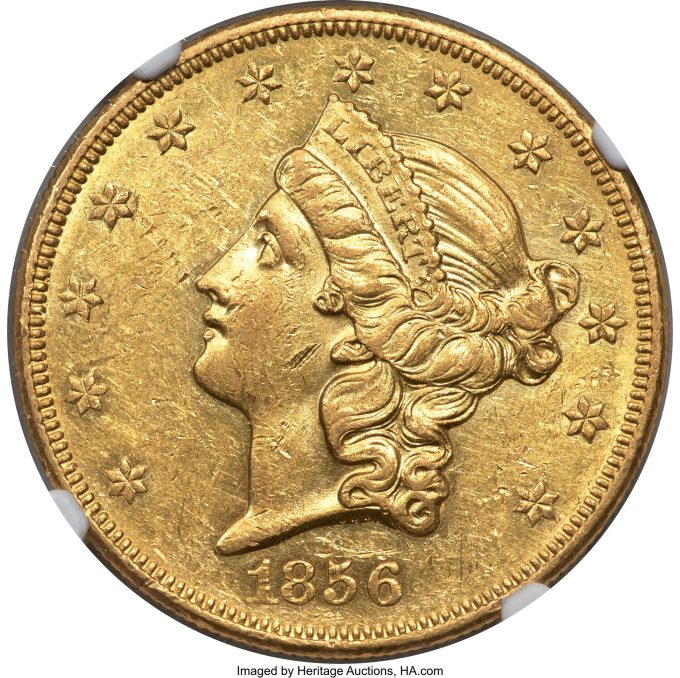
An 1856-O Liberty Double Eagle, AU58 PCGS. Winter 1 sold for a record $690,000 to lead Heritage’s February 27-March 2 Long Beach Expo US Coins Signature® Auction to $22,246,194.

1856-O Liberty Double Eagle, AU58

The result for this magnificent coin raced past the previous record of $576,150 that was set at Heritage Auctions in 2008.

Part of The Mississippi Collection of Double Eagles, Part II that produced many of the top results in the auction, this exceptional coin once was a part of the prestigious collection of Louis E. Eliasberg, Sr. It is the third-finest of the 1856-O, which is a premier rarity in the Liberty double eagle series, a group that boasts the smallest mintage – 2,250 – of any double eagle from the New Orleans Mint.

“This record is a fitting result for such a magnificent coin coming from such an exceptional collection,” says Greg Rohan, President of Heritage Auctions. “It’s an exceedingly rare coin that understandably drew major interest from serious double eagle collectors on its way to this record result.”

The 1856-O Liberty Double Eagle flew highest, but was hardly the only record setter.

  • The finest of three known examples of an 1836 Gobrecht Dollar, Judd-63 Restrike, PR63 Cameo PCGS. CAC drew 40 bids on its way to $192,000, surpassing the previous auction record of $149,500 that was set first in 2003 and then matched in 2009 at Heritage. Any Judd-63 is an exceptional rarity, including this beautiful example, which can be traced to 1884.
    1836 Gobrecht Dollar, PR63 Cameo
    1836 Gobrecht Dollar, PR63 Cameo
  • An 1896-S Liberty Eagle, MS67 PCGS. CAC brought a winning bid of $156,000, smashing the previous auction record of $31,200 that was set at Heritage in 2021. This is the finest certified example of this elusive rarity by two full grading points.
    1896-S Liberty Eagle, MS67 CAC
    1896-S Liberty Eagle, MS67 CAC
  • Also setting a new record at $156,000 was the finest of just six known examples of an 1841 Seated Dollar, PR64 PCGS CAC. Further elevating the demand is the fact that of the six examples, not all have been available to the collecting community; one is impounded in the Smithsonian’s National Numismatic Collection, and another is a recently discovered impaired proof, meaning the coin offered here is one of just four confirmed non-impaired proofs available to collectors.
    1841 Seated Dollar, PR64 CAC
    1841 Seated Dollar, PR64 CAC
  • Like the top lot in the auction, an 1850-O Double Eagle, MS61 PCGS. CAC. Winter-1 came from the Mississippi Collection of Double Eagles to achieve a record result when it sold for $132,000, eclipsing the record of $111,625 that was set in 2014 at Heritage Auctions. This example is one of just two awarded a Mint State grade by PCGS out of more than 320 it has certified in all grades.
    1850-O Double Eagle, MS61
    1850-O Double Eagle, MS61

In all, 16 lots in the auction brought more than $100,000 – a list that included:

  • Eighty-six bids poured in for one of the highest-graded examples of an 1870-CC Liberty Double Eagle, AU53 NGC. Winter 1-A before it ended at $588,000. The 1870-CC is a classic rarity in the Liberty double eagle series, from the first year of coinage operations at the famous Carson City Mint. It has the lowest mintage – 3,789 – in the Carson City series, and estimates of the surviving population range from 40 to 65.
    1870-CC Liberty Double Eagle, AU53
    1870-CC Liberty Double Eagle, AU53
  • A magnificent example of a coin of virtually unsurpassed historical, economic and social importance, an 1851 Humbert Fifty Dollar, Lettered Edge, 887 Thous., 50 Reverse, MS62+ PCGS drew a winning bid of $456,000. Once a part of the Bob R. Simpson Collection, Part III, this example stands as one of the finest known representatives of this storied issue.
    1851 Humbert Fifty Dollar, MS62+
    1851 Humbert Fifty Dollar, MS62+
  • From the Ron L. Cates Collection, an extraordinary1870-CC Double Eagle, XF40 PCGS. Winter 1-A brought $348,000. The 1870-CC is one of the most famous issues that originated at the historic Carson City Branch Mint, and is coveted by collectors. One of just 10 examples carrying a PCGS grade of 40, this beauty sparked 107 bids before landing in a new collection.
    1870-CC Double Eagle, XF40
    1870-CC Double Eagle, XF40
  • One of the unquestioned treasures in the auction was a 58.77-ounce Kellogg & Humbert Gold Ingot from the S.S. Central America that reached $186,000. It comes from one of the most respected private assayers of California’s Gold Rush period, a firm that produced gold coinage alongside the early operations of the San Francisco Mint. Gold bars produced by the Kellogg & Humbert firm eventually were absorbed into various mints and melted down for sovereign coinage, but a large number of bars survived via the S.S. Central America shipwreck, including this stunner.
    Kellogg & Humbert Gold Ingot
    Kellogg & Humbert Gold Ingot
  • A 1921 Saint-Gaudens Double Eagle, MS62+ NGC climbed to $144,000. Demand for gold coinage diminished when foreign trade was limited during World War I, so the Mint stopped striking gold coinage between 1916 and 1920. Large denomination coins were still convenient for settling large accounts in foreign trade, however, and the government was required to back its paper currency with a substantial gold reserve. The 1921 Saint-Gaudens double eagle is a sought-after rarity in the popular series today. Roger Burdette estimates no more than 175 examples survive in all grades, and high-quality specimens are especially elusive. David Akers called the 1921 the premier condition rarity of the Saint-Gaudens double eagle series.
    1921 Saint-Gaudens Double Eagle, MS62+
    1921 Saint-Gaudens Double Eagle, MS62+

Other top results in the auction included, but were not limited to:

Complete results can be found at HA.com/1381.

About Heritage Auctions

Heritage Auctions is the largest fine art and collectibles auction house founded in the United States, and the world’s largest collectibles auctioneer. Heritage maintains offices in New York, Dallas, Beverly Hills, Chicago, Palm Beach, London, Paris, Amsterdam, Brussels, Munich, Hong Kong and Tokyo.

Heritage also enjoys the highest Online traffic and dollar volume of any auction house on earth (source: SimilarWeb and Hiscox Report). The Internet’s most popular auction-house website, HA.com, has more than 1,750,000 registered bidder-members and searchable free archives of more than 6,000,000 past auction records with prices realized, descriptions and enlargeable photos. Reproduction rights routinely granted to media for photo credit.


Source link

2025 High Dividend Stocks List


Article updated on March 5th, 2025 by Bob Ciura

Spreadsheet data updated daily

High dividend stocks are stocks with a dividend yield well in excess of the market average dividend yield of ~1.3%.

The resources in this report focus on truly high yielding securities, often with dividend yields multiples higher than the market average.

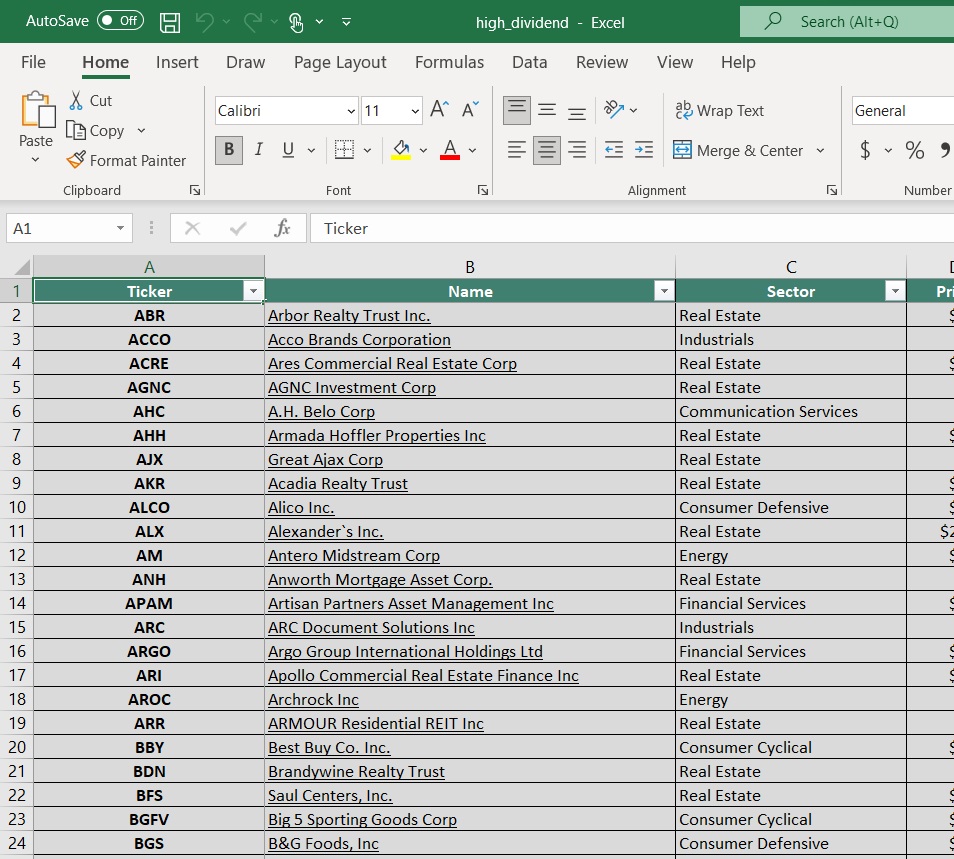
Resource #1: The High Dividend Stocks List Spreadsheet


Note: The spreadsheet uses the Wilshire 5000 as the universe of securities from which to select, plus a few additional securities we screen for with 5%+ dividend yields.

The free high dividend stocks list spreadsheet has our full list of ~140 individual securities (stocks, REITs, MLPs, etc.) with 5%+ dividend yields.

The high dividend stocks spreadsheet has important metrics to help you find compelling ultra high yield income investing ideas. These metrics include:

  • Market cap
  • Payout ratio
  • Dividend yield
  • Trailing P/E ratio
  • Annualized 5-year dividend growth rate

Resource #2: The 7 Best High Yield Stocks Now
This resource analyzes the 7 best high-yield stocks in detail. The criteria we use to rank high dividend securities in this resource are:

  • Is in the 870+ income security Sure Analysis Research Database
  • Rank based on dividend yield, from highest to lowest
  • Dividend Risk Scores of C or better
  • Based in the U.S.

Additionally, a maximum of three stocks are allowed for any single sector to ensure diversification.

Resource #3: The High Dividend 50 Series
The High Dividend 50 Series is where we analyze the 50 highest-yielding securities in the Sure Analysis Research Database. The series consists of 50 stand-alone analysis reports on these securities.

Resource #4: More High-Yield Investing Research
– How to calculate your income per month based on dividend yield
– The risks of high-yield investing
– Other high dividend research

The 7 Best High Yield Stocks Now

This resource analyzes the 7 best high yielding securities in the Sure Analysis Research Database as ranked by the following criteria:

  • Rank based on dividend yield, from highest to lowest
  • Dividend Risk Scores of C or better
  • Based in the U.S.

Note: Ranking data is from the current edition of the Sure Analysis spreadsheet.

Additionally, a maximum of three stocks are allowed for any single market sector to ensure diversification.

It’s difficult to define ‘best’. Here, we are using ‘best’ in terms of highest yields with reasonable and better dividend safety.

A tremendous amount of research goes into finding these 7 high yield securities. We analyze more than 850 income securities every quarter in the Sure Analysis Research Database. This is real analysis done by our analyst team, not a quick computer screen.

“So I think it was just looking at different companies and I always thought if you looked at 10 companies, you’d find one that’s interesting, if you’d look at 20, you’d find two, or if you look at 100 you’ll find 10. The person that turns over the most rocks wins the game. I’ve also found this to be true in my personal investing.”
– Investing legend Peter Lynch

Click here to download a PDF report for just one of the 850+ income securities we cover in Sure Analysis to get an idea of the level of work that goes into finding compelling income investments for our audience.

The 7 best high yield securities are listed in order by dividend yield below, from lowest to highest.

High Dividend Stock #7: Enterprise Products Partners LP (EPD)

  • Dividend Yield: 6.4%
  • Dividend Risk Score: B

Enterprise Products Partners was founded in 1968. It is structured as a Master Limited Partnership, or MLP, and operates as an oil and gas storage and transportation company.

Enterprise Products has a large asset base which consists of nearly 50,000 miles of natural gas, natural gas liquids, crude oil, and refined products pipelines.

It also has storage capacity of more than 250 million barrels. These assets collect fees based on volumes of materials transported and stored.

Source: Investor Presentation

Enterprise Products Partners reported strong fourth-quarter 2024 earnings, delivering $1.6 billion in net income, or $0.74 per common unit, representing a 3% increase over the prior year.

Adjusted cash flow from operations rose 4% to $2.3 billion, with the company declaring a quarterly distribution of $0.535 per unit, a 4% year-over-year increase.

Enterprise also continued its capital return strategy, repurchasing 2.1 million common units during the quarter and 7.6 million units for the full year, bringing total buybacks under its program to $1.1 billion.

For the full year, the company posted $9.9 billion in EBITDA, moving 12.9 million barrels of oil equivalent per day.

Click here to download our most recent Sure Analysis report on EPD (preview of page 1 of 3 shown below):

High Dividend Stock #6: Polaris Inc. (PII)

  • Dividend Yield: 6.6%
  • Dividend Risk Score: B

Polaris designs, engineers, and manufactures snowmobiles, all-terrain vehicles (ATVs) and motorcycles. In addition, related accessories and replacement parts are sold with these vehicles through dealers located throughout the U.S.

The company operates under 30+ brands including Polaris, Ranger, RZR, Sportsman, Indian Motorcycle, Slingshot and Transamerican Auto Parts. The global powersports maker, serving over 100 countries, generated $7.2 billion in sales in 2024.

Source: Investor Presentation

On January 28th, 2025, Polaris announced fourth quarter and full year results. For the quarter, revenue declined 23.6% to $1.75 billion, but this was $70 million higher than excepted. Adjusted earnings-per-share of $0.92 compared very unfavorably to $1.98 in the prior year, but topped estimates by $0.02.

For the year, revenue fell 19.7% to $7.12 billion while adjusted earnings-per-share of $3.25 was down from $9.16 in 2023.

For the quarter, Marine sales declined 4%, On-Road was lower by 21%, and Off-Road, the largest component of the company, decreased 25%.

As with previous quarters, decreases in all three businesses were mostly due to lower volumes. Off-Road was also negatively impacted planned reductions in shipments. Parts, Garments, and Accessories were weaker in the Off-Road and On-Road segments.

Click here to download our most recent Sure Analysis report on PII (preview of page 1 of 3 shown below):

High Dividend Stock #5: MPLX LP (MPLX)

  • Dividend Yield: 7.2%
  • Dividend Risk Score: C

MPLX LP is a Master Limited Partnership that was formed by the Marathon Petroleum Corporation (MPC) in 2012. In 2019, MPLX acquired Andeavor Logistics LP.

The business operates in two segments:

  • Logistics and Storage, which relates to crude oil and refined petroleum products
  • Gathering and Processing, which relates to natural gas and natural gas liquids (NGLs)

In early February, MPLX reported (2/4/25) financial results for the fourth quarter of fiscal 2024. Adjusted EBITDA and distributable cash flow (DCF) per share grew 9% and 7%, respectively, primarily thanks to higher tariff rates and increased volumes of liquids and gas.

MPLX maintained a healthy consolidated debt to adjusted EBITDA ratio of 3.1x and a solid distribution coverage ratio of 1.5x.

Click here to download our most recent Sure Analysis report on MPLX (preview of page 1 of 3 shown below):

High Dividend Stock #4: Altria Group (MO)

  • Dividend Yield: 7.2%
  • Dividend Risk Score: B

Altria is a tobacco stock that sells cigarettes, chewing tobacco, cigars, e-cigarettes, and more under a variety of brands, including Marlboro, Skoal, and Copenhagen, among others.

With a current dividend yield of nearly 8%, Altria is an ideal retirement investment stock.

This is a period of transition for Altria. The decline in the U.S. smoking rate continues. In response, Altria has invested heavily in new products that appeal to changing consumer preferences, as the smoke-free category continues to grow.

Source: Investor Presentation

The company also has a 35% investment stake in e-cigarette maker JUUL, and a 45% stake in the Canadian cannabis producer Cronos Group (CRON).

Altria Group reported solid financial results for the fourth quarter and full year of 2024. For the fourth quarter, revenue of $5.1 billion beat analyst estimates by $50 million, and increased 1.6% year-over-year. Adjusted EPS of $1.29 beat by a penny.

For the full year, Altria generated adjusted diluted EPS growth of 3.4% and returned over $10.2 billion to shareholders through dividends and share repurchases.

For 2025, Altria expects adjusted diluted EPS in a range of $5.22 to $5.37. This represents an adjusted diluted EPS growth rate of 2% to 5% for 2025.

Click here to download our most recent Sure Analysis report on Altria (preview of page 1 of 3 shown below):

High Dividend Stock #3: Universal Health Realty Income Trust (UHT)

  • Dividend Yield: 7.3%
  • Dividend Risk Score: B

Universal Health Realty Income Trust operates as a real estate investment trust (REIT), specializing in the healthcare sector. The trust owns healthcare and human service-related facilities.

Its property portfolio includes acute care hospitals, medical office buildings, rehabilitation hospitals, behavioral healthcare facilities, sub-acute care facilities and childcare centers. Universal Health’s portfolio consists of 69 properties in 20 states.

On October 24, 2024, UHT reported its third quarter results. Funds from Operations (FFO) saw a slight improvement, rising to $11.3 million, or $0.82 per diluted share, from $11.2 million, or $0.81 per diluted share, in the third quarter of 2023. This increase in FFO was mainly due to the rise in net income during the period.

The company maintained a strong liquidity position with significant cash reserves and continued strategic investments to enhance its property portfolio.

Click here to download our most recent Sure Analysis report on UHT (preview of page 1 of 3 shown below):

High Dividend Stock #2: Whirlpool Corp. (WHR)

  • Dividend Yield: 7.7%
  • Dividend Risk Score: B

Whirlpool Corporation, founded in 1955 and headquartered in Benton Harbor, MI, is a leading home appliance company with top brands Whirlpool, KitchenAid, and Maytag.

Roughly half of the company’s sales are in North America, but Whirlpool does business around the world under twelve principal brand names. The company, which employs about 44,000 people, generated nearly $17 billion in sales in 2024.

On January 29th, 2025, Whirpool reported fourth quarter 2024 results. Sales for the quarter totaled $4.14 billion, down 18.7% from fourth quarter 2023. Ongoing earnings per diluted share was $4.57 for the quarter, 19% higher than the previous year’s $3.85 per share.

Whirlpool issued its 2025 guidance, seeing ongoing earnings-per-share coming in at approximately $10.00 on revenue of $15.8 billion. Additionally, Whirlpool expects cash provided by operating activities to total roughly $1 billion, with $500 to $600 million in free cash flow.

Click here to download our most recent Sure Analysis report on WHR (preview of page 1 of 3 shown below):


High Dividend Stock #1: Western Union (WU)

  • Dividend Yield: 9.2%
  • Dividend Risk Score: C

The Western Union Company is the world leader in the business of domestic and international money transfers. The company has a network of approximately 550,000 agents globally and operates in more than 200 countries.

About 90% of agents are outside of the US. Western Union operates two business segments, Consumer-to-Consumer (C2C) and Other (bill payments in the US and Argentina).

Western Union reported mixed Q4 2024 results on February 4th, 2025. Revenue increased 1% and diluted GAAP earnings per share increased to $1.14 in the quarter, compared to $0.35 in the prior year on higher revenue and a $0.75 tax benefit on reorganizing the international operations.

Revenue rose, despite challenges in Iraq on higher Banded Digital transactions and Consumer Services volumes.

CMT revenue fell 4% year-over-year even with 3% higher transaction volumes. Branded Digital Money Transfer CMT revenues increased 7% as transactions rose 13%. Digital revenue is now 25% of total CMT revenue and 32% of transactions.

Consumer Services revenue rose 56% on new products and expansion of retail foreign exchange offerings. The firm launched a media network business, expanded retail foreign exchange, and grew retail money orders.

Click here to download our most recent Sure Analysis report on WU (preview of page 1 of 3 shown below):

The High Dividend 50 Series

The High Dividend 50 Series is analysis on the 50 highest-yielding Sure Analysis Research Database stocks, excluding royalty trusts, BDCs, REITs, and MLPs.

Click on a company’s name to view the high dividend 50 series article for that company. A link to the specific Sure Analysis Research Database report page for each security is included as well.

More High-Yield Investing Resources

How To Calculate Your Monthly Income Based On Dividend Yield

A common question for income investors is “how much money can I expect to receive per month from my investment?”

To find your monthly income, follow these steps:

  1. Find your investment’s dividend yield
    Note: Dividend yield can be calculated as dividends per share divided by share price
  2. Multiply it by the current value of your holding
    Note: If you haven’t yet invested, multiply dividend yield by the amount you plan to invest
  3. Divide this number by 12 to find monthly income

To find the monthly income from your entire portfolio, repeat the above calculation for each of your holdings and add them together.

You can also use this formula backwards to find the dividend yield you need from your investments to make a certain amount of monthly dividend income.

The example below assumes you want to know what dividend yield you need on a $240,000 investment to generate $1,000/month in dividend income.

  1. Multiply $1,000 by 12 to find annual income target of $12,000
  2. Divide $12,000 by your investment amount of $240,000 to find your target yield of 5.0%

In practice most dividend stocks pay dividends quarterly, so you would actually receive 3x the monthly amount quarterly instead of receiving a payment every month. However, some stocks do actually pay monthly dividends.

You can see our monthly dividend stocks list here.

The Risks Of High-Yield Investing

Investing in high-yield stocks is a great way to generate income. But it is not without risks.

First, stock prices fluctuate. Investors need to understand their risk tolerance before investing in high dividend stocks. Share price fluctuations means that your investment can (and almost certainly will) decline in value, at least temporarily (and possibly permanently) do to market volatility.

Second, businesses grow and decline. Investing in a stock gives you fractional ownership in the underlying business. Some businesses grow over time. These businesses are likely to pay higher dividends over time.

The Dividend Champions are an excellent example of this; each has paid rising dividends for 25+ consecutive years.

What’s dangerous is when a business declines. Dividends are paid out of a company’s cash flows. If the business sees its cash flows decline, or worse is losing money, it may reduce or eliminate its dividend.

Business decline is a real risk with high yield investing. Business declines often coincide with and or accelerate during recessions.

A company’s payout ratio gives a good gauge of how much ‘room’ a company has to pay its dividend. The payout ratio is calculated as dividends divided by income.

The lower the payout ratio, the better, because dividends have more earnings coverage.

A company with a payout ratio over 100% is paying out more in dividends than it is making in profits, a long-term unsustainable situation.

For example, a company with a payout ratio of 50% is making double in income what it is paying out in dividends, so it has ‘room’ for earnings to decline significantly without reducing its dividend.

Third, management teams can change their dividend policies. Even if a company isn’t declining, the company’s management team may change priorities and reduce or eliminate its dividend.

In practice, this typically occurs if a company has a high level of debt and wants to focus on debt reduction. But it could in theory happen to any dividend paying stock.

The risks of high yield investing can be reduced (but not eliminated) by investing in higher quality businesses in a diversified portfolio of 20 or more stocks.

This reduces both business decline risk (by investing in high quality businesses) and the shock to your portfolio if any one stock does reduce or eliminate its dividend (through diversification).

Other High Dividend Research

The free spreadsheet of 5%+ dividend yield stocks in this article gives you more than 140 high yield income securities to review. You can download it below:


Investors should continue to monitor each stock to make sure their fundamentals and growth remain on track, particularly among stocks with extremely high dividend yields.

See the resources below to generate additional compelling investment ideas for dividend growth stocks and/or high-yield investment securities.

Thanks for reading this article. Please send any feedback, corrections, or questions to [email protected].


Source link

Two Strong Setups for the Coming Rally


A big slowdown in job growth … statistics and perspective on this pullback … gold miners are trading at discount valuations … two trades to consider

Job creation hit the brakes last month.

This morning, ADP’s private sector jobs report showed February’s gains clocked in at just 77,000 workers. That’s miles beneath January’s revised number of 186,000 and substantially lower than the consensus estimate of 148,000.

For what’s behind the slowdown, here’s Nela Richardson, ADP’s chief economist:

Policy uncertainty and a slowdown in consumer spending might have led to layoffs or a slowdown in hiring last month.

Our data, combined with other recent indicators, suggests a hiring hesitancy among employers as they assess the economic climate ahead.

As we’ve been highlighting here in the Digest, “uncertainty” is the big market overhang today.

Will President Trump’s tariffs be fleeting or long-term? How will they impact corporate profits? How will they affect consumer spending? How will they influence inflation and the Fed’s interest rate policy?

This swirl of questions has weighed on the market since mid-February.

As we’re going to press, we’re getting welcomed news that’s helping the market

President Trump has given a one-month tariff exemption to the big three U.S. automakers.

From Press Secretary Karoline Leavitt:

Reciprocal tariffs will still go into effect on April 2, but at the request of the companies associated with USMCA, the president is giving them an exemption for one month so they are not at an economic disadvantage.

Stocks are rallying on the news. The hope is that this is a foreshadowing of additional tariff concessions to come.

Meanwhile, earlier today, Commerce Secretary Howard Lutnick suggested the Trump administration could scale back tariffs on Canadian and Mexican goods. An announcement with more details could come as soon as this afternoon. As we go to press, that update hasn’t arrived.

But even if that announcement comes, a “scale back” isn’t a “removal.” And so, the impact of scaled-back-yet-sustained tariffs remains an uncertainty…which Wall Street hates.

Returning to jobs, the most important report comes on Friday with the Labor Department’s Bureau of Labor Statistics report on nonfarm payrolls. It could be a market mover.

We’ll report back.

One thing to remember if the recent market drawdown has you feeling rattled…

It’s normal.

As I write, the S&P is down about 5% from its high. This doesn’t even register as a “correction,” as defined by “down 10% from the most recent high.”

So, in the grand scheme of things, this is far less a massive 10-car pileup, and more so the slightest of parking lot fender benders.

But what if we get a 10% correction, or even something a bit deeper?

Such pullbacks are commonplace in Wall Street’s long history. Here’s some perspective from Kiplinger:

Since the 1950s, the S&P 500 has experienced around 38 market corrections. That means that historically speaking, the S&P 500 has experienced a correction every 1.84 years.

Considering that the S&P’s last correction came in 2022, we’re basically right on schedule.

And how long should we be prepared to endure this?

Obviously, no one knows. But American Century Investments crunched the numbers and found that if this pullback reaches “correction” territory but doesn’t slip into a full bear market, then, on average, we’re in for a 14% drawdown that will last about four months.

How do you manage your portfolio during such a drawdown?

A study of market history shows that the best thing to do is ignore it.

Of course, if your specific investment timeline and/or financial situation requires you to pull your money out of the market, do what you must. But if you’re investing for a longer period, log out of your brokerage account and go live your life as you wait for the inevitable rebound.

Here’s Schwab with perspective on that eventual bounce:

Occasional pullbacks have historically been followed by rebounds, according to the Schwab Center for Financial Research.

Since 1974, the S&P 500 has risen an average of more than 8% one month after a market correction bottom and more than 24% one year later.

Schwab delved into additional historical data on corrections, concluding:

Despite these pullbacks, however, stocks rose in most years, with positive returns in all but 3 years and an average gain of approximately 7%.

This brings to mind the 2025 market forecast from our hypergrowth expert Luke Lango, editor of Innovation Investor:

We think this will be the pattern for the stock market for the foreseeable future: two steps forward, one step back. Lather, rinse, repeat. 

And yet, I still think stocks are going higher in 2025.

Bottom line: Pullbacks like the one we’ve been experiencing today are 100% normal. Take it in stride.

A different way to play the gold bull market

As I write Wednesday, the yellow metal is barely 0.3% below a new all-time high.

But rather than discuss investing in gold today, let’s highlight gold miners. You can think of this as investing in gold yet with operating leverage. 

You see, there’s something strange happening with miners today…

While gold’s price has been hitting new highs in recent months, sentiment toward miners has been lukewarm at best. This is resulting in valuations near historic lows.

Here’s Barron’s from last month:

Gold stocks, despite their gains, really do look like bargains.

The VanEck ETF trades at just over 12 times 12-month forward earnings, a 44% discount to the S&P 500’s 22 times, a much wider gap than the 10-year average of 20%.

Narrowing the price/earnings gap to that average discount would bring the ETF up to just over 16 times, landing it, once again, at $51.

Let’s get a visual on this inconsistency between gold and miners.

As you can see below, since spring 2022, while gold has climbed almost 50%, gold miners, as represented by the VanEck Gold Miners ETF, GDX, are basically flat.

(Disclosure: I own GDX.)

Chart showing gold up 50% since summer 2022 while GDX is mosly flat

Source: TradingView

This is abnormal. Typically, top-tier gold mining stocks make moves that are 2X- 3X the size of gold’s move. This reflects the swelling profits that miners enjoy as gold’s market price rises above breakeven costs…or the snowballing losses they suffer when prices swing the opposite way.

Recently, miners haven’t been commanding this premium. Here’s Mining.com:

The gold miners’ stock prices have largely decoupled from their metal, which overwhelmingly drives their profits.

This fundamental disconnect has spawned a shocking valuation anomaly, with gold stocks far too low relative to gold. But this aberration won’t last, as markets abhor extreme deviations from precedent.

Mean reversions and proportional overshoots soon follow, so gold stocks will soar to reflect their record earnings.

But why are miners lagging so badly?

First, miners usually sell their gold based on long-term contracts or hedging strategies. This creates a lag in profits even as gold hits all-time highs.

Beyond that, the question is usually better answered on a case-by-case basis. But here are some of the top reasons why miners are lagging:

  • They’ve faced higher operating costs due to inflation
  • Environmental and regulatory costs have also increased
  • Some miners have a history of poor capital allocation (bad acquisitions, excessive debt, shareholder dilution)
  • Many mines operate in politically unstable regions, leading to supply chain disruptions, government intervention, or nationalization risks

Remember to do your due diligence and be discerning about which miners you buy, but the opportunity today looks compelling.

For your own research, I’d recommend looking at Agnico Eagle Mines (AEM) and Alamos Gold (AGI). They’re generating enormous free cash flow today. And, of course, there’s GDX, which gives you exposure to a basket of top miners.

Finally, are you feeling courageous?

One of Warren Buffett’s most famous quotes is to “be fearful when others are greedy and to be greedy only when others are fearful.”

Well, we’ve got the “Fear” part covered.

Even though stocks are up as I write Wednesday, CNN’s Fear & Greed Index puts us at “Extreme Fear.”

Chart of CNN's Fear & Greed Indicator showing Extreme Fear

Source: CNN

So, are you ready to be greedy?

If so, here’s an idea…

According to TrendSpider, the trade is to buy QQQ (a fund that tracks the Nasdaq 100) when its price is 10%+ off its 20-week range high.

In the last 10 years, when following this entry signal, the average returns six months later have been 13.5% with an 82% win-rate.

Here’s the chart from TrendSpider.

Chart showing QQQ and the ensuing returns after a certain trade entry trigger

Source: TrendSpider

For another idea, I’d point you to our global macro expert, Eric Fry, the editor behind Leverage

In Leverage, Eric recommends LEAPS trades, which stands for “Long-Term Equity Anticipation Security.” You can think of this as an option with a longer-dated expiration, usually lasting from one to three years.

One of the main reasons to use LEAPS is because of the “leverage” they afford investors. As Eric writes, you “put down a small investment to control a large amount of stock.”

As an example of the potential payoff, last month, Leverage subscribers locked in gains of nearly 300% on their Dutch Bros. Inc. (BROS) call options that they opened in July.

Now, less than two weeks ago, Eric recommended a miner that he called a “hidden” gold play.

From Eric:

[This miner’s] relatively low valuation underscores its identity as hidden gold play.

Its shares are trading for just six times gross earnings (EBITDA), which is 40% lower than the valuation of the Philadelphia Gold and Silver Index (XAU) stocks.

Since that recommendation, this stock has fallen slightly in sympathy with the broad market. But this is offering investors an even better entry price on what could be a monster trade if gold mining stocks roar higher as history suggests they’re likely to do.

To learn about joining Eric in Leverage to get the details on this trade, click here.  

If jumping into QQQ or Eric’s “hidden” gold trade makes you nervous…

That’s totally normal.

But here are a few words of wisdom from wise (and very successful) investors who have gone before us.

From billionaire Rob Arnott, founder and chairman of the board of Research Affiliates:

In investing, what is comfortable is rarely profitable.

And J.P. Morgan:

In bear markets, stocks return to their rightful owners.

Finally, Cullen Roche:

The stock market is the only market where things go on sale and all the customers run out of the store.

Bottom line: Don’t take on more risk than is appropriate for you and your financial situation, but recognize that one investor’s panic sale is another investor’s bargain entry price.

Have a good evening,

Jeff Remsburg


Source link

Global FX Outlook for March – United States


Despite early optimism in financial markets, the mood soured in the latter half of February due to weaker U.S. economic data, declines in AI and technology stocks, and tariffs threats on Canada, Mexico and China. FX markets experienced saw sharp losses and volatility, as measured by the Chicago Board of Trade’s VIX index, which jumped to the highest level of the year.

If this a sign of more big moves to come, is your business prepared to navigate the storm? Download our Global FX Outlook for February to stay ahead of market shifts and help your business manage currency risks.

Download the GFO report button

Event in focus: Who cuts when?

Markets face uncertainty as central banks reassess rate cut expectations amid shifting inflation and economic risks. The Fed, ECB, and BoE started 2024 planning to ease policy, but challenges remain.

In the U.S., the Fed remains caught between persistent core inflation and slowing growth. Headline inflation may have cooled, but weak retail sales and declining business sentiment are fueling concerns. With markets now expecting just two rate cuts in 2025, the Fed’s path remains unclear.

The European Central Bank has already begun easing, but fragile growth, slowing wages, and trade risks limit aggressive cuts. Meanwhile, the Bank of England faces the toughest challenge—stubborn inflation and high wages alongside stagnating growth and rising borrowing costs.

Chart showing market expectations for central bank policy rates

Trump moving markets

Global policy uncertainty has surged due to President Trump’s unpredictable leadership style and shifting political priorities. Markets are on edge as trade agreements are shaken up, alliances change, and the President takes an aggressive stance in economic negotiations. Investors face a backdrop where sudden policy changes and increased volatility have become the new normal. Global markets face heightened uncertainty as the world adjusts to this new reality.

Chart showing economic policy uncertainty (Oct. vs. Dec. '24)

Tariffs: Inflationary or stagflationary?

Expectations for a Federal Reserve rate cut in the first half of 2025 have been diminished. Inflation data came in stronger than expected, reinforcing concern that price pressures remain and forcing markets to reassess monetary easing timelines. Despite this, the US economy shows signs of slowing, with key indicators such as housing, consumer spending and services all underperforming. Risk assets and the US dollar are under pressure.

Dollar falls short of expectations

Stronger-than-expected inflation numbers have pared back expectations for Federal Reserve rate cut this year, however the U.S. dollar hasn’t strengthened. The absence of new tariffs has reduced safe-haven demand and the trade premium, while changing expectations for a Fed pause are being driven by rising inflation rather than macro data. Ultimately, the dollar has been unable to benefit from the Fed holding rates steady.

Charts showing global FX performance for 2025 (FX vs. USD)

Watch an overview of the March outlook

Watch our Market Insights team provide a short summary of the most crucial insights from the March Global FX Outlook and start making informed decisions for your business today.

Watch the GFO video button

For businesses making cross-border payments, this evolving landscape underscores the importance of proactive FX risk management. The combination of tariff threats, inflationary pressures, and monetary policy shifts will continue to drive currency fluctuations. Companies should consider hedging strategies and real-time FX insights to mitigate risks in an increasingly unpredictable market.

Want more insights on the topics shaping the future of cross-border payments? Tune in to Converge, with new episodes every Wednesday.

Plus, register for the Daily Market Update to get the latest currency news and FX analysis from our experts directly to your inbox.


Source link

Kuwait Doubles Down On Oil Infrastructure And Investment


In January 2024, Khaled Al-Sabah, CEO of Kuwait Petroleum Corporation (KPC), unveiled an ambitious $30 billion investment plan aimed at boosting the emirate’s oil production capacity by 40%. The target is to increase output from 2.8 million barrels per day (bpd) to 4 million bpd by 2040.

To turn ambition into reality, state-owned KPC, which has long relied on onshore reserves, is venturing into offshore exploration with a 6,000-square-kilometer area under review. Kuwait Oil Company (KOC), a KPC subsidiary, has already made significant strides with the discovery of two new fields: the 74-square-kilometer Al-Jlaiaa field, revealed in January, and the promising Al-Nokhatha field, which could contain up to 2.1 billion barrels of oil and 5.1 trillion cubic feet of natural gas. New gas discoveries are of particular interest to Kuwaitis, who currently rely on imports to meet local consumption needs.

The oil discoveries could pave the way for new business opportunities as well. While Kuwait remains cautious about foreign involvement in its hydrocarbons industry, KOC last year signed a contract with US-based SLB for the drilling of 141 new wells.

Kuwait’s hydrocarbons strategy does not stop at increasing production; it also includes enhancing existing infrastructure. In 2024, the emirate inaugurated the $30 billion Al Zour refinery, Kuwait’s largest and the seventh largest in the world. At full capacity, Al Zour is set to elevate the country’s refining capacity to 1.42 million bpd, up from a current 800,000.

In tandem with this expansion, Kuwait is looking to streamline its tentacular network of hydrocarbon institutions. Currently, KPC oversees eight subsidiaries, including KOC. Back in 2020, the government mandated PwC’s international consulting firm, Strategy&, to advise on possible consolidation. Today, it may be ready to merge some of these entities in a bid to boost efficiency. Local media are already reporting on potential mergers between Kuwait National Petroleum Company and Kuwait Integrated Petroleum Industries Company as well as KOC and Kuwait Gulf Oil Company.


Source link

Exec of a Leading Crypto Firm Pulls $1.3M From Ethereum (ETH) and Moves It Into Ripple (XRP) and a Cheap Altcoin Under $0.25


​In a bold move signaling shifting investor sentiment, an executive from a leading cryptocurrency firm has redirected $1.3 million from Ethereum to Ripple (XRP) and the lesser-known altcoin, Rexas Finance (RXS), currently priced under $0.25. This strategy underscores growing confidence in emerging tokens, particularly RXS, which experts believe could surpass $20 by Q1 2025 due to its innovative approach in the Real World Asset (RWA) tokenization market.

Rexas Finance: A New Frontier in Investment

Rexas Finance implements asset tokenization for real estate, art, and commodities to bring investment opportunities to a broad investor base. This system gives traditional illiquid assets access to fractional ownership, making them more liquid. Less capital allows investors to engage with Rexas Finance and obtain quicker returns. The executive’s recent decision demonstrates Rexas Finance’s new corporate direction toward an ever-evolving market environment. Since initiating its presale process, the token value has climbed from $0.03 to $0.2 while attracting retail and institutional players. Currently in its 12th stage of presale at $0.20 RXS is all set for its official launch on June 19th, 2025 at $0.25 which is a 7x surge from the initial price of 0.03. The Rexas ecosystem facilitates fast asset token creation and trading, which drives current token price appreciation. The project’s market credibility gains strength from early investment participation by prominent investors who operate during its initial development phase. With Rexas Finance, users access a powerful asset tokenization platform with two innovative components: Rexas AI Shield runs real-time audits for smart contracts, and Rexas Treasury operates as a multi-chain yield optimizer. Combining secure innovation features with high investment returns leads to increased daily investor participation. The executive’s investment validates Rexas Finance as a disruptive player within the cryptocurrency realm.

Ethereum: Stepping Stone to New Opportunities

Ethereum continues to dominate the cryptocurrency market, but investors shifted substantial funds away because of recent performance weaknesses. Investors wish to obtain elevated returns and unique opportunities, and Rexas Finance is a promising solution. Ethereum continues to provide fundamental support to alternative cryptocurrencies, including RXS. The significant financial movement represents a strategic move by veteran investors who want to access different growth opportunities. The widespread use of Ethereum created the foundations that support emerging cryptocurrencies to innovate and develop new platforms. The ecosystem relationship enables sector-wide expansion and the emergence of specialized market sectors such as RWA tokenization. Recent capital movements demonstrate a general tendency among investors who redirect their funds toward altcoins characterized by usable applications alongside substantial profit potential.

Ripple (XRP): A Steady Contender

Ripple maintains its ground amidst shifting market dynamics, maintaining investor interest with its cross-border payment solutions. As funds are redirected from Ethereum, XRP is a stable investment choice alongside more speculative ventures like Rexas Finance. Ripple’s consistent performance and ongoing developments in financial technology make it an attractive option for portfolio diversification. Investors value Ripple’s practical applications and stability in the volatile crypto market. Ripple benefits from increased liquidity and continued investor confidence as funds diversify into different cryptocurrencies. This balance of innovation and stability makes XRP a key player in the ongoing reallocation of crypto investments.

Rexas Finance: Poised for Unprecedented Growth

In conclusion, Rexas Finance is the primary beneficiary of the recent strategic investment shifts within the cryptocurrency sector. Its innovative approach to RWA tokenization positions it well above many current market offerings, promising significant returns and reshaping investment accessibility. The executive’s decision to invest heavily in RXS highlights its potential and sets the stage for its dominant rise in the crypto market. With such strong endorsements and a clear path to disrupting traditional asset investments, Rexas Finance is set to redefine the boundaries of cryptocurrency utility and investor engagement.

Website: https://rexas.com

Whitepaper: https://rexas.com/rexas-whitepaper.pdf

Twitter/X: https://x.com/rexasfinance

Telegram: https://t.me/rexasfinance

Disclaimer: The views and opinions presented in this article do not necessarily reflect the views of CoinCheckup. The content of this article should not be considered as investment advice. Always do your own research before deciding to buy, sell or transfer any crypto assets. Past returns do not always guarantee future profits.


Source link

Top 20 Highest Yielding Monthly Dividend Stocks Now


Updated on March 5th, 2025 by Bob Ciura

Monthly dividend stocks have instant appeal for many income investors. Stocks that pay their dividends each month offer more frequent payouts than traditional quarterly or semi-annual dividend payers.

For this reason, we created a full list of ~80 monthly dividend stocks.

You can download our full Excel spreadsheet of all monthly dividend stocks (along with metrics that matter like dividend yield and payout ratio) by clicking on the link below:


In addition, stocks that have high dividend yields are also attractive for income investors.

With the average S&P 500 yield hovering around 1.3%, investors can generate much more income with high-yield stocks. Screening for monthly dividend stocks that also have high dividend yields makes for an appealing combination.

This article will list the 20 highest-yielding monthly dividend stocks.

Table Of Contents

The following 20 monthly dividend stocks have high dividend yields above 5%. Stocks are listed by their dividend yields, from lowest to highest.

The list excludes oil and gas royalty trust, which have extreme fluctuations in their dividend payouts from one quarter to the next due to the underlying volatility of commodity prices.

The list also only includes U.S.-based companies.

You can instantly jump to an individual section of the article by utilizing the links below:

High-Yield Monthly Dividend Stock #20: LTC Properties (LTC)

LTC Properties is a REIT that invests in senior housing and skilled nursing properties. Its portfolio consists of approximately 50% senior housing and 50% skilled nursing properties.

The REIT owns 194 investments in 26 states, with 31 operating partners.

Source: Investor Presentation

In late February, LTC reported (2/24/25) financial results for the fourth quarter of fiscal 2024. Funds from operations (FFO) per share dipped -8% over the prior year’s quarter, from $0.72 to $0.66, and missed the analysts’ consensus by $0.01.

The decrease in FFO per share resulted primarily from impairment losses. LTC improved its leverage ratio (Net Debt to EBITDA) from 4.7x to 4.3x thanks to various asset sales.

Click here to download our most recent Sure Analysis report on LTC (preview of page 1 of 3 shown below):


High-Yield Monthly Dividend Stock #19: EPR Properties (EPR)

EPR Properties is a specialty real estate investment trust, or REIT, that invests in properties in specific market segments that require industry knowledge to operate effectively.

It selects properties it believes have strong return potential in Entertainment, Recreation, and Education. The portfolio includes about $7 billion in investments across 340+ locations in 44 states, including over 200 tenants.

Source: Investor Presentation

EPR posted fourth quarter and full-year earnings on February 26th, 2025, and results were better than expected on both the top and bottom lines.

Funds-from-operations came to $1.23, which was a penny ahead of estimates. Revenue was up 3% to $177 million, beating estimates by $16 million.

Adjusted FFO per-share was down from $1.29 in Q3, but higher from $1.16 in the year-ago period. Revenue was also down from Q3, but higher from the year-ago period.

Property operating expenses were $15.2 million, higher from $14.6 million in Q3, and $14.8 million a year ago. Adjusted EBITDAre of $136 million was lower from $143 million in Q3, but higher from $129 million last year.

Click here to download our most recent Sure Analysis report on EPR (preview of page 1 of 3 shown below):


High-Yield Monthly Dividend Stock #19: Apple Hospitality REIT (APLE)

Apple Hospitality REIT is a hotel REIT that owns a portfolio of hotels with tens of thousands of rooms located across dozens of states.

It franchises its properties out to leading brands, including Marriottbranded hotels, Hilton-branded hotels, and Hyatt-branded hotels.

Source: Investor Presentation

Since it first began reporting FFO/share in its annual reports (2011), Apple initially generated very impressive annualized FFO/share growth thanks to its growing scale (due in large part to a merger in 2015), effective and efficient business model, and strong economic tailwinds in the United States during that period.

Typically, during a recessionary period, hotel REITs experience significant losses of income. Therefore, Apple is likely not very recession resistant.

However, its concentration in strong brand names, excellent locations, strong balance sheet, franchising model, and emphasis on value should enable it to outperform its peers in a recession.

Click here to download our most recent Sure Analysis report on APLE (preview of page 1 of 3 shown below):

High-Yield Monthly Dividend Stock #18: Gladstone Capital (GLAD)

Gladstone Capital is a business development company, or BDC, that primarily invests in small and medium businesses. These investments are made via a variety of equity (10% of portfolio) and debt instruments (90% of portfolio), generally with very high yields.

Loan size is typically in the $7 million to $30 million range and has terms up to seven years.

Gladstone posted first quarter earnings on February 12th, 2025, and results were weaker than expected. Earnings-per-share came to 50 cents, well short of the estimate for 65 cents.

Total investment income, which is akin to revenue, was down $1.8 million, or 7.4%, year-over-year. Compared to the September quarter, total investment income fell by $2.1 million.

The net increase in net assets resulting from operations was $27 million, or $1.21 per share. This was lower than the $31.8 million, or $1.46 per share, gain in the September quarter.

Gladstone noted $152 million in new fundings for the quarter, including six new portfolio companies. Exits and prepayments were $165 million, so net new funding was -$13 million. Total debt investments rose by $45 million during the quarter.

Click here to download our most recent Sure Analysis report on GLAD (preview of page 1 of 3 shown below):

High-Yield Monthly Dividend Stock #17: Gladstone Investment Corporation (GAIN)

Gladstone Investment is a business development company (BDC) that focuses on US-based small- and medium-sized companies.

Industries which Gladstone Investment targets include aerospace & defense, oil & gas, machinery, electronics, and media & communications.

Gladstone Investment reported its third quarter (Q3 2024 ended December 31) earnings results on February 13. The company generated total investment income – Gladstone Investment’s revenue equivalent – of $21.4 million during the quarter, which represents a decline of 7% compared to the prior year’s quarter.

This was a weaker performance compared to the previous quarter, when the growth rate was positive.

Gladstone Investment’s adjusted net investment income-per-share totaled $0.23 during the fiscal third quarter. That was up slightly from the previous quarter’s level.

Gladstone Investment‘s net asset value per share totaled $13.30 on a per-share basis at the end of the quarter.

Click here to download our most recent Sure Analysis report on GAIN (preview of page 1 of 3 shown below):

High-Yield Monthly Dividend Stock #16: Gladstone Commercial (GOOD)

Gladstone Commercial Corporation is a real estate investment trust, or REIT, that specializes in single-tenant and anchored multi-tenant net leased industrial and office properties across the U.S.

The trust targets primary and secondary markets that possess favorable economic growth trends, growing populations, strong employment, and robust growth trends.

The trust’s stated goal is to pay shareholders monthly distributions, which it has done for more than 17 consecutive years. Gladstone owns over 100 properties in 24 states that are leased to about 100 unique tenants.

Gladstone posted fourth quarter and full-year earnings on February 18th, 2025, and results were somewhat weak. Funds-from-operations per share came to 35 cents, which met expectations. Revenue was $37.4 million, which missed estimates by $0.66 million. The slight move up in revenue was driven by higher straight-line rents.

Same-store rents were up 5% year-over-year, which was supported by increased straight-line rent rates and recovery revenue. Operating expenses were down to $25 million from $28.1 million a year ago, partially due to reduced impairment charges.

Click here to download our most recent Sure Analysis report on GOOD (preview of page 1 of 3 shown below):

High-Yield Monthly Dividend Stock #15: Modiv Industrial (MDV)

Modiv Industrial acquires, owns, and actively manages single-tenant net-lease industrial, retail, and office properties in the United States, focusing on strategically essential and mission-critical properties with predominantly investment-grade tenants.

As of its most recent filings, the company’s portfolio comprised 43 properties that occupied 4.5 million square feet of aggregate leasable area.

On March 4th, 2025, Modiv reported its Q4 and full-year results for the period ending December 31st, 2024. For the quarter, rental income came in at $11.7 million, down 4.8% year-over-year.

This was mainly due to the elimination of some non-NNN tenant reimbursements related to the August 2023 portfolio disposition of 13 properties.

Management fee income also fell from $99 thousand to $66 thousand. Thus, total income was $11.7 million, down 5.3% from $12.4 million last year.

AFFO was $4.1 million, or $0.37 per diluted share, down from AFFO of $4.5 million, or $0.40 per diluted share last year.

For the year, AFFO per share was $1.34. For FY2025, we expect AFFO per share of $1.38 based on the company’s current leasing profile.

Click here to download our most recent Sure Analysis report on MDV (preview of page 1 of 3 shown below):

High-Yield Monthly Dividend Stock #14: Itau Unibanco (ITUB)

Itaú Unibanco Holding S.A. is headquartered in Sao Paulo, Brazil. The bank has operations across South America and other places like the United States, Portugal, Switzerland, China, Japan, etc.

On November 5th, 2024, Itaú Unibanco reported third-quarter results for 2024. The company reported recurring managerial result for the third quarter of 2024 was approximately $2.1 billion USD, reflecting a 6.0% increase from the previous quarter.

The recurring managerial return on equity stood at 22.7% on a consolidated basis and 23.8% for operations in Brazil. Total assets grew by 2.6%, surpassing $590 billion USD, while the loan portfolio increased by 1.9% globally and 2.1% in Brazil for the quarter, with year-on-year growth rates of 9.9% and 10.0%, respectively.

Key drivers included personal, vehicle, and mortgage loans, which saw quarterly growth rates of 3.1%, 3.0%, and 3.9%, respectively.

Click here to download our most recent Sure Analysis report on ITUB (preview of page 1 of 3 shown below):

High-Yield Monthly Dividend Stock #13: Fortitude Gold (FTCO)

Fortitude Gold is a junior gold producer with operations in Nevada, U.S.A, one of the world’s premier mining friendly jurisdictions. The company targets high-grade gold open pit heap leach operations averaging one gram per tonne of gold or greater.

Its property portfolio currently consists of 100% ownership in six high-grade gold properties. All six properties are within an approximate 30-mile radius of one another within the prolific Walker Lane Mineral Belt.

Source: Investor Presentation

On November 5th, 2024, Fortitude Gold released its Q3 results for the period ending September 30st, 2024. For the quarter, revenues came in at $10.2 million, 52% lower compared to last year.

The decline in revenues was primarily due to a 62% drop in gold sales volume and a 54% decrease in silver sales volume. However, these reductions were partially offset by a 26% increase in gold prices and a 23% rise in silver prices.

Click here to download our most recent Sure Analysis report on FTCO (preview of page 1 of 3 shown below):

High-Yield Monthly Dividend Stock #11: Stellus Capital (SCM)

Stellus Capital Management provides capital solutions to companies with $5 million to $50 million of EBITDA and does so with a variety of instruments, the majority of which are debt.

Stellus provides first lien, second lien, mezzanine, convertible debt, and equity investments to a diverse group of customers, generally at high yields, in the US and Canada.

Source: Investor Presentation

Stellus posted third quarter earnings on November 7th, 2024, and results were quite weak on both the top and bottom lines. Net investment income, which is similar to earnings-per-share, came to 40 cents.

This was four cents light of estimates, or about 9%. Total investment income was $26.5 million, down 2.5% year-over-year, and missing estimates by $1.34 million.

Gross operating expenses were $16.2 million, which was essentially flat year-over-year. Base management fees totaled $3.9 million for this year’s Q3 and the same period a year ago.

Click here to download our most recent Sure Analysis report on Stellus (preview of page 1 of 3 shown below):

High-Yield Monthly Dividend Stock #10: Ellington Financial (EFC)

Ellington Financial Inc. acquires and manages mortgage, consumer, corporate, and other related financial assets in the United States.

The company acquires and manages residential mortgage–backed securities (RMBS) backed by prime jumbo, Alt–A, manufactured housing, and subprime residential mortgage loans.

Source: Investor Presentation

Additionally, it manages RMBS, for which the U.S. government guarantees the principal and interest payments. It also provides collateralized loan obligations, mortgage–related and non–mortgage–related derivatives, equity investments in mortgage originators and other strategic investments.

On November 6th, 2024, Ellington Financial reported its Q3 results for the period ending September 30th, 2024. Adjusted (previously referred to as “core”) EPS came in at $0.40, seven cents higher versus Q2-2024.

The rise was driven in part by a sizeable contribution from Ellington’s proprietary reverse mortgage strategy, offset by a higher share count. Ellington’s book value per share fell from $13.92 to $13.66 during the last three months.

Click here to download our most recent Sure Analysis report on Ellington Financial (EFC) (preview of page 1 of 3 shown below):

High-Yield Monthly Dividend Stock #9: PennantPark Floating Rate Capital (PFLT)

PennantPark Floating Rate Capital Ltd. is a business development company that seeks to make secondary direct, debt, equity, and loan investments.

The fund also aims to invest through floating rate loans in private or thinly traded or small market-cap, public middle market companies, equity securities, preferred stock, common stock, warrants or options received in connection with debt investments or through direct investments.

On November 26, 2024, PennantPark Floating Rate Capital reported strong results for the fourth fiscal quarter of 2024, with core net investment income of $0.32 per share. The portfolio grew 20% quarter-over-quarter, reaching $2 billion as the firm deployed $446 million across 10 new and 50 existing companies.

Investments carried an average yield of 11%, reflecting the continued strength of the middle market lending environment. After the quarter, PFLT remained active, investing an additional $330 million at a yield of 10.2%.

Click here to download our most recent Sure Analysis report on PFLT (preview of page 1 of 3 shown below):

High-Yield Monthly Dividend Stock #8: Prospect Capital (PSEC)

Prospect Capital Corporation is a Business Development Company, or BDC, that provides private debt and private equity to middlemarket companies in the U.S.

The company focuses on direct lending to owneroperated companies, as well as sponsorbacked transactions. Prospect invests primarily in first and second lien senior loans and mezzanine debt, with occasional equity investments. 

Source: Investor Presentation

Prospect posted first quarter earnings on November 8th, 2024, and results were weak. However, the big news was a 25% dividend cut. Prospect reduced its payout to 54 cents per share annually, sending the stock reeling.

Net investment income was 21 cents per share in Q1, and revenue was $196 million. That was down 17% year-over-year.

The company is in the midst of rotating its strategy to emphasize first lien senior secured lending instead of real estate investments and collateralized loan obligations, or CLOs.

Click here to download our most recent Sure Analysis report on PSEC (preview of page 1 of 3 shown below):

High-Yield Monthly Dividend Stock #7: Horizon Technology (HRZN)

Horizon Technology Finance Corp. is a BDC that provides venture capital to small and mediumsized companies in the technology, life sciences, and healthcareIT sectors.

The company has generated attractive riskadjusted returns through directly originated senior secured loans and additional capital appreciation through warrants.

Source: Investor Presentation

On October 29th, 2024, Horizon released its Q3 results for the period ending September 30th, 2024. For the quarter, total investment income fell 15.5% year-over-year to $24.6.7 million, primarily due to lower interest income on investments from the debt investment portfolio.

More specifically, the company’s dollar-weighted annualized yield on average debt investments in Q3 of 2024 and Q3 of 2023 was 15.9% and 17.1%, respectively.

Net investment income per share (IIS) fell to $0.32, down from $0.53 compared to Q3-2023. Net asset value (NAV) per share landed at $9.06, down from $9.12 sequentially.

After paying its monthly distributions, Horizon’s undistributed spillover income as of June 30th, 2024 was $1.27 per share, indicating a considerable cash cushion.

Click here to download our most recent Sure Analysis report on HRZN (preview of page 1 of 3 shown below):

High-Yield Monthly Dividend Stock #6: AGNC Investment Corporation (AGNC)

American Capital Agency Corp is a mortgage real estate investment trust that invests primarily in agency mortgagebacked securities (or MBS) on a leveraged basis.

The firm’s asset portfolio is comprised of residential mortgage passthrough securities, collateralized mortgage obligations (or CMO), and nonagency MBS. Many of these are guaranteed by governmentsponsored enterprises.

Source: Investor Presentation

AGNC Investment Corp. reported strong financial results for the third quarter ended September 30, 2024. The company achieved a comprehensive income of $0.63 per common share, driven by a net income of $0.39 and other comprehensive income of $0.24 from marked-to-market investments.

Net spread and dollar roll income contributed $0.43 per share. The tangible net book value increased by $0.42 per share to $8.82, reflecting a 5.0% growth from the previous quarter.

AGNC declared dividends of $0.36 per share, resulting in a 9.3% economic return on tangible common equity, which includes both dividends and the increase in net book value.

Click here to download our most recent Sure Analysis report on AGNC Investment Corp (AGNC) (preview of page 1 of 3 shown below):

High-Yield Monthly Dividend Stock #5: Dynex Capital (DX)

Dynex Capital invests in mortgagebacked securities (MBS) on a leveraged basis in the United States. It invests in agency and nonagency MBS consisting of residential MBS, commercial MBS (CMBS), and CMBS interestonly securities.

Source: Investor Presentation

Dynex Capital released its fourth-quarter 2024 financial results, with book value ending the quarter at $12.70 per share and an economic return of 7.4% for the year.

Leverage increased slightly to 7.9x as the company deployed capital into higher-yielding agency RMBS, particularly 30-year 4.5%, 5%, and 5.5% coupons.

The shift from treasury futures to interest rate swaps was a key strategy, enhancing portfolio returns by 200 to 300 basis points and improving net interest spread.

Click here to download our most recent Sure Analysis report on DX (preview of page 1 of 3 shown below):

High-Yield Monthly Dividend Stock #4: Oxford Square Capital (OXSQ)

Oxford Square Capital Corp. is a BDC specializing in financing early and middlestage businesses through loans and CLOs.

The company holds an equally split portfolio of FirstLien, SecondLien, and CLO equity assets spread across multiple industries, with the highest exposure in software and business services.

Source: Investor Presentation

On November 5th, 2024, Oxford Square reported its Q3 results for the period ending September 30th, 2024. For the quarter, the company generated about $10.3 million of total investment income, down from $11.4 million in the previous quarter.

This was due to lower interest income from its debt investments and lower income from its securitization vehicles.

Further, the weighted average yield of the company’s debt investments was 13.7% at current cost, down from 13.9% in the previous quarter.

Still, the weighted average cash distribution yield of the company’s cash income producing CLO equity investments at current rose notably from 13.7% to 14.5%.

Click here to download our most recent Sure Analysis report on OXSQ (preview of page 1 of 3 shown below):

High-Yield Monthly Dividend Stock #3: Ellington Credit Co. (EARN)

Ellington Credit Co. acquires, invests in, and manages residential mortgage and real estate related assets. Ellington focuses primarily on residential mortgage-backed securities, specifically those backed by a U.S. Government agency or U.S. governmentsponsored enterprise.

Agency MBS are created and backed by government agencies or enterprises, while non-agency MBS are not guaranteed by the government.

Source: Investor Presentation

On November 12th, 2024, Ellington Residential reported its third quarter results for the period ending September 30th, 2024. The company generated net income of $5.4 million, or $0.21 per share.

Ellington achieved adjusted distributable earnings of $7.2 million in the quarter, leading to adjusted earnings of $0.28 per share, which covered the dividend paid in the period.

Net interest margin was 5.22% overall. At quarter end, Ellington had $25.7 million of cash and cash equivalents, and $96 million of other unencumbered assets.

Click here to download our most recent Sure Analysis report on EARN (preview of page 1 of 3 shown below):

High-Yield Monthly Dividend Stock #2: ARMOUR Residential REIT (ARR)

ARMOUR Residential invests in residential mortgage-backed securities that include U.S. Government-sponsored entities (GSE) such as Fannie Mae and Freddie Mac.

It also includes Ginnie Mae, the Government National Mortgage Administration’s issued or guaranteed securities backed by fixed-rate, hybrid adjustable-rate, and adjustable-rate home loans.

Unsecured notes and bonds issued by the GSE and the US Treasury, money market instruments, and non-GSE or government agency-backed securities are examples of other types of investments.

Source: Investor presentation

On October 23, 2024, ARMOUR Residential REIT announced its unaudited third-quarter 2024 financial results, reporting a GAAP net income available to common stockholders of $62.9 million, or $1.21 per common share. The company generated a net interest income of $1.8 million and distributable earnings of $52.0 million, equivalent to $1.00 per common share.

ARMOUR achieved an average interest income of 4.89% on interest-earning assets and an interest cost of 5.51% on average interest-bearing liabilities. The economic net interest spread stood at 2.00%, calculated from an economic interest income of 4.44% minus an economic interest expense of 2.44%.

During the quarter, ARMOUR raised $129.4 million by issuing 6,413,735 shares of common stock through an at-the-market offering program and paid common stock dividends of $0.72 per share for Q3.

Click here to download our most recent Sure Analysis report on ARMOUR Residential REIT Inc (ARR) (preview of page 1 of 3 shown below):


High-Yield Monthly Dividend Stock #1: Orchid Island Capital (ORC)

Orchid Island Capital is a mortgage REIT that is externally managed by Bimini Advisors LLC and focuses on investing in residential mortgage-backed securities (RMBS), including pass-through and structured agency RMBSs.

These financial instruments generate cash flow based on residential loans such as mortgages, subprime, and home-equity loans.

Source: Investor Presentation

The company reported a net income of $17.3 million, or $0.24 per common share, significantly improving from a net loss of $80.1 million in the same quarter last year. This net income comprised $0.3 million in net interest income and $4.3 million in total expenses.

Additionally, Orchid recorded net realized and unrealized gains of $21.2 million, or $0.29 per common share, from Residential Mortgage-Backed Securities (RMBS) and derivative instruments, including interest rate swaps.

Click here to download our most recent Sure Analysis report on Orchid Island Capital, Inc. (ORC) (preview of page 1 of 3 shown below):

Final Thoughts

Monthly dividend stocks could be more appealing to income investors than quarterly or semi-annual dividend stocks. This is because monthly dividend stocks make 12 dividend payments per year, instead of the usual 4 or 2.

Furthermore, monthly dividend stocks with high yields above 5% are even more attractive for income investors.

The 20 stocks on this list have not been vetted for dividend safety, meaning each investor should understand the unique risk factors of each company.

That said, these 20 dividend stocks make monthly payments to shareholders, and all have high dividend yields.

Further Reading

If you are interested in finding high-quality dividend growth stocks and/or other high-yield securities and income securities, the following Sure Dividend resources will be useful:

Monthly Dividend Stock Individual Security Research

Other Sure Dividend Resources

Thanks for reading this article. Please send any feedback, corrections, or questions to [email protected].


Source link

Copyright © 2023 | Powered by WordPress | Coin Market Theme by A WP Life