Uncertainty as the new normal – United States


Written by the Market Insights Team

A rolling one-month threat

Kevin Ford –FX & Macro Strategist

The blueprint of a threat, followed by a deadline extension, was on display yesterday, as the presumed March 4th deadline for Canada and Mexico might now be pushed back to early April. The Eurozone also faced a new round of tariff threats from President Trump, capping the EUR/USD at 1.05. As highlighted in previous Daily Market Updates (DMU), speculation is rife about another push towards April 2nd, aligning with the deadline President Trump set for his cabinet to assess reciprocal tariffs and global trade relations.

Since inauguration day, trade policy has been a rollercoaster of uncertainty. It’s now unclear whether the steel and aluminum tariffs, initially set to begin on March 12th, will also be postponed to April 2nd. For now, the FX markets will believe in tariffs only when they see them.

The Loonie has encountered resistance at the 1.435 level, as flight-to-quality persists in the US markets amid widespread uncertainty. From macroeconomic data to fiscal spending cuts, debt ceiling negotiations, US-Russia relations, and the burgeoning relationship between the Chinese government and the mega tech industry, investors face a myriad of questions with no clear playbook for navigating these uncertain times.

As a result, the fear index, or the VIX, has been up and down between the alarming 20 levels and 17. Nvidia’s strong quarterly earnings have provided a measure of relief to the markets, amid the prevailing uncertainty and doubts about the sustainability of AI momentum in corporate America.

The uncertainty has particularly impacted the crypto market, causing a sell-off that has wiped out around $400 billion in market capitalization over the last few days. BTC/USD is now trading at 86,000, significantly below its all-time high of 106,146.

Chart: Higher volatility dominates the story of 2025 so far.

Equities rattled, currencies calm

George Vessey – Lead FX & Macro Strategist

There’s growing confusion around the timing and scale of tariffs to be implemented by the US administration following US President Donald Trump’s cabinet meeting on Wednesday. Trump said that the 25% tariffs on Mexico and Canada would be implemented on April 2, rather than the looming March 4 date. It wasn’t clear if the president meant that he was giving the countries additional time, or got confused with a separate program. Either way, the slew of contradictions has stoked investor skepticism over Trump’s policy agenda.

Equity markets have been rattled in the wake of the ongoing twists and turns in the tariff narrative, with US equities having now wiped out the initial post-election burst. But currencies appear to be taking it in their stride a little more, with realised volatility in G10 FX shrinking of late. Aside from tariff uncertainty, the growth-scare narrative in the US has worsened, which has led to risk-off market conditions . A combination of weaker growth and disinflationary forces will encourage further interest rate cuts at the Federal Reserve (Fed), with markets now pricing two 25 basis point cuts for the year, whereas the expectation was for just one cut two weeks ago.

Meanwhile, in the commodities space, oil prices are trading a multi-month lows having lost around 4% this month as Trump’s aggressive moves on trade triggered anxiety at a time when oil traders were already concerned about lackluster consumption in China. Moreover, hopes for a potential Russia-Ukraine peace deal weighed on the market, as lifting Russian sanctions could increase global oil supply. Commodity FX thus remains under pressure with the Aussie and Canadian dollars trading softer.

Chart: Higher policy uncertainty across the board.

Tariff threats losing sting on euro

George Vessey – Lead FX & Macro Strategist

The euro retreated from a one-month high of $1.0528, whilst Germany’s 10-year bond yield fell to 2.44%, near a one-week low, as doubts emerged over a swift increase in European defense spending and its funding through bond issuance. Meanwhile, economic data showed German consumer sentiment unexpectedly weakened heading into March. Plus, US President Trump fired another round of tariff threats overnight, but it hasn’t rattled the euro like one might have expected.

EUR/USD continues to knock on the door of $1.05 but the 100-day moving average located just above this level remains a strong barrier to the upside. Nevertheless the euro appears relatively calm after the latest bout of tariff threats, falling only 50 pips on the news. Trump stated he intends to impose duties of 25% on the European Union without giving any further details on whether those would affect all exports from the bloc or only certain products or sectors. Meanwhile, Germany’s incoming chancellor, Friedrich Merz, ruled out a swift reform of the country’s borrowing limits and said it was too early to determine whether the outgoing parliament could approve a major military spending increase.

Investors will be monitoring the trade and fiscal policy developments closely, but on the macro front today, Spanish inflation data could prove important for clues on where the Eurozone figure will land next week ahead of the European Central Bank (ECB) meeting. Markets expect another 25 basis point rate cut and about 82 bps of ECB easing in total this year. The spread between US and German 10-year yields closed at 181 basis points on Wednesday, near the narrowest since October. It’s set for the biggest monthly decline since May, which has helped support the euro’s modest rebound over the past month.

Chart: $1.05 proving to be a tough hurdle to overcome.

Sterling’s double edged sword

George Vessey – Lead FX & Macro Strategist

Due to higher interest rates in the UK relative to other G10 peers, the pound’s elevated carry status increases its exposure to equity market fluctuations. The modest uplift in equity markets helped the pound inch higher versus the euro and US dollar on Wednesday, with the former trading just shy of the €1.20 handle. GBP/EUR is up over 1% month-to-date, but is flat on the year, whilst GBP/USD is up over 2% month-to-date and near its highest in two months.

The pound’s yield advantage can be a blessing and a curse though. When markets are in risk-on mode – investors happy to take on more risk for more reward – sterling tends to appreciate, but in deteriorating global risk conditions, the pound becomes more vulnerable. This is amplified by the UK’s worsening net international investment position and persistent current account deficit, which leaves GBP reliant on foreign capital inflows. With this in mind, if we see a bigger drawdown in equity markets, expect the pound to tumble too. Several warning signals are rearing their ugly heads on this front, including bearish investor sentiment surveys and a surge in demand for protection against a stock-market correction.

We can also look at 1-month implied-realized volatility spreads in the FX space to gauge whether the market expects future volatility to be greater than what has been observed historically. From this, we can see traders are paying up for protection in safe havens like the Japanese yen and Swiss franc as they look to hedge against potential shocks from trade policy, geopolitics and political uncertainty.

Chart: Back to havens as uncertainty prevails.

Dollar index holds in top 5% of 7-day range

Table: 7-day currency trends and trading ranges

Table: 7-day currency trends and trading ranges.

Key global risk events

Calendar: February 24-28

Table: Key global risk events calendar.

All times are in ET

Have a question? [email protected]

*The FX rates published are provided by Convera’s Market Insights team for research purposes only. The rates have a unique source and may not align to any live exchange rates quoted on other sites. They are not an indication of actual buy/sell rates, or a financial offer.


Source link

Credit By Another Name | Global Finance Magazine


Buy-now-pay-later offers SMEs an alternate credit source.

Although generally available in the consumer market for about a decade, the electronic payment model of buy-now-pay-later (BNPL) is finally bearing fruit for micro, small and midsize enterprises (MSMEs) by avoiding interest payments on corporate credit cards, reducing paperwork, facilitating quicker transactions, and improving liquidity management.

The business-to-business (B2B) BNPL transaction works similarly to the business-to-consumer (B2C) BNPL transaction. After a third party runs a credit check and assumes the credit risk of non-payment, a purchaser can delay payment for a fixed period or pay in whole or installments.

Using B2B BNPL, MSMEs avoid tapping their credit lines to pay invoices and avoid trade credit negotiations. For suppliers, it works like reverse factoring, where the buyer uses a third party to pay the invoice immediately and reimburses the financing third party later.

Many MSMEs in sectors like retail, manufacturing and technology have become early adopters of B2B BNPL, according to Arjun Singh, partner and global head of fintech, financial services practice at Arthur D. Little (ADL). “Additionally, marketplaces are increasingly incorporating B2B BNPL as part of their embedded finance and financial innovation strategies, helping businesses address liquidity challenges and streamline payment processes.”

Arjun Singh, Arthur D. Little: B2B BNPL has become a must-have not only in retail but across various sectors.

The travel and hospitality industry also has dipped its toe into the new payment model driven by their short-term and seasonal needs, adds Nilesh Vaidya, global head of market development for financial services at Capgemini. “Restaurants have had a challenging run in the last couple of years, and they’re looking for that credit. So they are into that. They want to get that kind of loan quicker, and it is an interesting business for the banks.”

The areas where B2C and B2B BNPL diverge are maturity, market size, and client base. The B2B BNPL sector is in its infancy compared to the B2C BNPL sector, which has benefited from e-commerce’s hyper-growth and a growing base of young users with little or no credit history.

“It has become a must-have not only in retail but across various sectors,” says Singh. “According to some estimates, B2C BNPL accounts for approximately 5% of global e-commerce spending.”

On the other hand, B2B BNPL is a sleeping giant that is ready to awaken. It is driven by larger and often more complex transactions. The authors of a viewpoint published by ADL estimated that B2B BNPL would capture 15% to 20% of all B2B payments by the decade’s end.

“This would equal approximately $25-$30 trillion BNPL volume and, assuming average BNPL fees of 3%-4% per transaction, a total addressable market between $700 billion and $1.3 trillion,” they wrote.

Geographically, BNPL is a global phenomenon available in approximately 80 markets, with the Asia-Pacific markets leading adoption in China and South Asia, such as Malaysia, Indonesia and Singapore, according to Vaidya. “After that, we have seen a lot more applicability in Europe because the immediate payment access is better. In the US, there have been many new BNPL providers.”

Where Credit Is Due

The BNPL model would not function without third parties taking on the non-payment credit risk. Fintechs—such as Sweden’s Klarna, Australia’s Afterpay, and America’s Affirm—blazed a path for the B2C BNPL space, capturing considerable market share while expanding their offerings.

Nonetheless, Capgemini’s Vaidya notes that banks will likely dominate the B2B BNPL market.

“Klarna and Afterpay have a lot of retail customers, individuals who are buying in malls and big box retailers or on an e-commerce online shop,” he says. “Banks are doing better in the small and midsize enterprise segment.”

While fintechs continue to crack into the B2B market, banks already have existing financial relationships with MSMEs and their suppliers and offer them another way to provide credit to their commercial customers. This is especially true for businesses with revenues in the $20-$50 million range and had difficulty obtaining small-ticket loans historically.

However, financial institutions’ results are not all rosy. The B2B BNPL business comes at the cost of commercial credit card fees and those generated by a bank’s factoring and reverse factoring business lines.

“In the past, a business would go and buy something on its commercial credit card, and a bank would generate a fee on the transaction,” explains Vaidya. “When an immediate account-to-account payment option is possible, they can pay their suppliers directly where they didn’t need credit. So the banks need to do something.”

The banks have gone big with their B2B BNPL offerings. Global banking giants Banco Santander and BNP Paribas began offering their respective BNPL services to their large multinational clients in 2023 via partnerships with payment platforms and trade insurance providers. Banco Santander Corporate Investment Bank launched its turnkey service, which incorporates the payment platform from net-terms infrastructure provider Two and the services of insurance broker Marsh Spain and credit-insurance provider Allianz Trade.

“The fact that buyers have to use personal or corporate credit cards is still hindering B2B transactions. Enabling businesses to maintain their payment habits within 30 or 60 days of their invoices in an e-commerce environment will be a big differentiator for sellers while adding a major game changer: all concerns about non-payment risk are now removed, and their cash flow is preserved at all times,” said Ignacio Frutos Lopez, global head receivables at Banco Santander CIB at the time of the launch.

Three months later, BNP Paribas launched its service in partnership with Hokodo, a B2B payment platform provider that can integrate with existing checkout platforms via an API. The service provides real-time credit decisions, transaction financing, credit and fraud insurance, and collection capabilities.

Moving Forward

Despite its potential remarkable growth, B2B BNPL still has a few hurdles to overcome. According to the authors of the ADL viewpoint, customer awareness and regulation are the leading concerns, followed by risk assessment, product structures, cross-border trade issues, technology integration, costs and competition.

“A significant portion of the target market needs to be educated about the benefits and risks of the proposition,” says ADL’s Singh.

According to research by Capgemini, BNPL’s expected adoption rate will remain flat for the next couple of years. In a study of e-commerce shares by checkout method, BNPL garnered a 5% share in 2023 and is forecasted to have a 5% share in 2027. Meanwhile, credit cards, which had a 22% share in 2023, are predicted to shrink to a 15% share over the same period.

As the size of the entire BNPL market increases, regulators are investing more effort in addressing BNPL offerings as separate from typical longer-term interest-bearing loans. However, according to Eric Mitzenmacher, a partner at the law firm Mayer Brown, BNPL-specific regulation remains nascent in many jurisdictions.

“The US—despite being a fertile market for BNPL offerings due to the size of its economy and certain helpful regulatory factors—has one of the more complex and rapidly evolving regulatory environments for BNPLs,” he says. “Many other jurisdictions currently have more permissive environments for BNPL, particularly for BNPLs offered to SMEs versus consumers, with the potential exception of BNPLs offered by banks and similarly regulated financial institutions.”

Singh agrees, saying, “Unlike consumer credit, which has a relatively uniform regulation across jurisdictions, business lending and credit regulations are diverse and fragmented, lacking the same clarity—especially in cross-border scenarios.”

Even with these hurdles, Singh expects B2B BNPL to have a similar adoption curve as its consumer counterpart and gain traction across multiple sectors and transaction types. “As commerce continues to unify across channels and customers demand greater personalization, the reach and impact of B2B BNPL will expand significantly, offering businesses increased flexibility and financial options.”


Source link

2025 Dogs Of The Dow List | Top 10 Highest Yielding Dow 30 Stocks Now


Updated on February 25th, 2025 by Bob Ciura

The “Dogs of the Dow” investing strategy is a very simple way for investors to achieve diversification and income in their portfolios while remaining in the sphere of more conservative blue chip stocks.

The strategy consists of investing in the 10 highest-yielding stocks in the Dow Jones Industrial Average, an index of 30 U.S. stocks.

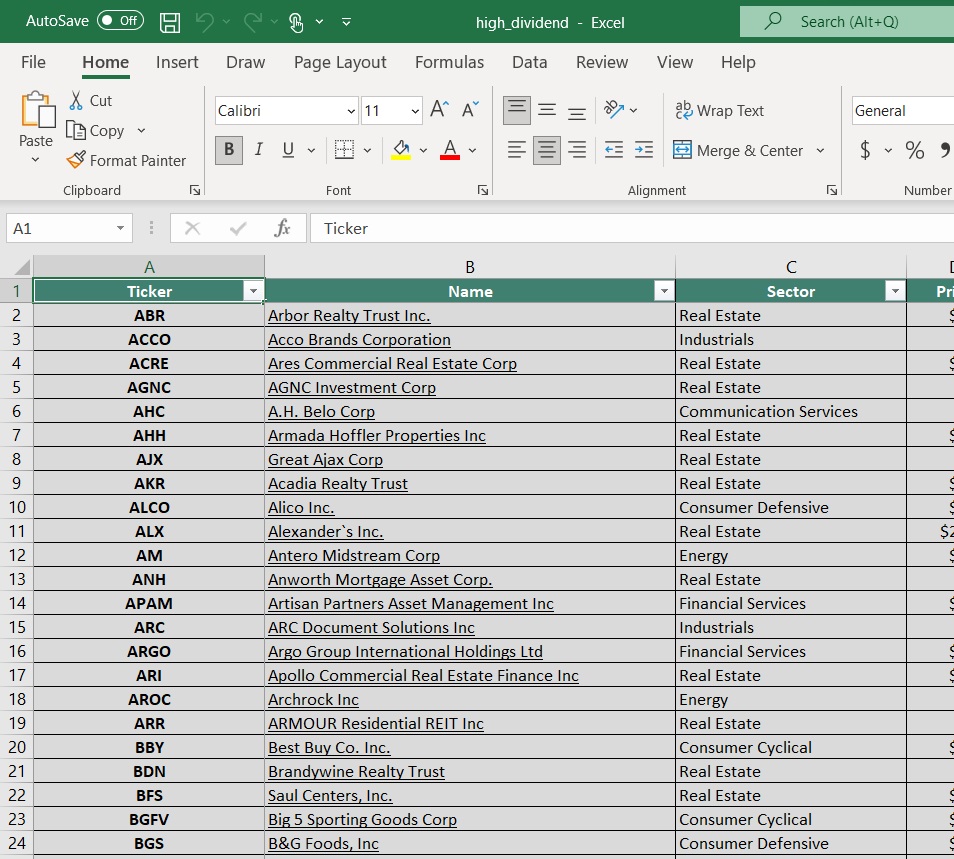
High dividend stocks are stocks with a dividend yield well in excess of the market average dividend yield of ~1.3%. With that in mind, we have created a free list of over 200 high dividend stocks with dividend yields above 5%.

You can download your copy of the high dividend stocks list below:


The “Dogs of the Dow” strategy produces above-average income and concentrates on stocks that typically trade at lower valuations relative to the rest of the DJIA.

Given that the DJIA represents some of the largest companies in the world, its “dogs” are typically companies with strong track records that have hit temporary problems.

This is a great and simple strategy for value investors looking to purchase good businesses that are currently out of favor.

To implement this strategy, take the amount of money you have to invest and then divide it equally among the 10 highest-yielding stocks in the DJIA.

Hold these stocks for a whole year and then at the end of 12 months, look at the 30 Dow stocks again and resort them by dividend yield from highest to lowest.

Rebalance and reallocate your capital accordingly and repeat the process. In addition to the simplicity and focus on quality, value, and income that this strategy generates, it also improves discipline by preventing excessive emotion-driven trading.

It also encourages investors to reap the tax benefits from holding positions for at least one year before selling, thereby being taxed at the long-term capital gains tax rate instead of the short-term rate.

The 2025 Dogs of the Dow

The list of the 2024 Dogs of the Dow is below, along with the current dividend yield of the top-ten yielding DJIA stocks. Click on a company’s name to jump directly to analysis on that company.

Dog of the Dow #10: Procter & Gamble (PG)

Procter & Gamble is a consumer products giant that sells its products in over 180 countries. Notable brands include Pampers, Luvs, Tide, Gain, Bounty, Charmin, Puffs, Gillette, Head & Shoulders, Old Spice, Dawn, Febreze, Swiffer, Crest, Oral-B, Scope, Olay and many more.

Procter & Gamble has paid a dividend for 134 years and has grown its dividend for 68 consecutive years – one of the longest active streaks of any company.

In late January, Procter & Gamble reported (1/22/25) financial results for the second quarter of fiscal 2025 (its fiscal year ends June 30th).

Source: Investor Presentation

Sales and its organic sales grew 2% and 3%, respectively, over last year’s second quarter, primarily thanks to 2% volume growth. Core earnings-per-share grew 2%, from $1.84 to $1.88, beating the analysts’ consensus by $0.02.

Procter & Gamble reaffirmed its guidance for 3%-5% growth of organic sales and 5%-7% growth of earnings-per-share in fiscal 2025.

Click here to download our most recent Sure Analysis report on PG (preview of page 1 of 3 shown below):


Dog of the Dow #9: Home Depot (HD)

Home Depot was founded in 1978 and since that time has grown into a juggernaut home improvement retailer with over 2,300 stores in the US, Canada and Mexico that generate around $153 billion in annual revenue.

Home Depot reported third quarter 2024 results on November 12th, 2024. The company reported sales of $40.2 billion, up 6.6% year-over-year.

However, comparable sales in the quarter decreased 1.3%. Net earnings equaled $3.6 billion, or $3.67 per share, compared to $3.8 billion, or $3.81 per share in Q3 2023. Adjusted EPS was $3.78.

The company spent $649 million on common stock repurchases year-to-date, compared to $6.5 billion in the prior year. Average ticket declined 0.8% compared to last year, from $89.36 to $88.65.

Additionally, sales per retail square foot decreased 2.1% from $595.71 to $582.97.

Click here to download our most recent Sure Analysis report on HD (preview of page 1 of 3 shown below):

Dog of the Dow #8: International Business Machines (IBM)

IBM is a global information technology company that provides integrated enterprise solutions for software, hardware, and services.

Its focus is running mission-critical systems for large, multi-national customers and governments. IBM typically provides end-to-end solutions.

The company now has four business segments: Software, Consulting, Infrastructure, and Financing.

IBM reported results for Q4 2024 on January 29th, 2025. Company-wide revenue rose 2% in constant currency while diluted adjusted earnings per share climbed 1% year-over-year.

Software revenue increased 11% year-over-year due to 12% growth in Hybrid Platform & Solutions and an 11% increase in Transaction Processing. Revenue was up 17% for RedHat, 16% for Automation, 5% for Data & AI, and 5% for Security.

Click here to download our most recent Sure Analysis report on International Business Machines (IBM) (preview of page 1 of 3 shown below):


Dog of the Dow #7: Cisco Systems (CSCO)

Cisco Systems is the global leader in high performance computer networking systems. The company’s routers and switches allow networks around the world to connect to each other through the internet. Cisco also offers data center, cloud, and security products.

On February 12th, 2025, Cisco announced a 2.5% dividend increase in the quarterly payment to $0.41. That same day, Cisco announced results for the second quarter of fiscal year 2025 for the period ending January 25th, 2025.

For the quarter, revenue grew 9.4% to $13.99 billion, which beat estimates by $120 million. Adjusted earnings-per-share of $0.94 compared favorably to adjusted earnings-per-share of $0.87 in the prior year and was $0.03 ahead of expectations.

Excluding the company’s recent acquisition of Splunk, total revenue grew 11% for the quarter. Networking fell 3% while Security grew 117%, Observability was up 47%, and Collaboration improved 1%. By region, the Americas increased 9%, Europe/Middle East/Africa was higher by 11%, and Asia-Pacific/Japan/China was up 8%.

Click here to download our most recent Sure Analysis report on Cisco Systems (CSCO) (preview of page 1 of 3 shown below):

Dog of the Dow #6: Coca-Cola (KO)

Coca-Cola is the world’s largest beverage company, as it owns or licenses more than 500 unique nonalcoholic brands. Since the company’s founding in 1886, it has spread to more than 200 countries worldwide.

Coca-Cola now has 30 billion-dollar brands in its portfolio, which each generate at least $1 billion in annual sales.

Source: Investor Presentation

Coca-Cola posted fourth quarter and full-year earnings on February 11th, 2025, and results were much better than expected on both the top and bottom lines. Adjusted earnings-per-share came to 55 cents, which was three cents ahead of estimates.

Revenue was up 6.5% year-over-year to $11.5 billion, which was a staggering $800 million ahead of estimates. Organic revenue soared 14% year-over-year for the fourth quarter. Currency-neutral operating income was up 22% year-over-year.

For the year, global unit case volume was up 1%, and was up 2% for the quarter. Excluding IRS tax litigation, free cash flow for the year would have been $10.8 billion, up 1% from 2023.

Click here to download our most recent Sure Analysis report on KO (preview of page 1 of 3 shown below):

Dog of the Dow #5: Johnson & Johnson (JNJ)

Johnson & Johnson is a diversified health care company and a leader in the area of innovative medicines and medical devices Johnson & Johnson was founded in 1886 and employs nearly 132,000 people around the world.

On January 22nd, 2025, Johnson & Johnson announced fourth quarter and full year results for the period ending December 31st, 2024.

Source: Investor Presentation

For the quarter, revenue grew 5.1% to $22.5 billion, which beat estimates by $50 million. Adjusted earnings-per-share of $2.04 compared to $2.29 in the prior year, but this was $0.02 above expectations.

For the year, revenue grew 4.3% to $88.8 billion while adjusted earnings-per-share of $9.98 was up slightly from the prior year. Results included adjustments related to the costs of acquisitions.

Click here to download our most recent Sure Analysis report on JNJ (preview of page 1 of 3 shown below):

Dog of the Dow #4: Amgen Inc. (AMGN)

Amgen is the largest independent biotech company in the world. Amgen discovers, develops, manufactures, and sells medicines that treat serious illnesses.

The company focuses on six therapeutic areas: cardiovascular disease, oncology, bone health, neuroscience, nephrology, and inflammation.

Source: Investor Presentation

On February 4th, 2025, Amgen announced fourth quarter and full year earnings results. Revenue grew 11% to $9.1 billion, which was $230 million more than expected. Adjusted earnings-per-share of $5.31 compared favorably to $4.71 in the prior year and was $0.23 ahead of estimates.

For the year, revenue grew 19% to $33.4 billion while adjusted earnings-per-share of $19.84 compared to $18.65 in 2023.

Amgen had a successful 2024 as 21 products achieved record sales. For the quarter, growth was primarily due to a 14% increase in volumes. Excluding the addition of Horizon Therapeutics, product sales improved 10% and volume was up 15%.

Click here to download our most recent Sure Analysis report on Amgen Inc. (AMGN) (preview of page 1 of 3 shown below):


Dog of the Dow #3: Merck & Company (MRK)

Merck & Company is one of the largest healthcare companies in the world. Merck manufactures prescription medicines, vaccines, biologic therapies, and animal health products.

Merck employs 68,000 people around the world and generates annual revenues of more than $63 billion.

Source: Investor Presentation

On February 4th, 2025, Merck announced fourth quarter and full year results for the period ending December 31st, 2024.

For the quarter, revenue improved 7% to $15.6 billion, which was $110 million above estimates. Adjusted earnings-per-share was $1.72 compared to $0.03 the prior year and $0.04 more than expected.

For the year, revenue increased 7% to $64.2 billion while adjusted earnings-per-share of $7.65.

Keytruda, which treats cancers such as melanoma that cannot be removed by surgery and non-small cell lung cancer, continues to be the key driver of growth for the company as sales for the drug were up 19% to $7.8 billion during the period.

Click here to download our most recent Sure Analysis report on MRK (preview of page 1 of 3 shown below):

Dog of the Dow #2: Chevron Corporation (CVX)

Chevron is one of the largest oil majors in the world. The company sees the bulk of its earnings from its upstream segment and has a higher crude oil and natural gas production ratio than most of its peers.

Chevron has increased its dividend for 38 consecutive years, placing it on the Dividend Aristocrats list.

In 2023, Chevron agreed to Acquire Hess (HES) for $53 billion in an all-stock deal. If the deal closes, Chevron will purchase the highly profitable Stabroek block in Guyana and Bakken assets and thus it will greatly enhance its output and free cash flow.

In late January, Chevron reported (1/31/25) results for the fourth quarter of 2024. Production dipped -1% over the prior year’s fourth quarter due to downtime in some fields, despite record Permian output after the acquisition of PDC Energy.

In addition, the price of oil decreased and refining margins plunged to normal levels after two years of blowout levels. As a result, earnings-per-share fell -40%, from $3.45 to $2.06, missing the analysts’ consensus by $0.05.

Click here to download our most recent Sure Analysis report on Chevron Corporation (CVX)  (preview of page 1 of 3 shown below):

Dog of the Dow #1: Verizon Communications (VZ)

Verizon Communications was created by a merger between Bell Atlantic Corp and GTE Corp in June 2000. Verizon is one of the largest wireless carriers in the country.

Wireless contributes three-quarters of all revenues, and broadband and cable services account for about a quarter of sales. The company’s network covers ~300 million people and 98% of the U.S.

On January 24th, 2025, Verizon announced fourth quarter and full year results. For the quarter, revenue grew 1.7% to $35.7 billion, which beat estimates by $360 million.

Source: Investor Presentation

Adjusted earnings-per-share of $1.10 compared favorably to $1.08 in the prior year and was in-line with expectations. For the year, grew 0.6% to $134.8 billion while adjusted earnings-per-share $4.59 compared to $4.71 in 2023.

For the quarter, Verizon had postpaid phone net additions of 568K, which was better than the 449K net additions the company had in the same period last year. Retail postpaid net additions totaled 426K.

Wireless retail postpaid phone churn rate remains low at 0.89%. Wireless revenue grew 3.1% to $20.0 billion while the Consumer segment increased 2.2% to $27.6 billion.

Click here to download our most recent Sure Analysis report on VZ (preview of page 1 of 3 shown below):

Final Thoughts

Given the descriptions above, the Dogs of the Dow are clearly a very diverse group of blue-chip stocks that each enjoy significant competitive advantages and lengthy histories of paying rising dividends.

As a result, this investing strategy is a great, low-risk way for unsophisticated investors to approach dividend growth investing.

While it may not outperform the broader market every year, it is virtually guaranteed to provide investors with a combination of attractive current yield with steadily rising income over time.

If you are interested in finding high-quality dividend growth stocks and/or other high-yield securities and income securities, the following Sure Dividend resources will be useful:

High-Yield Individual Security Research

Other Sure Dividend Resources

Thanks for reading this article. Please send any feedback, corrections, or questions to [email protected].


Source link

This Low-Risk Strategy Could Deliver Big Gains Now


A rare market signal is flashing—here’s how to profit from it quickly.

Editor’s Note: Geopolitical uncertainty, tariffs, mixed earnings results, and stalled-out price action has been throwing a wrench into the works this year.

But our partners at TradeSmith couldn’t be more certain about what’s coming.

And what’s coming is the continuation of an epic melt-up that officially began in April of last year… and will likely only accelerate over the next 12 months.

Today, TradeSmith CEO Keith Kaplan is joining us today to brief you on exactly how they reached that conclusion… and the strategy he uses to take advantage of stocks in sharp downtrends.

Take it away, Keith…

They say you should never try to catch a falling knife.

That’s certainly true… if you’re doing it without a plan.

But if you do it with the right stocks, buying into a downtrend and banking on a reversal can be quite lucrative.

A couple months back, we got the idea of designing a system that’s like catching a falling knife with Kevlar gloves on… where we minimize the risk and trade only the rarest setups with a strong track record of working.

We tested tons of different variables, and eventually we found one combination that produces a rare but quite reliable trading signal.

By targeting quality stocks in sudden, steep downtrends… You can bank on a quick reversion to the mean that sends the shares much higher from your entry.

Why talk about it now?

First off, it’s about to go live in TradeSmith Finance for Trade360Ideas by TradeSmith, and Platinum subscribers. We wanted folks to be ready to grab some serious gains, as TradeSmith is picking up an ultra-rare bullish signal in the markets right now that only comes around every few decades.

And that signal is really key to this whole strategy.

You see, our data shows that we’re in a rare kind of market that we previously only saw in 1996… and then 70 years earlier, in 1926.

If your market history is sharp, you know those were the early stages of massive investment manias that went far further and lasted much longer than anyone expected.

Both were powered by technological breakthroughs… financial institutions lowering the barrier for smaller investors to participate… and a consumer credit revolution that spurred the economy higher.

These are all things we’re seeing the beginnings of today. And what we’ve found is that these specific conditions signal the start of a “mega melt-up.”

In markets like this, stocks can post monumental gains, year after year.

For example, the S&P 500 rose more than 20% every single year from 1996 to 1999, until the bubble popped in September of 2000. The Nasdaq did even better, returning 42%, 20%, 83%, and 102% in that four-year period.

Individual stocks did even better, with companies like Microsoft (MSFT) returning more than 1,000%… Oracle (ORCL) returning more than 1,200%… and Amazon (AMZN) hitting a peak of 8,509% from ’97 to ’99.

But of course, every melt-up eventually turns into a meltdown.

That was true 100 years ago, as the Roaring  ‘20s gave way to the Great Depression.

And it was true 30 years ago, when the dot-com boom turned into a bubble and a bust.

But no matter if we’re in the boom, bubble, or bust phase of a melt-up, this strategy is perfectly suited to catching quick gains as stocks recover from quick sell-offs.

More on all this in a brand-new presentation later this week.

But today, let’s focus on the strategy…

How This New Strategy Delivers Rare, Powerful Gains

Setups from our new strategy don’t happen often, and they rarely happen in stocks with a low Volatility Quotient (VQ). For new readers, VQ is our measure of a stock’s individual volatility. The higher the score, the more volatile in the name – and vice versa.

That makes sense – high-quality stocks don’t tend to make big drops. The market rewards great businesses with higher share prices.

But every so often, a bad earnings report or a shock macro event can throw these stocks off their game. And that’s when we want to buy them.

We tested this new strategy on the S&P 500 going back 10 years.

Of the 339 cases we found – roughly a third of which were during the initial panic sell-off of March 2020 – just under 80% saw positive returns 21 trading days later. And the average return, counting wins and losses, was about 16%.

That’s a strong signal… with great returns for such a short period. It makes for a great swing-trading strategy.

Now, I can’t tell you the exact parameters of the newest version of this strategy. If I did that, anyone could go and set it up and trade it for themselves… which wouldn’t be right to our subscribers.

But I can show you a couple examples… like this one.

In our backtest of this strategy, we spotted a trade on Humana (HUM) during the pandemic crash.

The Snapback signal triggered on HUM at $206.99 on March 23, 2020. Buying it then and holding for the next 21 trading days probably sounded like a horrible idea at the time.

But you would’ve walked away with a 71.6% return as the stock recovered to $355.18:

This was the pandemic, though. A lot of stocks pulled moves like this.

Let’s look at a more isolated incident involving insurance company Globe Life (GL) from last year.

GL was the target of a short report that accused insurance fraud. The stock dropped more than 50% in a single session, and that was enough to trigger the Snapback signal on April 15 at a price of $55.52.

Twenty-one trading days later, the stock recovered to $88.10. returning 58.7%, as you see in the chart below:

Then there’s one of the cleanest examples I’ve found – a case from 2022, in Caesars Entertainment (CZR).

The signal triggered at $32.36 on Sept. 30… and would’ve led to a 35.5% gain if you’d sold it 21 trading days later (on Oct. 31) for $43.73:

These are some of the best performers the system found over the last 10 years.

To be clear, there were losers, too. But in our study, only one-fifth of the signals lost money.

So, I’m guessing you want to try it out?

Good news: There’s a live signal right now.

A Tradable Signal on FMC

Check out this chart of chemical manufacturer FMC Corp. (FMC):

On Feb. 11, this strategy flashed a new trade on FMC.

The rules are, the system were to have bought on Feb. 11 and held through March 13 (21 trading days). We’re a bit late to this trade, but it is currently the most recent signal in our system.

Luckily, the price hasn’t moved much. But it has trended a bit higher.

You could buy FMC on Monday and look to sell it as it reaches the average gain the system achieved in our backtest – about 16%. Even now, that’d be a very respectable return for the remaining 12 trading days.

Now, it’s important to understand that FMC is currently in the Red Zone, meaning it would not (yet) be a candidate for a long-term buy and hold.

But we’re talking about something different here. We’re talking about trading FMC for a short time as it recovers from its beaten-down price, only 21 trading days.

We’ll be rolling this strategy out to our Trade360, Ideas by TradeSmith, and TradeSmith Platinum subscribers very soon. When we integrate it into TradeSmith, they’ll be able to see new entry signals on this strategy and follow along if they wish. We’re finally in another “Roaring ‘20s” for the stock market, and I expect there to be tons of really exciting opportunities as long as this melt-up persists.

Ahead of that launch, I’ll be holding a free demo where I’ll show how to find 10 “melt-up stocks” for the historic market conditions TradeSmith is picking up now. Click here to save your seat for my Last Melt-Up event on Thursday, Feb. 27, at 8 p.m. Eastern.

All the best,

Keith Kaplan

CEO, TradeSmith

Frequently Asked Questions (FAQs)

1. What is this low-risk, high-reward strategy?

It’s a system that identifies high-quality stocks in steep downtrends with a history of quick rebounds.

2. How reliable is this trading approach?

Backtests show nearly 80% of trades were profitable, with an average return of 16% in 21 days.

3. Why is this market signal significant now?

It has only appeared twice in the last century—both times preceding historic market booms.

4. What stocks have worked with this strategy before?

Humana (HUM), Globe Life (GL), and Caesars Entertainment (CZR) all delivered strong returns.

5. How can I access real-time signals for this strategy?

TradeSmith will soon integrate it for subscribers, providing live trade opportunities.


Source link

Tariff tangle: uncertainty clouds US trade policy – United States


Written by the Market Insights Team

Equity markets are stumbling and demand for safe haven currencies is on the rise as investors navigate the shocks from trade policy, geopolitics and political uncertainty. The euro has pulled back from 1-month highs against the US dollar, though remains 1% up year-to-date, whilst the pound is up 2% versus the dollar this month and inching closer to the €1.21 level against the euro – which has been a key resistance mark for the past eight years.

Equities rattled, currencies calm

George Vessey – Lead FX & Macro Strategist

There’s growing confusion around the timing and scale of tariffs to be implemented by the US administration following US President Donald Trump’s cabinet meeting on Wednesday. Trump said that the 25% tariffs on Mexico and Canada would be implemented on April 2, rather than the looming March 4 date. It wasn’t clear if the president meant that he was giving the countries additional time, or got confused with a separate program. Either way, the slew of contradictions has stoked investor skepticism over Trump’s policy agenda.

Equity markets have been rattled in the wake of the ongoing twists and turns in the tariff narrative, with US equities having now wiped out the initial post-election burst. But currencies appear to be taking it in their stride a little more, with realised volatility in G10 FX shrinking of late. Aside from tariff uncertainty, the growth-scare narrative in the US has worsened, which has led to risk-off market conditions . A combination of weaker growth and disinflationary forces will encourage further interest rate cuts at the Federal Reserve (Fed), with markets now pricing two 25 basis point cuts for the year, whereas the expectation was for just one cut two weeks ago.

Meanwhile, in the commodities space, oil prices are trading a multi-month lows having lost around 4% this month as Trump’s aggressive moves on trade triggered anxiety at a time when oil traders were already concerned about lackluster consumption in China. Moreover, hopes for a potential Russia-Ukraine peace deal weighed on the market, as lifting Russian sanctions could increase global oil supply. Commodity FX thus remains under pressure with the Aussie and Canadian dollars trading softer.

Chart of policy uncertainty

Tariff threats losing sting on euro

George Vessey – Lead FX & Macro Strategist

The euro retreated from a one-month high of $1.0528, whilst Germany’s 10-year bond yield fell to 2.44%, near a one-week low, as doubts emerged over a swift increase in European defence spending and its funding through bond issuance. Meanwhile, economic data showed German consumer sentiment unexpectedly weakened heading into March. Plus, US President Trump fired another round of tariff threats overnight, but it hasn’t rattled the euro like one might have expected.

EUR/USD continues to knock on the door of $1.05 but the 100-day moving average located just above this level remains a strong barrier to the upside. Nevertheless the euro appears relatively calm after the latest bout of tariff threats, falling only 50 pips on the news. Trump stated he intends to impose duties of 25% on the European Union without giving any further details on whether those would affect all exports from the bloc or only certain products or sectors. Meanwhile, Germany’s incoming chancellor, Friedrich Merz, ruled out a swift reform of the country’s borrowing limits and said it was too early to determine whether the outgoing parliament could approve a major military spending increase.

Investors will be monitoring the trade and fiscal policy developments closely, but on the macro front today, Spanish inflation data could prove important for clues on where the Eurozone figure will land next week ahead of the European Central Bank (ECB) meeting. Markets expect another 25 basis point rate cut and about 82 bps of ECB easing in total this year. The spread between US and German 10-year yields closed at 181 basis points on Wednesday, near the narrowest since October. It’s set for the biggest monthly decline since May, which has helped support the euro’s modest rebound over the past month.

Chart of EURUSD

Sterling’s double edged sword

George Vessey – Lead FX & Macro Strategist

Due to higher interest rates in the UK relative to other G10 peers, the pound’s elevated carry status increases its exposure to equity market fluctuations. The modest uplift in equity markets helped the pound inch higher versus the euro and US dollar on Wednesday, with the former trading just shy of the €1.20 handle. GBP/EUR is up over 1% month-to-date, but is flat on the year, whilst GBP/USD is up over 2% month-to-date and near its highest in two months.

The pound’s yield advantage can be a blessing and a curse though. When markets are in risk-on mode – investors happy to take on more risk for more reward – sterling tends to appreciate, but in deteriorating global risk conditions, the pound becomes more vulnerable. This is amplified by the UK’s worsening net international investment position and persistent current account deficit, which leaves GBP reliant on foreign capital inflows. With this in mind, if we see a bigger drawdown in equity markets, expect the pound to tumble too. Several warning signals are rearing their ugly heads on this front, including bearish investor sentiment surveys and a surge in demand for protection against a stock-market correction.

We can also look at 1-month implied-realized volatility spreads in the FX space to gauge whether the market expects future volatility to be greater than what has been observed historically. From this, we can see traders are paying up for protection in safe havens like the Japanese yen and Swiss franc as they look to hedge against potential shocks from trade policy, geopolitics and political uncertainty.

Chart of implied-realized volatility spread in G10

Dollar index holds in top 5% of 7-day range

Table: 7-day currency trends and trading ranges

Table of FX rates

Key global risk events

Calendar: February 24-28

Table of risk events

All times are in GMT

Have a question? [email protected]

*The FX rates published are provided by Convera’s Market Insights team for research purposes only. The rates have a unique source and may not align to any live exchange rates quoted on other sites. They are not an indication of actual buy/sell rates, or a financial offer.


Source link

Turkey: Bridging Ambition And Reality


President Recep Tayyip Erdogan’s ambitious dreams include building Turkey from “regional economic centre into global economic powerhouse” and boosting it from the world’s sixteenth largest economy into the top 10.

In the shorter term, the bi-continental country’s much-vaunted Twelfth Development Plan (2024 to 2028) aims to improve its “international stature, fostering prosperity and combating inflation whilst maintaining strong and sustainable public finances.” That goal will depend partly on the success of an associated Foreign Direct Investment Strategy aimed at significantly boosting FDI across the board. The goal is for Turkey to account for 1.5% of global FDI and 12% of regional FDI by 2028.

As 2025 gets underway, how well is it all going?

If FDI is the main yardstick, not so well.

Full-year figures for 2024 have yet to be released, but will probably be close to the previous year’s level of $10.6 billion, down from $13.7 billion in 2022, a far cry from the 2007 peak of $22 billion, and shy of the $14 billion hoped for earlier. That’s less than 1% of GDP, against 3% in 2007 and well below both potential and policymakers’ hopes.

“Foreign investors don’t like inflation at 85%,” the rate in October 2022, “and they don’t much like it at 47%,” the rate in November 2024, says Charlie Robertson, head of macro strategy at FIM Partners, an investment fund based in the United Arab Emirates. “Persistent inflation has held back FDI in Turkey.”

Inflation And Fiscal Challenges

Turkish policymakers succeeded in restoring some stability to the nation’s economy by driving down inflation with restrictive monetary and fiscal policies, albeit with a hit to the government’s popularity.

Local elections last March gave the ruling Justice and Development Party (AK) just 35% of the vote against 52% in national elections the previous year; Erdogan’s party now trails the opposition Republican People’s Party (CHP) in current polls.

Selim, EBRD: Many factors that underlie Turkey’s potential also put it at risk.

“In the months since June 2023, when a new policy team led by Finance Minister Mehmet Simsek, Vice President Cevdet Yilmaz, and the Central Bank of Turkey (CBT) performed a sharp turnaround from unorthodox policies, there have been many positive steps toward rational policymaking,” says Rafik Selim, lead economist for Turkey at the European Bank for Reconstruction and Development (EBRD). “However, challenges have appeared along the way.”

The EBRD expects Turkey to post a GDP gain for 2024 of 2.7%, rising to 3% in 2025. Private consumption will be the biggest loser as policymakers focus on raising export-led growth above the current low ratio of 20% of GDP.

Reducing spending remains difficult, however. The 2023 fiscal deficit was 5.2%, and the 2024 level is expected to be similar despite services cuts and tax rises. The main culprit is earthquake spending. Ankara committed some $30 billion a year to help communities recover from the February 2023 quake that left several million homeless in southern and central Turkey.

That said, an unprecedented rebuilding of homes and infrastructure should lead to growth.

“Without the quake, the deficit would be 1.1%, which really isn’t bad,” Selim says, adding that 2024’s estimated deficit of 5% will likely fall to 3.1% this year.

Rebalancing The Economy

The latest inflation figures are moderately encouraging; 2024 ended with a year-on-year rate of 44%, well below what was expected, thanks mainly to falling food prices.

“Disinflation will likely continue this year, given the CBT’s signal that it will maintain its tight stance despite the start of interest rate cuts, the ongoing real TRY [Turkish lira] appreciation, and improvement in services inflation,” says ING Bank analyst Muhammet Mercan. “We expect inflation to fall below 30% by the end of 2025.”

The current account deficit has narrowed to around $10 billion from 2023’s high of $60 billion, enabling a rebuilding of foreign exchange reserves that has made Turkey less dependent on external flows.

“Capital flows have been good; every recent bond and sukkuk issue has been three or four times oversubscribed whilst yields have been going down, showing perceptions of risk are falling,” Selim observes.

Ratings agencies approve. Last year, Fitch Ratings upgraded Turkey’s sovereign debt—alongside a clutch of Turkish banks—twice, from B- to B+ in March then to BB- in September, when it became the only country in 2024 up until that point to receive an upgrade from all three ratings agencies.

“In a sense, we’ve gone back to where we were in 2021, before those unconventional policy methods that led to a dramatic deterioration in the country’s macroeconomy and financial stability prospects,” notes Erich Arispe, senior director and head of Emerging Europe Sovereigns at Fitch Ratings.

Turkey’s slower short-term growth outlook reflects the ongoing rebalancing of the economy, which will take time given sticky inflation, Arispe argues. With no elections this year, falling dollarization, rising forex reserves, and an expected drop in the fiscal deficit as earthquake spending winds down are all encouraging signs.

“Turkey has the capacity to grow,” Arispe says. “We expect 2.6% in 2025 and 3.5% in 2026, without creating other economic distortions. But this is a multi-year story, with the economy being recalibrated to produce a sustainable higher growth environment” and realize the country’s export and FDI potential.

Renewable Energy And EV Growth

A new FDI strategy will prioritize less-developed regions, infrastructure, and renewables, says Ahmet Burak Dagliogku, president of the Republic Investment Office of Turkey.

“The aim is to attract investments that contribute meaningfully to Turkey’s development goals,” he adds, including “green transformation, digitalization, high-value services, and deeper integration into global supply chains.” These priorities “will help Turkey stay ahead in a competitive global market.”

Chinese electric vehicle manufacturer BYD’s plans to build a $1 billion plant in Turkey is just the sort of encouraging development the government wants since the EV sector is one of the fastest growing in the country. Turkish auto producer TOG has now turned out more than 50,000 vehicles. EVs are expected to account for 30% of total auto sales by the end of this year.

 Also worth noting, considering its energy security has always been a concern, is the government’s commitment to renewables. “Turkey will invest more than $100 billion by 2035 to increase its renewable capacity and modernize its infrastructure,” says Dagliogku. “This extensive investment plan highlights Turkey’s unwavering dedication to achieving its net-zero target while ensuring energy security and economic growth.”

Meanwhile, Turkey has been working closely with the EBRD and other multilateral development lenders. Last year, the EBRD committed about $22 billion, invested across almost 500 projects and trade facilitation lines.

“No, this isn’t an accident,” says the EBRD’s Selim. “We and Turkey have big green, digital, inclusion ambitions which are linked and where projects have been growing, to the extent that almost half our portfolio is in sustainable infrastructure. We want to further scale up Turkey’s green energy capacity, and five cities here are now part of our Green Cities program.” The EBRD has also been working with other banks on issues related to green bond issuance and encouraging private-sector Turkish companies to move to a low-carbon pathway.

Prospects For 2025

A further promotion to investment grade status by the ratings agencies would be a big step toward realizing Erdogan’s wider 2028 ambitions.

“If you look back over the last eight or so years, there’s always been something to scare investors and throw things off track,” notes Selim: “a coup attempt, elections, COVID, Russia’s invasion of Ukraine, more elections. Investors are looking for certainty and policy tightness for at least, say, a three-year period. This is key if Turkey is to realize its potential of 4% to 5% annual growth.”

Longer term, that potential is huge, and Turkey’s private sector has a remarkable ability to adapt, Fitch’s Arispe says. However, “it takes time to re-establish macro credibility and for this to sink in with investors,” he warns. Many of the factors that underlie Turkey’s potential also put it at risk, including its geographical location, the possibility of taking an indirect hit from higher US tariffs, and exposure to changes in investor sentiment.

“Many factors are beyond Turkey’s control—and not least the current, highly fluid international outlook,” he notes. 

The post Turkey: Bridging Ambition And Reality appeared first on Global Finance Magazine.


Source link

Copyright © 2023 | Powered by WordPress | Coin Market Theme by A WP Life