Archives May 2025

British Rarities Star in Heritage’s CSNS WorldCoins Auction


Tucked in among the more than 500 lots in Heritage’s CSNS World & Ancient Coins Platinum Session and Signature® Auction May 1-2 will be The Cara Collection of highly provenanced British Rarities, an assortment of nine British coins with outstanding lineage.

Oliver Cromwell gold Proof Pattern Broad of 20 Shillings 1656 PR63

“This is a remarkable collection, small in number but exceptional in quality,” says Cris Bierrenbach, Executive Vice President of International Numismatics at Heritage Auctions. “Several of the coins in this selection would be undeniable highlights of any collection, and those focusing on British coins often seek out elite pedigrees, as well. Those collectors will be very pleased with what they find in this collection.”

Among the top highlights in the collection is an Oliver Cromwell gold Proof Pattern Broad of 20 Shillings 1656 PR63 PCGS that is one of the most sought-after British gold types – in part because of its inarguable rarity, and also because of the historical implications from its time of origin, during one of the most tumultuous eras in English history. Once a part of the Selig Collection, the example offered in this auction is exceedingly rare, and is among the upper echelons of certified specimens.

Also from the Cara Collection of highly provenanced British Rarities is a Charles I gold Triple Unite 1642 AU53 PCGS, a trophy from the English Civil War that proclaims the king’s allegiance to Protestantism, the laws of England and the liberty of Parliament. Further legitimizing Charles’s claim to the throne was the sheer heft of the coin, then the largest gold type to date issued in England. The provenance of this coin is remarkable: It can be traced to one of the most famous English collections started in the 1600s, almost contemporary to its minting, and was assimilated later in the 17th century into John Egerton’s famous Bridgewater House Collection, which he largely completed in 1740. It remained in Egerton’s family through successive Earls of Bridgewater. The collection was auctioned in 1972, and again in 2013.

Charles I gold Triple Unite 1642 AU53 PCGS

An Anne gold Pattern Guinea 1702 AU55 NGC is a treasure of English numismatics that once held a spot in the H.W. Collection, the Virgil Brand Collection and the J.G. Murdock Collection. It also is the first Guinea Pattern ever struck by the Royal Mint, and one of fewer than five known examples and the finer of just two on the NGC census. Part of the intrigue of this design stems from the fact that it was minted under the management of physicist and then-Mint master Sir Isaac Newton.

Anne gold Pattern Guinea 1702 AU55

Another fascinating coin in the auction is an Edward VIII bronze Matte Proof Pattern 1/2 Penny 1937 PR64 Brown NGC that is presumed to be unique and is just the fourth example of any Edward VIII coinage that has come through Heritage in the last half decade. The controversial behavior for which Edward VIII was known extended to his proposed coinage, which broke centuries of convention, such as when he emulated his father by facing to the left. This coin is believed to be unique, in part because no other Matte Proofs of this denomination have surfaced, eluding even the British Museum and Royal Mint collections, where only brilliant Proofs reside.

Edward VIII bronze Matte Proof Pattern 1 2 Penny 1937 PR64 Brown NGC
Edward VIII bronze Matte Proof Pattern 1/2 Penny 1937 PR64 Brown NGC

Other top lots include, but are not limited to:

Images and information about all lots in the auction can be found at HA.com/3123.

About Heritage Auctions

Heritage Auctions is the largest fine art and collectibles auction house founded in the United States, and the world’s largest collectibles auctioneer. Heritage maintains offices in New York, Dallas, Beverly Hills, Chicago, Palm Beach, London, Paris, Amsterdam, Brussels, Munich, Hong Kong and Tokyo.

Heritage also enjoys the highest Online traffic and dollar volume of any auction house on earth (source: SimilarWeb and Hiscox Report). The Internet’s most popular auction-house website, HA.com, has more than 1,750,000 registered bidder-members and searchable free archives of more than 6,000,000 past auction records with prices realized, descriptions and enlargeable photos. Reproduction rights routinely granted to media for photo credit.


Source link

Best Car Loans for Bad Credit for May 2025


Why You Can Trust Us

Investopedia was founded in 1999 and has been helping readers find the best car loans for bad credit since 2020. Investopedia’s research and editorial teams conducted independent, unbiased research into the auto loan industry, collecting over 1,000 data points on 16 auto loan direct lenders and over 500 data points on auto loan aggregators. That research included information on interest rates, loan terms, borrower and vehicle requirements (including credit requirements), and customer satisfaction. Each lender and aggregator was objectively scored and ranked to determine the best picks above, with the primary criterion being a low recommended credit score.


How We Find the Best Car Loans for Bad Credit

Investopedia’s full-time research and editorial teams conducted independent, comprehensive research into auto loan direct lenders from November 2024 into February 2025. We included 16 popular auto loan lenders, and evaluated each one on 63 criteria. Another round of research into nine auto loan aggregators was conducted in April 2025. Information was collected from company websites, customer support, and media representatives. Each company was scored and ranked objectively. Information not used for scoring was collected for background.

Companies were required to have a low minimum credit score to appear on this page. Evaluation criteria for direct lenders were broken down into the following categories and given the accompanying weights:

  • Cost of Loans: 34.0%
  • Loan Terms: 28.0%
  • Borrowing Requirements: 22.0%
  • Customer Satisfaction: 10.0%
  • Additional Features: 6.0%

Evaluation criteria for aggregators were broken down into the following categories and given the accompanying weights:

  • Loan Terms: 29.0%
  • Borrowing Requirements: 24.0%
  • Cost of Loans: 22.0%
  • Customer Satisfaction: 19.0%
  • Additional Features: 6.0%

Investopedia’s full-time compliance team maintains the accuracy of information on this page to ensure our recommendations remain the best choices for their respective categories.


Source link

Best Auto Loans for Fair Credit for May 2025


Why You Can Trust Us

Investopedia was founded in 1999 and has been helping readers find the best car loans for fair credit since 2020. Investopedia’s research and editorial teams conducted independent, unbiased research into the auto loan industry, collecting over 1,000 data points on 16 auto loan direct lenders and over 500 data points on auto loan aggregators. That research included information on interest rates, loan terms, borrower and vehicle requirements (including credit requirements), and customer satisfaction. Each lender and aggregator was objectively scored and ranked to determine the best picks above, with the primary criterion being a low recommended credit score.


How We Find the Best Auto Loans for Fair Credit

Investopedia’s full-time research and editorial teams conducted independent, comprehensive research into auto loan direct lenders from November 2024 into February 2025. We included 16 popular auto loan lenders, and evaluated each one on 62 criteria. A separate round of research into nine auto loan aggregators was conducted in April 2025. Information was collected from company websites, customer support, and media representatives. Each company was scored and ranked objectively. Information not used for scoring was collected for background.

Companies were required to have a low minimum credit score to appear on this page. Evaluation criteria for lenders were broken down into the following categories and given the accompanying weights:

  • Cost of Loans: 34.0%
  • Loan Terms: 28.0%
  • Borrowing Requirements: 22.0%
  • Customer Satisfaction: 10.0%
  • Additional Features: 6.0%

Evaluation criteria for aggregators were broken down into the following categories and given the accompanying weights:

  • Loan Terms: 29.0%
  • Borrowing Requirements: 24.0%
  • Cost of Loans: 22.0%
  • Customer Satisfaction: 19.0%
  • Additional Features: 6.0%

Investopedia’s full-time compliance team maintains the accuracy of information on this page to ensure our recommendations remain the best choices for their respective categories.


Source link

Watch These Microsoft Price Levels as Stock Surges on AI Cloud Growth


Key Takeaways

  • Microsoft shares surged in extended trading Wednesday after the company issued quarterly results and guidance that topped Wall Street’s expectations. boosted by strong growth in its cloud business.
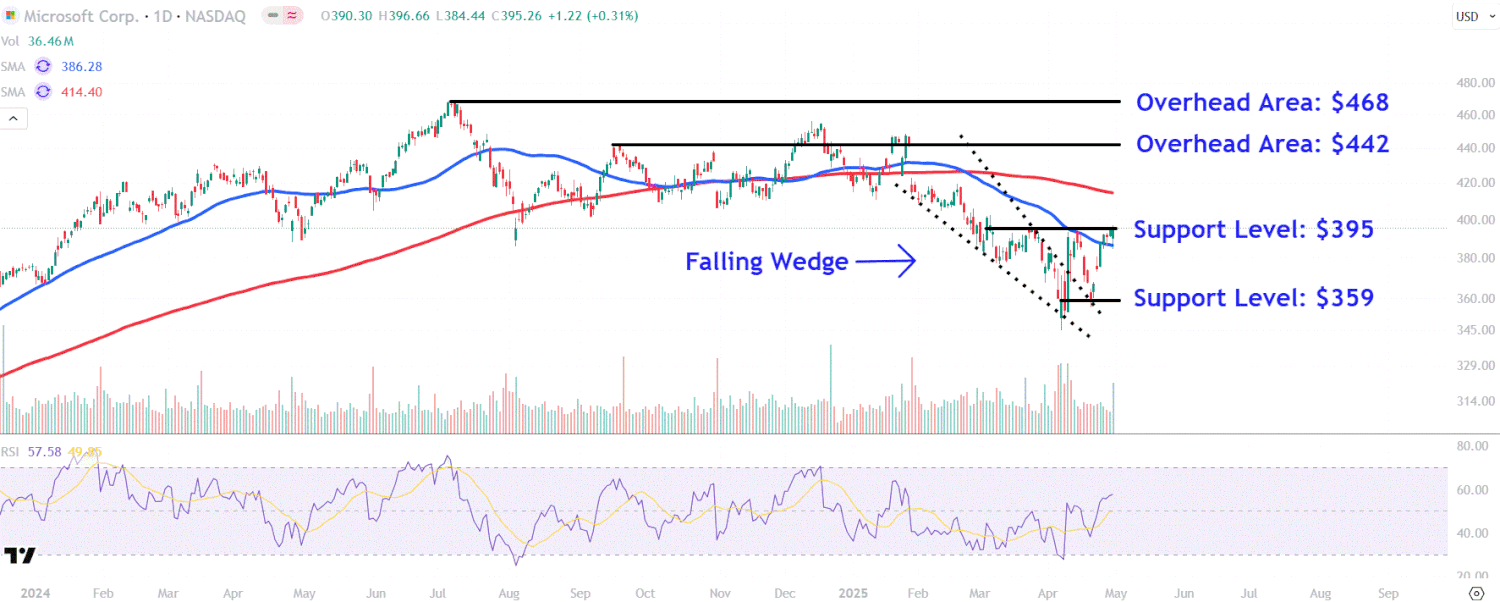
  • The stock looks set to build on recent upward momentum after a successful retest of the top trendline of a falling wedge pattern, potentially setting the stage for a longer-term bullish reversal.
  • Investors should watch two key overhead areas on Microsoft’s chart around $442 and $468, while also monitoring crucial support levels near $395 and $359.

Microsoft (MSFT) shares surged in extended trading Wednesday after the Windows maker issued fiscal third-quarter results and guidance that topped Wall Street’s expectations. boosted by strong growth in its cloud business.

CEO Satya Nadella said the company’s Intelligent Cloud segment, which houses its Azure cloud computing platform, continues to benefit from businesses’ need to expand output, reduce costs and accelerate growth, adding that Microsoft continues to innovate across its AI stack.

While Microsoft shares have risen 15% from their April low, they remain down 6% since the start of the year as of Wednesday’s close. Like other big tech names, concerns about sweeping tariffs and a reduction in AI spending continue to weigh on investor sentiment.

Microsoft shares rose nearly 7% to around $423 in after-hours trading.

Below, we take a closer look at Microsoft’s chart and use technical analysis to identify key price levels worth watching.

Successful Falling Wedge Retest 

Following a successful retest of the top trendline of a falling wedge pattern, Microsoft shares staged a sharp move higher leading into the tech giant’s earning’s report, potentially setting the stage for a longer-term bullish reversal.

It’s also worth noting that the shares on Wednesday registered their highest trading volume in three weeks, suggesting that larger market participants, such as institutional investors and hedge funds, had positioned for a significant post-earnings move.

Let’s analyze Microsoft’s chart to identify two key overhead areas to watch, while also pointing out crucial support levels worth monitoring during future retracements.

Key Overhead Areas to Watch

The first overhead area to watch sits at around $442. This level may provide resistance near a trendline that roughly links several peaks that formed on the chart between September and January.

A decisive close above this level could see Microsoft shares make a move up toward the $468 area. Investors who have accumulated shares at lower price may look for profit-taking opportunities in this location near the stock’s record high set in July last year.

Crucial Support Levels Worth Monitoring

During future retracements in the stock, it’s worth tracking the $395 level near Wednesday’s closing price. This area on the chart has provided selling pressure over the last month around the late March countertrend high and mid-April peak following the stock’s initial breakout from the falling wedge pattern.

Finally, a deeper pullback could see Microsoft shares revisit lower support around $359. Investors may seek buying opportunities in this region near last week’s trough situated just above this month’s significant swing low.

The comments, opinions, and analyses expressed on Investopedia are for informational purposes only. Read our warranty and liability disclaimer for more info.

As of the date this article was written, the author does not own any of the above securities.


Source link

Meta Boosts Spending Plans to Grow Its AI Capacity


America’s tech giants aren’t showing signs of slowing AI spending plans despite a stretch of economic uncertainty that has meant tough times for technology shares.

After Meta Platforms (META) late Wednesday reported better-than-expected quarterly earnings, touting its advertising revenue growth, the social media giant said it plans to boost its capital expenditures this year to $64 billion to $72 billion to grow its AI capacity.

CEO Mark Zuckerberg told investors on a conference call that he believes the opportunities for the company in AI are “staggering.” Meta is boosting its planned investments both to add capacity this year and to prepare for coming years, he said.

The move comes after Meta said in January that it planned to spend $60 billion to $65 billion in capital expenditures this year, up from $39 billion in 2024, as the tech giant doubles down on the emerging tech. 

Several of Meta’s Magnificent Seven peers, including Microsoft (MSFT) and Google parent Alphabet (GOOGL), have made similar announcements.

Alphabet told investors in February it would spend $75 billion in capital expenditures this year, while Microsoft projected $80 billion on infrastructure in fiscal 2025. In its earnings call Wednesday, Microsoft said it would maintain its spending outlook, as did Alphabet last week.

Meta earlier this week released its first Meta AI standalone app, allowing users to interact with Meta AI in a dedicated app, similar to the ChatGPT app. “We’ve got a lot more exciting work in the pipeline that I’m looking forward to sharing soon,” Zuckerberg said. 

Meta shares rose over 5% in after-hours trading. The stock was down 6% for the year so far through Wednesday’s close.


Source link

Meta Stock Rallies as Earnings Top Estimates, Meta AI Hits User Milestone


Meta (META) reported better-than-expected quarterly earnings, sending shares higher in extended trading Wednesday.

The Facebook, Instagram, and WhatsApp parent reported first-quarter revenue of $42.31 billion, up 16% year-over-year and above the analyst consensus from Visible Alpha. Net income of $16.64 billion, or $6.43 per share, compared to $12.37 billion, or $4.71 per share, a year earlier, also topping projections. Advertising revenue, which makes up the bulk of Meta’s revenue, climbed 16% to $41.39 billion, surpassing Street estimates.

Meta shares rose over 5% in after-hours trading. The stock was down 6% for the year so far through Wednesday’s close.

Meta Raises Spending Plans To Boost AI Capacity

“We’ve had a strong start to an important year, our community continues to grow and our business is performing very well,” said CEO Mark Zuckerberg, adding, “we’re making good progress on AI glasses and Meta AI, which now has almost 1 billion monthly actives.”

Meta said it plans to boost its capital expenditures this year to $64 billion to $72 billion to grow its AI capacity, up from $60 billion to $65 billion previously.

Looking ahead, the company said it anticipates second-quarter revenue between $42.5 billion and $45.5 billion. Analysts were looking for $44.13 billion.

This article has been updated since it was first published to include additional information and reflect more recent share price values.


Source link

Microsoft Stock Pops as Cloud and AI Strength Drives Earnings Growth


Microsoft (MSFT) reported fiscal third-quarter revenue and profits that surpassed analysts’ expectations, sending shares higher in extended trading Wednesday.

The tech titan’s revenue grew 13% year-over-year to $70.07 billion, above the analyst consensus from Visible Alpha. Net income of $25.82 billion, or $3.46 per share, rose from $21.94 billion, or $2.94 per share, a year earlier, topping Wall Street’s estimates.

Microsoft shares rose over 7% in after-hours trading. The stock was down 6% for the year so far through Wednesday’s close.

Intelligent Cloud Revenue Surges

The gains came as revenue from Microsoft’s Intelligent Cloud segment, which includes its Azure cloud computing platform, improved 21% to $26.75 billion, above expectations. Looking ahead, Microsoft said it also expects the segment to deliver 20% to 22% growth in the fourth quarter.

“Cloud and AI are the essential inputs for every business to expand output, reduce costs, and accelerate growth,” CEO Satya Nadella said. “From AI [infrastructure] and platforms to apps, we are innovating across the stack to deliver for our customers.”

During Microsoft’s earnings call, CFO Amy Hood reiterated the company’s plan to spend $80 billion on infrastructure in fiscal 2025. Hood noted demand for AI has continued to grow, to the point Microsoft expects “to have some AI capacity constraints beyond June.”

This article has been updated since it was first published to include additional information and reflect more recent share price values.


Source link

Data Show a Cooling Economy


GDP turns negative … low hiring numbers … but is this a buy-the-dip moment? … a rare indicator just went bullish … the MAGA 7 stocks … “blank sailings” soar

This morning brought three big pieces of macro data:

  • The GDP report
  • The Personal Consumption Expenditures price index (PCE)
  • The ADP jobs report

Diving in, Q1 Gross Domestic Product (GDP) contracted 0.3%, down from 2.4% growth in Q4 of 2024. This was the first negative GDP since early 2022.

In its release, the Commerce Department wrote that the decline, “primarily reflected an increase in imports” and a “decrease in government spending.”

Though President Trump’s tariffs kicked in after Q1, the increase in imports reflects companies trying to front-run Liberation-Day tariffs.  

Legendary investor Louis Navellier zeroed in on this detail in this morning’s Growth Investor Flash Alert:

There was a rush to import goods ahead of the tariff deadlines, as imports surged 41.3%, lowering growth by 4.8%.

In other words, if we back out the impact of the imports, growth was positive. So, the bottom line is I actually liked this report.

Next up, PCE inflation gave investors a mixed bag.

On one hand, the headline month-to-month reading was flat – good news.

Similarly, for “core” inflation, which strips out volatile food and energy prices, and is the Fed’s preferred inflation gauge, the number was also flat. Plus, this was below forecasts for a 0.1% increase. Also, good news.

However, year-over-year headline PCE inflation came in at 2.3%, higher than the 2.1% forecast. Bad news.

Similarly, “core” PCE inflation rose 2.6% on the year, hotter than the forecast for a 2.5% increase.

Frankly, bulls and bears will cherry-pick data in the report to build their respective cases. The safer approach is to wait another month (or two) for clearer numbers reflecting how tariffs are impacting prices.

Finally, the ADP jobs report found that the economy added only 62,000 private-sector jobs in April. That’s down from 147,000 in March, and the smallest gain since last July. It’s also barely half of the Dow Jones forecast for 120,000.

Altogether, the data reflect a nervous economy that’s unsure how to respond to today’s climate.

As to the stock market’s response, all three major indexes are down as I write, but they’re well off their lows of the morning.

Pulling back, what are we to make of this morning’s economic data considering the market’s recent rally?

Are today’s jitters a “buy the dip” moment within a wider continuation of that rally? Or is this a foretaste of a looming bear?

“A great investment opportunity occurs when a marvelous business encounters a one-time, huge, but solvable problem”

So says market legend Warren Buffett.

It makes sense. Remove that “solvable problem” and the stock price roars back to where it previously traded – and potentially higher.

Wouldn’t the logic equally apply to entire investment markets?

It did with the S&P and its 2020 Covid flash crash…

A great investment opportunity occurred when a marvelous stock market encountered a one-time, huge, but solvable pandemic.

The result was a buying opportunity/rally for the ages…

Chart showing the crash/rally around Covid. The crash proved to be an amazing buying opportunity

Source: TradingView

Are we in the middle of another such buying opportunity?

Coming into January, the market was overvalued, but it wasn’t trading at a “this bubble must burst immediately!” level. And the economy was fundamentally strong.

All the investment/economic damage suffered over the last two months has been self-inflicted…which means it can be self-corrected.

According to our hypergrowth expert Luke Lango, that self-correction is coming. And though the market has already begun pricing it in, the biggest gains remain ahead.

An “ultra-rare” indicator just went full bull

When analyzing the market, Luke uses an arsenal of indicators, charts, moving averages, fundamental ratios – you name it – to help him forecast what’s coming.

One especially powerful indicator he tracks is the Zweig Breadth Thrust (ZBT) indicator. This indicator triggers when the percentage of advancing stocks on the NYSE (measured over a 10-day moving average) rises from below 40% to above 61.5% within 10 trading days.

This rare surge in market breadth suggests that many stocks are suddenly moving higher, often marking the end of a bearish phase and the beginning of a major rally.

As you’re likely guessing, the Zweig Breadth Thrust indicator just triggered – last Thursday, to be exact.

Here’s Luke with more details:

The ZBT has only flashed 18 times since World War II. In every single instance, stocks were higher a year later — with average gains of 25%.

That’s not noise. That’s a signal.

Meanwhile, the S&P 500 just last week notched three straight days of gains over 1.5%. That’s another rare signal. Since 1950, every time that’s happened, stocks have been higher a year later — every single time — with average gains of 10%.

You don’t see this kind of price action in the middle of a collapse. You see it when a collapse is ending.

We think stocks have bottomed — and we’re very bullish heading into the summer.

What Luke is buying today to ride this summer bull market

In yesterday’s Digest, we introduced Luke’s “MAGA 7” stocks. It’s a twist on President Trump’s “Make America Great Again” slogan, referring to…

Make AGreat in America

In this case, the “AI” refers to next-generation AI robotics that will power Trump’s efforts to revitalize the American manufacturing base.

In yesterday’s Digest, we detailed why the onshoring effort won’t result in millions of new jobs for human workers. In short, the numbers just don’t work.

Instead, Corporate America will turn to AI. The outcome will be the accelerated adoption of robotics as businesses look for ways to cut input costs and blunt the impact of rising trade-related expenses.

This will be an enormous tailwind for a small group of stocks that find themselves in the middle of this economic shift – and that’s where Luke is hunting today:

My MAGA 7 stocks are seven smaller AI companies — several of which you’ve likely never heard of — that are about to ride a wave of federal funding, corporate spending, and reshoring urgency into the spotlight.

They’re building the tools. Laying the fiber. Supplying the chips. Automating the factories. And powering the intelligence behind America’s next great tech renaissance.

For more on this basket of AI leaders, as well as the broader investment opportunity surrounding AI and robotics, Luke is holding his 2025 Summer Panic Summit tomorrow at 7 PM Eastern.

Here, Luke explains why “panic” is the appropriate word to use:

Investors are sitting on a record $7 trillion in cash, waiting for the opportunity to jump in. Private equity alone is sitting on at least $2.62 trillion, according to S&P Global Market Intelligence.

Though the ZBT Indicator says the surge starts now, a second, even bigger catalyst on May 7 could change the entire market and create a summer “panic” like we’ve not seen since 1997.

Similar to how many naysayers of the early days of the Covid rally eventually realized they were late to the rebound and cannonballed into stocks, Luke believes we’ll see a similar dynamic play out in the coming weeks/months. You’ll get all those details on Thursday. To join, clicking here will instantly sign up with an auto-registration.

Circling back to Buffett and the idea of a one-time, huge, but solvable problem, here’s Luke with measured perspective:

Volatility creates opportunity.

Every sell-off feels scary in the moment. But in hindsight, it always looks like a gift.

This time will be no different.

Beneath the surface of the market chaos, the next great tech rally is forming.

Here’s the one-click, instant sign-up link again.

Is it time to stock up on toilet paper again?

In yesterday’s Digest, we reported on the knife-edge drop in shipping traffic from China to U.S.

According to Vizion Global Ocean Bookings Tracker, China-to-U.S. vessel traffic has fallen 22.2% over the last two weeks. On a year-over-year basis, it’s off 44%.

This is resulting in a sharp rise in “blank sailings” between China and the U.S.

For more, Let’s go to maritime news website Splash 247:

Blank sailings occur when ocean carriers skip scheduled port calls due to low freight demand or equipment shortages, disrupting supply chains.

In April 2025, over 80 blank sailings were reported, surpassing the 51 from May 2020, signaling a severe collapse in global shipping activity…

The Sea-Intelligence Blank Sailings Tracker measures, on a weekly basis, the number of planned sailings which are blanked for the coming 12 weeks, as well as the capacity taking out due to this blanking.

The latest data from Sea-Intelligence, described as “staggering” in a weekly report published yesterday, shows that carriers anticipate container demand for week 18, next week, on the Asia to US west coast trade lane will be 28% lower than expected, while for week 19, carriers are expecting shippers to move as much as 42% less cargo than anticipated on the Asia to US east coast trade lane. 

Now, this doesn’t mean it’s time to race to the supermarket and stock up on toilet paper (over 99% of toilet paper used in the U.S. is domestically produced). But unless something changes, supplies of toys, apparel, and furniture could be sparse in the coming weeks.

Here’s Investopedia from yesterday:

If traffic remains depressed, Americans may soon contend with shortages of items commonly sourced from China, which could push prices higher, [Torsten Sløk, Apollo Global Management’s chief economist] said.

Ongoing and fast-evolving trade policies could have a particularly dramatic impact on toys, apparel and furniture.

Some $41 billion in toys, games and sports equipment was imported in 2024, and merchandise from China accounted for more than 70% of that, according to data from the Department of Commerce.

Remember, if we learned one thing with Covid, it’s that supply chains turn off quickly, but can take months to restart.

So, beyond the immediate economic hit, the longer this trade war drags on, the greater the risk that shortages extend into the back-to-school and holiday shopping seasons.

But – quoting ourselves from earlier in this Digest

All the investment/economic damage suffered over the last two months has been self-inflicted…which means it can be self-corrected.

Just one social media post from President Trump will begin cleaning up all this mess, and will send the market exploding higher. After all…

A great investment opportunity occurs when a marvelous stock market encounters a one-time, huge, but solvable trade war.

That’s what we’re hoping for…and it’s what Luke is positioning his readers for.

Have a good evening,

Jeff Remsburg


Source link

Greenback higher as corporate earnings stay strong…for now – United States


Written by Steven Dooley, Head of Market Insights, and Shier Lee Lim, Lead FX and Macro Strategist

USD stronger as tech earnings boost 

The US dollar was mostly higher overnight as US corporate earnings, including Microsoft and Meta, came in much stronger than expected despite growing concerns around the impact of tariff uncertainty.

The corporate news contrasted with a weaker than expected US GDP number with first-quarter advance US GDP falling 0.3% versus market expectations for a 0.3% gain.

In FX markets, the US dollar was mostly higher, with the USD index back near two-week highs.

European FX was mostly weaker with the euro and British pound both lower overnight.

Across APAC, the moves were more muted. The USD/SGD eased to one-week lows while the USD/CNH inched higher from one-month lows.

The NZD/USD fell to two-week lows before later recovering to end flat.

Chart showing USD index extends rebound

Australian CPI above consensus, but RBA remains likely to cut

The AUD/USD bucked the trend with the pair up 0.3% and still broadly near four-month highs.

The Australian dollar was higher yesterday after headline CPI for the first quarter of this year was 2.4% year over year, higher than the 2.3% consensus expectation.

The trimmed mean measure, which the Reserve Bank of Australia most closely watches, was 2.9%, higher than the consensus of 2.8%.

While higher, this is about what was expected and probably “good enough” for the RBA to make a 25 bps cut in May. The market continues to see a rate cut in May as a “sure thing” with 27bps priced in (source: Bloomberg).

The AUD/USD remains broadly near four-month highs, and hovering around 200-day EMA key resistance of 0.6399 – a technical level that has historically provided major resistance.

Chart showing Australian CPI higher than expected, RBA to cut

Official PMIs from China miss as USD/CNH sticks near lows

The Chinese economy looks to be showing some of the first impacts of tariff worries, with China’s official manufacturing PMI for April reported at 49, below the 49.7 forecast and 50.5 before.

PMI for non-manufacturing was 50.4, missing both the previous 50.8 and the expected 50.6. April’s composite PMI of 50.2 was much lower than March’s 51.4.

Specifically, manufacturing fresh export orders fell from 49 to 44.7, according to statistics from the National Bureau of Statistics.

USD/CNH has now corrected more than 2% from its recent highs of 7.4290 on 8 April, 2025.

Next key support level for USD/CNH lies on 200-day EMA of 7.2560.

USD buyers might look to take advantage soon given our expectations of higher USD/CNH over time. Our 12-month price target for USD/CNY is 7.5700.

Chart showing key support 200-day EMA for USD buyers

Aussie higher after CPI   

Table: seven-day rolling currency trends and trading ranges  

Table: seven-day rolling currency trends and trading ranges

Key global risk events

Calendar: 29 April – 3 May

Key global risk events calendar: 29 April – 3 May

Have a question? [email protected]

*The FX rates published are provided by Convera’s Market Insights team for research purposes only. The rates have a unique source and may not align to any live exchange rates quoted on other sites. They are not an indication of actual buy/sell rates, or a financial offer.

Convera live - Register now


Source link