Archives April 2025

STAG Industrial (STAG) | Monthly Dividend Safety Analysis


Updated on April 1st, 2025 by Nathan Parsh

The real estate industry is a great place for investors seeking yield. Intuitively, this is not surprising. Real estate owners collect predictable income from their tenants. Thus, the real estate business is qualitatively geared toward owners wanting to collect periodic income.

One of the best ways for investors to gain exposure to the real estate industry is through Real estate Investment Trusts – or REITs.

STAG Industrial (STAG) is a commercial REIT that leases single-tenant industrial properties throughout the US. The stock’s current dividend yield of 4.1% is more than triple the 1.3% average yield in the S&P 500.

Moreover, STAG Industrial pays monthly dividends (rather than quarterly). This is highly beneficial for retirees and other investors who rely on their dividend income to cover life’s expenses. There are currently 76 monthly dividend stocks.

You can download our full Excel spreadsheet of all monthly dividend stocks (along with metrics that matter, like dividend yield and payout ratio) by clicking on the link below:


Thanks to its high yield and its monthly dividend payments, STAG Industrial has the potential to be a great investment for income investors, particularly since the trust has a long runway of growth ahead.

Business Overview

STAG Industrial is a Real Estate Investment Trust (REIT). It owns and operates industrial real estate. It is focused on single-tenant industrial properties and has nearly 600 buildings across 41 states in the United States. This REIT’s focus on single-tenant properties might create higher risk compared to multi-tenant properties, as the former are either fully occupied or completely vacant.

Source: Investor Presentation

STAG Industrial executes a deep quantitative and qualitative analysis of its tenants. As a result, it has incurred credit losses that have been less than 0.1% of its revenues since its IPO.

The trust typically does business with established tenants to reduce risk. Moreover, STAG Industrial has limited exposure to any specific tenant. STAG has an added advantage thanks to its exposure to e-commerce properties, which gives it access to a key growth segment in real estate.

The penetration rate of e-commerce is expected to grow from 14% in 2021 to 30% by 2030. This secular shift in consumer behavior will provide a strong tailwind to STAG’s business for the next several years.

STAG is currently facing a headwind due to the rise of interest rates. However, the effect of the higher interest rates on the REIT has been limited so far, thanks to the high credit profile of its tenants.

Some REITs view single-tenant properties as risky because they are binary propositions; they are either fully leased or empty. However, focusing on single-tenant properties creates mispriced assets, which STAG can add to its portfolio at attractive valuations. This is central to STAG’s strategy and is a key differentiator among competitors.

STAG’s addressable market is in excess of $1 trillion, a significant portion of which comprises single-tenant properties. The sector is highly fragmented, meaning that no particular entity would have a considerable scale advantage. This is why STAG believes it can purchase mispriced assets.

STAG finds this to be an attractive mix of assets. Combined with relatively low capex and high retention rates, it has created a strong portfolio of industrial real estate.

STAG’s tenant profile reflects the vast diversification it has built into its portfolio. This diversification greatly mitigates the risk of owning single-tenant properties. STAG has done a nice job of taking a relatively risky sector of real estate—single-tenant properties—and building a portfolio that greatly reduces that risk.

Growth Prospects

STAG Industrial’s growth since its IPO in 2011 has been impressive from both a fundamental and an investor return perspective. Fortunately, this real estate trust still has ample room for future growth.

The trust reported strong growth in its financial and operating results for Q4 2024 on February 12th, 2025.

The trust achieved net income of $0.28 per share, up from $0.23 in Q4 2023, with total net income rising to $50.9 million. Core FFO per share grew 5% to $0.58 for the quarter, while Cash NOI increased by 8.6% to $155.5 million. Same-store cash NOI improved 4.4% to $139.2 million. This growth was driven by the sustained strength of the REIT’s tenants and hikes in rent rates.

Source: Investor Presentation

The trust made significant moves during the quarter, acquiring 15 buildings totaling 2.4 million square feet for $293.7  million and selling two buildings for $29.4 million. STAG’s portfolio maintained a high occupancy rate of 96.5%, though this was a 60% basis point decline year-over-year. The operating portfolio occupancy rate was slightly higher at 97.5%. New leases covered 279K square feet with significant rent growth, and 76.9% of expiring leases were renewed.

New leases for the year covered 2.86 million square feet with cash rent growth of more than 28% for new and renewed leases, while 76.6 of expiring leases were renewed.

Moody’s reaffirmed STAG’s Baa3 rating and upgraded its outlook from Stable to Positive in June 2024, demonstrating the trust’s improving fundamentals.

Dividend Analysis

STAG is a high-dividend REIT. Its dividend is obviously very important, as investors generally own REITs for their payouts. STAG’s payout has grown yearly since its IPO and is currently $1.49 per share. However, dividend growth since 2015 has been minimal, averaging only 1.0% yearly.

We do not see material growth in the dividend moving forward. Still, STAG’s payout ratio, which currently stands at 60% of expected FFO-per-share for 2025, provides a meaningful margin of safety for the dividend. We expect STAG to continue raising its dividend very slowly for the foreseeable future to avoid ending up in a tight spot like it did in the earlier half of the trailing decade.

The payout ratio is down significantly from its 2016 level of near 100%, as STAG has made a concerted effort to reduce the vulnerability of its dividend. However, that effort is still underway, and hence, we see meaningful payout growth as unlikely in the near term.

The current payout ratio, combined with our expectations for mid-single-digit FFO-per-share growth in the coming years, should gradually improve the safety of STAG’s dividend. The trust has also made divestitures when pricing is favorable, an option it could use to temporarily cover dividend shortfalls. In short, we view the REIT’s 4.1% dividend yield as safe for the foreseeable future.

Final Thoughts

STAG Industrial has two characteristics that immediately appeal to income investors: a 4.1% dividend yield and regular monthly dividend payments. In addition, REIT has promising growth prospects and are reasonably valued. As a result, it can offer a total average annual return of about 10% over the next five years.

We like the trust’s strategy for long-term growth in a real estate sector that investors sometimes ignore due to its perceived riskiness. Thus, STAG Industrial is a good potential addition to a high-yield portfolio, thanks to its high dividend yield, monthly dividend payments, and leadership in the single-tenant industrial real estate market. Overall, STAG Industrial seems an attractive candidate for income-oriented investors, especially in the highly inflationary investing environment prevailing right now..

Don’t miss the resources below for more monthly dividend stock investing research.

And see the resources below for more compelling investment ideas for dividend growth stocks and/or high-yield investment securities.

Thanks for reading this article. Please send any feedback, corrections, or questions to [email protected].


Source link

What a Frightening Tariff Week Will Most Likely Conjure


Violent swings have left stocks in a very precarious – or maybe promising – technical situation

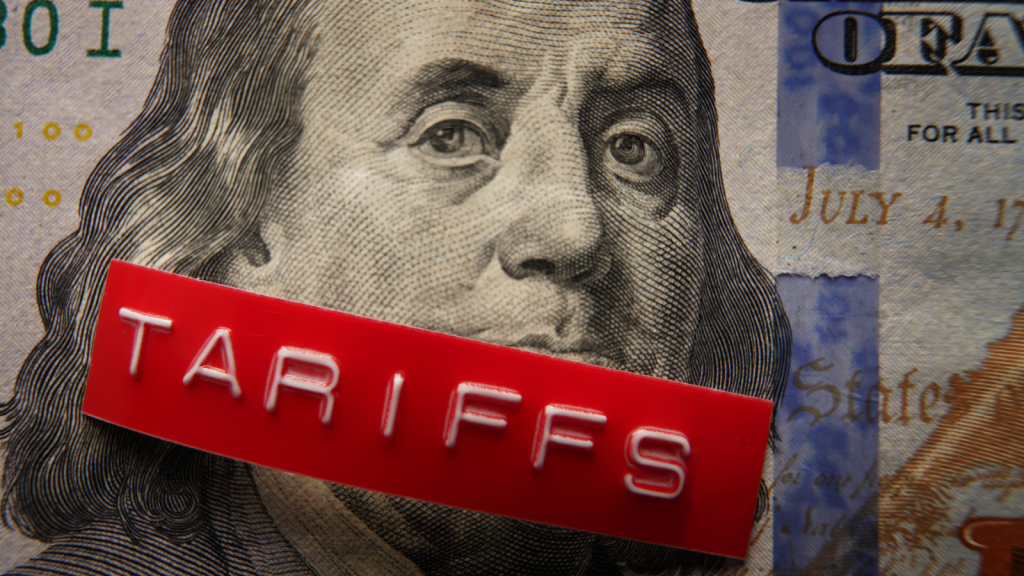
Welcome to the ultimate Tariff Week, folks – perhaps the most dramatic episode of global economic theater since 2020’s COVID lockdowns began. 

Tomorrow, Wednesday, April 2 is the big one: now known across trading desks as “Liberation Day.” That’s when U.S. President Donald Trump is expected to drop the hammer with a sweeping new set of tariffs that could restructure the entire global economic order.

Naturally, investors are nervous right now. And who can blame them?

The numbers tell the tale. The S&P 500 has cratered more than 10% from its all-time highs. The Nasdaq is down roughly 15%. And the Russell 2000? It’s flirting with a 20% nosedive.

That makes this the biggest market correction since 2022. And while volatility isn’t exactly a stranger to Wall Street, this one hits differently… 

Because it’s not about interest rates, earnings misses, or some overhyped AI stock that turned out to be smoke and mirrors.

This is about the fundamental rules of global commerce being redrawn in real time.

The Tariff Toll on Markets

If you’ve been watching the markets over the past month, you’ve basically been locked into an emotional hypercoaster – with no safety harness.

It started back in February, when Trump floated the idea of universal tariffs on all countries and triggered a sharp leg down in stocks. Investors braced for a full-scale global trade war.

Then came the walk-back.

By mid-to-late March, the narrative had shifted to more “surgical” trade policy: targeted tariffs on the “Dirty 15” – the 15 countries with which the U.S. runs its largest bilateral trade deficits. That shift was enough to spark a brief but powerful relief rally, as cooler heads seemed poised to prevail.

But now? Here we go again.

Over the weekend, reports began circulating that Trump’s team was reconsidering the idea of blanket tariffs on all countries. This messaging unravelled the prior “targeted” narrative and sent markets plunging back to the March lows. It’s been a nonstop whiplash cycle of panic, hope, panic again; and no one knows what to believe anymore.

All these violent swings have left stocks in a very precarious – or maybe promising – technical situation… 

What’s to Come on Wednesday

The S&P 500 has officially broken below its 250-day moving average for just the second time since this AI-fueled bull market began. That level has acted as the market’s trampoline in the past. But when it breaks? Things tend to go from bouncy to bloody in a hurry.

Historically, dips to this level result in one of two outcomes:

  1. A monster rebound rally that leaves short sellers in the dust; or
  2. The beginning of a true bear-market meltdown.

This is a technical tipping point. And with “Liberation Day” looming, the fundamentals are about to either validate or obliterate the charts.

So, with all this volatility, uncertainty, and tariff brinkmanship… are we panicking?

Not quite. 

We still think Liberation Day won’t be nearly as bad as feared. Our take? Trump’s threat of universal tariffs is mostly bluster – an opening chess move, not checkmate.

Our base case remains:

  • Tariffs will be targeted, not universal.
  • The Dirty 15 get hit, but not the world at large.
  • And once the dust settles, fast-and-furious negotiations will begin.

As painful as tariffs are for the U.S., they’re even more devastating for just about every other economy involved. Europe, Canada, South Korea, Japan – they have more to lose; and they know it.

These nations have significant export sectors, and a large portion of their GDP comes from trade. The U.S. also has a more diversified set of trading partners than many of these countries do. So, if tariffs are imposed on a particular country, it would likely be harder for it to replace lost business with the U.S. market.

That’s why we expect rapid deals, quick walk-backs, and a broader deescalation through April.

In other words, we’ve reached the climax of this trade war drama.


Source link

Markets brace for reciprocal tariffs impact – United States


Written by the Market Insights Team

Checking in on the auto industry

Kevin Ford – FX & Macro Strategist

The U.S. administration recently imposed a 25% tariff on auto imports, effective April 3, aiming to make it permanent. These tariffs directly impact five key trading partners—Mexico, Japan, South Korea, Canada, and Germany—with Canada standing out as one of the most affected. Ontario, responsible for 85% of Canada’s auto and parts industry, will bear the brunt of this policy. In 2024 alone, the U.S. imported $31.2 billion worth of vehicles and parts from Canada. Major industry players—Ford, GM, Stellantis, Honda, and Toyota—assemble over 1.4 million light vehicles in Canada each year, alongside 460,000 passenger vehicles and 23,000 heavy trucks.

The tariffs are designed to incentivize domestic production, and some foreign automakers, like Hyundai, have committed significant investments, such as $21 billion in U.S. operations between 2025 and 2028. However, the auto industry’s global supply chain presents significant challenges. North America’s interdependent trade network—established through agreements like the 1965 Auto Pact and later reinforced by NAFTA and the USMCA—relies on cross-border cost efficiencies. These agreements have historically been celebrated as milestones in fostering trade cooperation and industry growth.

Achieving fully domestic manufacturing remains a distant goal due to supply chain complexities. Even the Ford F-150, often touted as the “most American” car, saw the U.S. and Canadian share of its value drop from 75% in 2012 to 45% by 2024. U.S. automakers depend heavily on imported components, and while partial exemptions for Canada and Mexico exist, they only apply to parts significantly transformed within the U.S. This leaves manufacturers vulnerable to escalating production costs.

Canada’s counter-tariff list, worth C$155 billion, notably excludes auto-related goods, highlighting the Canadian government’s acknowledgment of the potential damage auto tariffs could inflict on North America’s tightly integrated production network.

As the tariff debate reaches its peak this Wednesday, market uncertainty remains high. Businesses, consumers, and investors are unlikely to receive the policy clarity they seek in the near term. President Trump has mentioned the possibility of negotiating reciprocal tariffs, but he also emphasized the administration’s long-term commitment to sector-specific tariffs, including those on autos.

Table Canadian retail sales

Uncertainty likely to persist beyond Liberation Day

George Vessey – Lead FX & Macro Strategist

Global markets extended their decline on Monday as trade war concerns continued to dampen investor sentiment, while safe haven Gold saw another strong rally, with prices continuing their run to record highs. The US dollar index ended the month 3% lower, its worst month since November 2022, but started the week on the front foot thanks to some defensive positioning. With so-called “Liberation Day” looming, uncertainty is high, and the range of possible outcomes is wide, with the administration considering various factors, including tariff rates, non-tariff measures, and value-added taxes, which could affect the final outcome.

The US administration’s chaotic approach to economic and trade policy seems to be weighing more heavily on its domestic consumers and businesses relative to peers. This is evidenced by recent US survey data with uncertainty on main street near record highs and consumer confidence at multi-year lows as respondents remain hesitant about economic conditions amid ongoing policy developments. With inflation still stuck above the Fed’s 2% target, and uncertainty around how much tariffs may fuel a rise in prices for consumers and businesses, the central bank has so far in 2025 maintained its benchmark rate at the current level of 4.25% to 4.5%. While the reciprocal tariff announcement tomorrow should provide some incremental clarity on the countries and products impacted and the rates of the levies, these will likely be subject to continued negotiation.

As such, scope for a sustained rebound in risk appetite and therefore risky assets, like equities and pro-cyclical or commodity-linked currencies, appears limited in our view. If trade frictions worsen, a recession is a realistic risk across major economies. This is why hard economic data remains integral too, with eyes on US ISM manufacturing PMI and JOLTS job openings today.

Chart: Global equities turning lower into Liberation Day.

Euro held back by softer inflation

George Vessey – Lead FX & Macro Strategist

The euro stabilised around the $1.08 level at the start this week as investors assessed key inflation data while bracing for reciprocal US tariffs set to take effect on Wednesday. Expected volatility in EUR/USD remains subdued, reflecting trader complacency, with one-week swings estimated within 1.3% – a far cry from recent 1-week ranges. The currency pair staged a 1-week rise of 4.4% earlier this month – its second biggest rise since 2009.

On the data front, inflation for March brought some relief for the European Central Bank (ECB) yesterday. German headline inflation eased to 2.2% y/y – a 2-year low, while core inflation dipped to 2.5% from 2.6%. Across the eurozone, inflation also fell sharply to 2.3% from 2.8% in February. Germany’s import prices did surge 3.65% though, the highest since January 2023, while retail sales rose 0.8% m/m, marking the biggest increase in five months. Despite this resilience, Germany’s 10-year Bund yield fell to a four-week low as global borrowing costs declined amid escalating trade war fears. Still, the spread between US 10-year Treasury yields and German Bunds has narrowed by the sharpest margin since 2008 (excluding pandemic-related moves). This has coincided with the over 4% rise in EUR/USD this quarter – the strongest Q1 since 2016.

This mostly reflects Germany’s fiscal stimulus package, which aims to support growth. It also reflects the growing concern over inflation risks, potentially keeping ECB rate cutting at bay. But while trade tensions could temporarily lift inflation, a prolonged trade war might weaken growth, turning into a disinflationary force.

For now, euro traders remain on edge because if the US does opt for high tariffs on all EU products this week, EUR/USD could be driven back towards the 200-day moving average nearer $1.07. Conversely, there is a chance traders view this as riskier to the US economic outlook, in which case EUR/USD could move back above $1.09

EUR/USD volatility not far above historical average.

Lacking directional conviction

George Vessey – Lead FX & Macro Strategist

The British pound edged higher against the euro and slightly lower against the dollar on Monday, though the latter clocked its best month since November 2023. Nervousness about the scale and timeline of Trump’s proposed tariffs keeps direction relatively random, confirming a lack of conviction as to how the currency market should react to the announcements on Wednesday.

With focus on April seasonality and bets the UK economy may prove to be relatively shielded from US tariff announcements this week, the pound looks to be in a more favourable position relative to its peers. Because the UK is perceived to be relatively at little risk to US tariffs relative to major peers, sterling has at times found itself well supported around tariff announcements. Indeed, GBP/EUR has recorded three consecutive weekly advances against the euro, although upside momentum is far from strong and the pair is prone to mean reversion around €1.19. Plus, given the elevated focus on tariffs, anything short of immediate implementation could drive some relief for the euro in the short term.

On the data front, the Lloyds business optimism index was published yesterday. This is a strong leading indicator of economic activity in the UK and has rebounded back to levels seen only a handful of times since 2017. Final PMI figures for March are due this week, but will play second fiddle to the tariff chatter.

Chart: Leading indicator for UK GDP growth near highest since 2017.

Mexican Peso slides, erasing yearly gains as April 2nd approaches

Table: 7-day currency trends and trading ranges

Table rates

Key global risk events

Calendar: March 31- April 4

Table Key global events

All times are in ET

Have a question? [email protected]

*The FX rates published are provided by Convera’s Market Insights team for research purposes only. The rates have a unique source and may not align to any live exchange rates quoted on other sites. They are not an indication of actual buy/sell rates, or a financial offer.


Source link

Diverging Paths: Japan Embraces ESG As US Retreats


Political opposition stalls US momentum in green investing, while Japan takes the lead with GX bonds and a long-term financing strategy.

Japan’s commitment to ESG principles remains steadfast, even as major economies diverge in their approaches. While the United States grapples with an ESG backlash marked by legal challenges and political resistance, Japan is doubling down on its green initiatives, notably through the issuance of Green Transformation (GX) bonds.

Japan has emerged as a leader in climate transition finance, becoming the first country to issue sovereign transition bonds in February 2024. These five-year Climate Transition JGBs raised 100 billion yen (about $680 million), with subsequent auctions planned for 2025, underscoring the government’s dedication to funding decarbonization projects. The Ministry of Finance highlighted that these bonds align with the Paris Agreement’s goals and are designed to support industries in hard-to-abate sectors.

“Japan is taking an evidence-based approach to ESG, focusing on science-based targets and transparency,” said Hiroshi Tanaka, an ESG analyst in Tokyo. “The GX bonds are a clear signal of our commitment to sustainable growth.”

While Japan accelerates its ESG efforts, the United States faces growing skepticism. Over the past few years, conservative lawmakers and political figures have pushed back against ESG investing, arguing that it puts social or political goals ahead of financial performance. States like Texas and Florida have enacted legislation to restrict the use of ESG criteria in state-managed investments. Lawsuits targeting ESG-related disclosures and investment practices have surged, fueled by concerns over fiduciary duty and political polarization. A recent report from Harvard Law School noted that litigation risks have become a significant deterrent for US companies pursuing ESG strategies.

“In the US, ESG has become a political football,” said Sarah Miller, a corporate governance expert. “The backlash reflects deeper ideological divides and fears of overregulation.”

In contrast, Japanese policymakers view ESG as a long-term economic imperative rather than a partisan issue. “For Japan, ESG is not just about compliance; it’s about creating value for future generations,” Tanaka said.

Japan’s approach aligns closely with that of the European Union, where ESG remains central to regulatory frameworks like the Corporate Sustainability Reporting Directive (CSRD). Both regions emphasize transparency and accountability in climate-related disclosures. However, the US has seen efforts to roll back ESG initiatives at both state and federal levels.

A recent Forbes article highlighted this divergence: “While Europe and Japan are embedding ESG into their economic systems, the US is witnessing a retrenchment driven by political opposition and legal challenges.”

Despite global headwinds, Japan appears undeterred in its ESG journey. The government plans to expand GX bond issuance and encourage private-sector participation in sustainable finance. Experts believe this proactive stance will position Japan as a global leader in climate transition efforts.

“Japan’s strategy is pragmatic yet ambitious,” said Tanaka. “It recognizes that achieving net-zero emissions requires both public and private investment.”

As the world navigates complex ESG dynamics, Japan’s commitment offers a stark contrast to the turbulence elsewhere, especially in the US. Whether this divergence will widen or converge remains an open question.


Source link

Monthly Dividend Stock In Focus: Realty Income


Updated on March 29th, 2025 by Nathan Parsh

Investors interested in owning stocks for income can easily be drawn to Real Estate Investment Trusts, or REITs.

These stocks offer investors the chance to own a piece of a trust that leases out properties and essentially passes all of its earnings back to shareholders as dividends.

Realty Income (O) has a 5.7% dividend yield and an extraordinary dividend history. It also pays its dividends monthly instead of quarterly.

There are ~75 companies that pay monthly dividends. You can download our full Excel spreadsheet of all monthly dividend stocks along with metrics that matter like dividend yield and payout ratio) by clicking on the link below:


This article will discuss Realty’s business model, its growth prospects, and its dividend analysis in detail.

Business Overview

Realty Income is a retail-focused Real Estate Investment Trust that has earned a sterling reputation for its dividend growth history.

Part of its appeal certainly is not only in its actual payout history, but the fact that these payouts are made monthly instead of quarterly.

Indeed, Realty Income has declared nearly 660 consecutive monthly dividends, an unprecedented track record among monthly dividend stocks.

Since its initial public offering in 1994, Realty Income has increased its dividend 130 times. It is a member of the Dividend Aristocrats.

The company’s long history of dividend payments and increases is due to its high-quality business model and diversified property portfolio.

The trust employs a highly scalable business model, enabling it to grow into a massive landlord of more than 15,600 properties.

Source: Investor Presentation

It owns retail properties that are not part of a wider retail development (such as a mall) but instead are standalone properties.

This means the properties are viable for many tenants, including government, healthcare, and entertainment services.

The results of this model speak for themselves: 13.4% compound average annual total return since the 1994 listing on the New York Stock Exchange, a lower beta value (a measure of stock volatility) than the S&P 500 in the same time period, and positive adjusted funds from operations growth in 28 out of the past 29 years.

On February 24th, 2025, Realty Income reported second-quarter results. For the quarter, net income available to common stockholders was $199.6 million, or $0.23 per share. Adjusted funds from operations (AFFO) per share increased by 4.0% to $1.05 compared to the same quarter in 2023.

For the year, net income available to common stockholders was $847.9 million, or $0.98 per share. Adjusted funds from operations (AFFO) per share increased by 4.8% to $4.19.

Growth Prospects

Realty Income’s growth has been quite consistent; the trust has a long history of growing its asset base and average rent, collectively driving its FFO-per-share growth.

We expect compound annual growth of FFO-per-share of approximately 2.7% over the next five years for Realty Income.

Source: Investor Presentation

This growth will be achieved through property acquisitions and rental increases on existing properties. The company invested $1.7 billion during the fourth quarter at an initial weighted average cash yield of 7.1% and achieved a rent recapture rate of 107.4% on re-leased properties.

In 2024, the company invested $3.9 billion at an initial weighted average cash yield of 7.4% and had a rent recapture rate of 105.6% on released properties.

Realty Income expects to increase its investments in international markets moving forward. It made its first deal in the UK in 2019 and plans to do more such deals when it finds attractive targets. Since its first deal in the UK, international markets have added almost 30% to the trust’s sourcing volume.

These acquisitions and expansion overseas will help drive profits in the long run. However, they may not pay off immediately, as the issuance of new shares dilutes shareholders in the near term.

Realty Income’s properties are relatively Amazon-proof, as the REIT owns standalone properties that can be used as cinemas, fitness centers, dollar stores, and more.

Realty Income’s properties are in demand and will likely remain so. At the end of last year, the occupancy rate across the portfolio was 98.7%, and tenants generally report high rent coverage ratios.

Dividend Analysis

Realty Income’s dividend history is second to none in the world of REITs. Since the company came public in 1994, its dividend has been increased over 110 times, and the payout has increased by roughly 4% per year on average.

The dividend is also safe, considering not only this extraordinary history of boosting the payout throughout all types of economic conditions but also because the trust pays out a very reasonable 75% of adjusted FFO.

REITs are required to pay out most of their income in the form of dividends, so Realty Income’s dividend payout ratio will never be low. We see ~80% of FFO as an acceptable payout ratio for a REIT, particularly for one that is growing FFO-per-share very consistently.

That means that even if FFO-per-share were to go flat for some period of time, the dividend would still be sustainable. We expect the payout to continue rising in the mid-single digits annually, as it has for many years.

Realty Income is able to maintain this record not only because its business is fundamentally superior but also because its capital structure is conservative.

Final Thoughts

REITs are favorites among dividend investors because they pay out the vast majority of their earnings to shareholders via dividends, which generally leads to high yields.

Realty Income’s 5.7% current yield is not the highest in the REIT universe, but it is still pretty attractive, especially considering the extremely consistent dividend growth.

For income investors looking for a yield more than twice as high as the yield of the broader market and dividend safety that is not a concern, Realty Income fits the bill. Realty Income is not growing fast, but growth has been consistent.

The combination of a solid dividend yield and expected future dividend increases is attractive.

Don’t miss the resources below for more monthly dividend stock investing research.

And see the resources below for more compelling investment ideas for dividend growth stocks and/or high-yield investment securities.

Thanks for reading this article. Please send any feedback, corrections, or questions to [email protected].


Source link

Horizon Technology Finance (HRZN) | Monthly Dividend Safety Analysis


Updated on March 31st, 2025 by Nathan Parsh

Horizon Technology Finance (HRZN) has a current dividend yield of more than 14%, which makes it extremely attractive at first glance. The S&P 500 Index, on average, offers just a 1.3% dividend yield.

Horizon has a very high dividend yield and makes its payments monthly. It is one of only 75 monthly dividend stocks.

You can download our full Excel spreadsheet of all monthly dividend stocks (along with metrics that matter, like dividend yield and payout ratio) by clicking on the link below:


Horizon’s yield is near the top of the list of monthly dividend stocks, a group that includes many other high-yield securities, such as REITs and other Business Development Companies.

This article will discuss Horizon’s business model and whether it is an appealing stock for income investors.

Business Overview

Horizon Technology Finance is a Business Development Company, or BDC. These are companies that make investments in privately held companies.

Horizon makes its returns via investments in companies through directly originated senior secured loans and, to a smaller extent, capital appreciation potential through warrants.

It provides debt financing to early-stage companies across three industry groups:

  • Life Science (40% of portfolio)
  • Technology (34% of portfolio)
  • Healthcare Information & Services (16% of portfolio)
  • Sustainability (10% of portfolio)

Life science companies primarily include biotechnology, medical devices, and specialty pharmaceuticals.

Technology investments are typically made in cloud computing, wireless communications, cyber security, data analytics and storage, internet, software, and more.

Healthcare information includes diagnostics, medical records, and patient management software providers.

A breakdown of Horizon’s portfolio is as follows:

Source: Investor Presentation

The portfolio is heavily weighted in the life science and technology groups, but even within those groups, industries are highly diversified.

In addition, the company’s portfolio includes a favorable mix of stable and growing companies, respectively, to provide a balance of growth and safety in its lending.

Horizon views prospective investments through a long-term lens. It invests in companies that have growth potential, strong management teams, superior technology, and/or valuable intellectual property.

Growth Prospects

In its fourth-quarter report for 2024, Horizon reported a net investment income (NII) of $10.4 million, or $0.27 per share, which was down from $16 million, or $0.45 per share, in the same period last year. The company’s investment portfolio stood at $697.9 million, with a net asset value of $336.2 million, or $8.43 per share, as of December 31st, 2024. Horizon also highlighted a 14.9% annualized portfolio yield and raised $18.8 million through its at-the-market offering program.

Horizon’s second-quarter operating results included total investment income of $23.5 million, down from $28.2 million in the prior year, primarily due to lower interest income from its debt investment portfolio. Total expenses increased slightly to $12.8 million, driven by higher interest expenses. The company’s net realized loss on investments was $3.2 million compared to a net realized loss of $1.2 million in Q4 2024. However, the quarter saw a net unrealized depreciation of $19.6 million in its investment portfolio, compared to a net unrealized depreciation on investments of $24.3 million last year.

Horizon’s portfolio consisted of 52 secured loans with a total value of $638.8 million, alongside equity and warrant investments in 109 companies valued at $59.1 million. As of the end of the year, the company had $181 million in outstanding principal balance under its $250 million senior secured debt facility, which should bolster its balance sheet and position it for portfolio growth in 2025. With four debt investments classified under its highest-risk rating, Horizon aims to focus on quality investments and maximize its net asset value moving forward.

Management reassured investors of dividend stability going forward by declaring its three forward monthly dividends at a rate of $0.11. Based on Horizon’s current portfolio composition, we forecast net investment income for 2025 at $1.32 per share.

Horizon also has a growing and enormous addressable market.

Source: Investor Presentation

Horizon sees a $31 billion addressable market against its current portfolio. This should provide a wealth of opportunities for Horizon, and it can select the best opportunities in the coming years.

Dividend Analysis

Horizon currently pays a monthly dividend of $0.11 per share. The annualized dividend payout of $1.32 represents a yield of 14%, based on Horizon’s current price. This doesn’t include special dividends, of which the company has distributed $0.05 per share in each of the last five years.

This demonstrates why BDCs are a popular investment for income investors, particularly one that has a yield as high as Horizon.

However, abnormally high dividend payouts can be reduced if the issuing company encounters financial difficulty. That said, Horizon still offers a high yield, which could be very appealing for income investors.

Net investment income for 2025 is expected to reach $1.32 per share, which equates to a payout ratio of 100%. The payout ratio has improved notably since 2020, when the payout ratio exceeded 100% of NII-per-share. This was due to the coronavirus pandemic causing a decline in the portfolio results.

If investment income declines in the future, the dividend would be in danger of a reduction. On the other hand, if the U.S. economy avoids a recession and Horizon continues to see satisfactory investment spreads, the dividend could be maintained and even grow. The last increase occurred for the first payment of 2023.

Related: 3 Reasons Why Companies Cut Their Dividends (With Examples)

The company’s competitive advantage lies in its expertise in identifying the most promising companies in risky sectors, which requires professional knowledge and experience beyond finance. So far, this perk has stood solid, as the company’s results have outperformed the rest of its peers, many of which were forced to cut their distribution due to increased market pressure.

In an optimal scenario, Horizon could continue to pay its distribution of $1.32 annually for the foreseeable future. However, any BDC has an increased risk of cutting its distribution, given that it is required to distribute essentially all of its income. Should Horizon’s financial results deteriorate, a dividend cut is possible, as in 2016.

Final Thoughts

High dividend yields are often a sign of elevated risk. In this case, there is a considerable risk that Horizon’s dividend could be reduced in the future if its investment income deteriorated, which would likely occur in a deep recession.

However, Horizon’s outlook is generally positive. It invests in technology and healthcare, two stable industries with growth potential. The company’s underwriting principles offer high yields and generally safe lending conditions, which support net investment income and, therefore, the dividend.

Horizon could be an attractive high-dividend stock for income investors thanks to its 14% dividend yield, with the acknowledgment that the dividend could be at risk in the event of a business downturn.

Don’t miss the resources below for more monthly dividend stock investing research.

And see the resources below for more compelling investment ideas for dividend growth stocks and/or high-yield investment securities.

Thanks for reading this article. Please send any feedback, corrections, or questions to [email protected].


Source link

How to Storm-Proof Your Portfolio Against a Global Trade War


President Trump is set to announce sweeping reciprocal tariffs against America’s biggest trading partners

After two years of strong performance, the stock market has struggled here in 2025. Paired with economic data that has surprised to the downside, the threat of a global trade war has weighed heavily on Wall Street. 

And it could all come to head just two days from now, on Wednesday, April 2 – what U.S. President Donald Trump is calling “Liberation Day.” 

That’s when Trump is set to announce a set of sweeping reciprocal tariffs against America’s biggest trading partners. And depending on their severity and longevity, they have the potential to fundamentally reshape the global economic landscape. 

Some think the tariffs are simply a negotiating tactic for the U.S. to strong-arm its way into better trading deals. Others think they could remain in place to help grow the nation’s depleted coffers. 

And the truth is that no one really knows

Indeed, as Yahoo Finance’s Ben Werschkul pointed out, “The vastness of possibilities appears to be widening after Trump recently teased that he ‘may give a lot of countries breaks’ and said Sunday night he could be ‘generous’ even as he quickly added that ‘all countries’ could be impacted. A campaign trail idea of blanket 20% across-the-board tariffs also appears to have reemerged as at least an option.”

Even National Economic Council Director Kevin Hassett told Fox News that he couldn’t give “any forward-looking guidance on what’s going to happen this week.”

An overwhelming amount of uncertainty continues… Can’t say we’re surprised. 

However, one thing we know for certain is that these tariffs – regardless of if they have staying power – will create enormous stock market volatility

Just look at what has happened in the last month…

The Trade War Has Weighed on Wall Street

On Feb. 1, 2025, Trump issued executive orders announcing tariffs on Canada, Mexico, and China, to go into effect on Feb. 4. This started the trade war drama that persists today. 

Since then, hardly any of the tariffs he has threatened or issued have stuck around, save a few against China. Still, the markets have tumbled. 

The S&P 500 dropped more than 10% from the middle of February to the middle of March. The Nasdaq fell almost 15%, and the Russell 2000 crashed nearly 20%. Collectively, the “Magnificent 7” tech stocks dropped more than 20%. 

Tariff uncertainty alone has created massive market volatility. 

The uncertainty could intensify this week on April 2, when Trump enforces even more – potentially even larger – tariffs. 

And if this trade war drama persists beyond that day, the market will keep reacting violently. 

Huge crashes when tariffs are announced; huge rebound rallies when they’re paused. Another big selloff when more tariffs come, then another big rebound when those tariffs are delayed…

Lather. Rinse. Repeat. 


Source link

Crypto Watchlist — DexBoss & AurealOne Set for Explosive Growth?


Introduction: Crypto Pre-Sales and Early Investment Opportunities

Crypto pre-sales allow investors to obtain tokens through early acquisition moments before their public release into the market, alongside special benefits, allowing investors to gain access to the next big cryptocurrencies before their price increases.

AurealOne and DexBoss are attracting notice because they could become the next big crypto coins by transforming gaming systems and decentralized financial operations.

DexBoss: Simplifying DeFi and Expanding Financial Access

Overview

DexBoss operates as a DeFi platform which creates a connection between conventional finance systems and blockchain solutions. Quick and easy access to DeFi trading through DexBoss enables users at every skill level to acquire liquidity solutions.

Key Features That Set DexBoss Apart

  1. User-Friendly Interface
    The user-friendly design of DexBoss makes it simple for all users, including beginners, to operate its features without complexity.
     
  2. Advanced Trading and Liquidity Solutions
    Users can achieve maximum returns through the combination of deep liquidity pools and stake-to-earn features as well as margin trading provided by DexBoss in the DeFi ecosystem.
     
  3. Real-Time Trade Execution
    Instant order execution through this platform helps users avoid missing profitable opportunities that happen quickly in the crypto market.
     
  4. $DEBO Token: Driving the DexBoss Ecosystem
    The DexBoss platform operates with the $DEBO token which enables transaction operations and governance procedures. The 17-stage pre-sale initiates at $0.01 and progresses to $0.0505 while seeking to gather $50 million.
     
  5. Tokenomics and Long-Term Growth
    • Buyback and Burn Mechanisms: The features work to control the token supply resulting in an increase of $DEBO’s value during the period.
    • Transaction Fees: Some of the fees collected by the platform are used for buybacks, which provide long-term benefits to those holding the tokens.

DexBoss positions itself as a good crypto to invest in by providing a reliable scalable solution for decentralized finance infrastructure.

AurealOne: Revolutionizing Blockchain Gaming and the Metaverse

Overview

The AurealOne blockchain features game-oriented technologies that combine metaverse solutions with speed-based, affordable transaction processing. The platform focuses on developers and gamers to establish itself as the next big crypto through digital interaction advancement.

Key Features Powering AurealOne’s Growth

  1. Fast and Scalable Transactions
    AurealOne implements Zero-Knowledge Rollups to provide gamers instant transaction speed with minimum costs which represent vital attributes for gaming platforms.
     
  2. Community-Driven Ecosystem
    Staking DLUME tokens through the platform allows investors to generate passive revenue while participating in governance choices that develop the system.
     
  3. Pre-Sale Investment Potential
    A twenty-one-stage pre-sale promo began with $0.0005 tokens per unit and then rose to $0.0045 before the public start date at $0.0055. Early market participants have a chance to invest in the $50 million total funding target as it represents a crypto coin that rewards early entry.
     
  4. First Game Launch: Clash of Tiles
    The first game produced by AurealOne demonstrates how effective its platform can be through Clash of Tiles. Future game releases under the name DarkLume demonstrate the executive position of this platform in blockchain gaming.
     
  5. Security and Transparency
    Users can monitor their balances effortlessly through the platform which provides specialized assistance for security and issue resolution.

Tokenomics: A Structured Approach to Growth

  • Total Supply: A proper distribution pattern enables sustainable adoption along with long-term growth.
     
  • Pre-Sale Rounds: During the token distribution process 1 billion tokens will be given out in 20 rounds before finally distributing 500 million tokens in the concluding stage.

AurealOne establishes future metaverse integration and gaming blockchain solutions which establish it as a good crypto to invest in for long-term value seekers.

Why AurealOne and DexBoss Could Be the Next Crypto to Hit One Dollar

Both AurealOne and DexBoss exhibit the potential to reach $1 as new promising cryptos because of their solid ecosystems, robust use cases and community-based development approach.

The combination of simplified DeFi trading with advanced financial tools in DexBoss creates attractiveness towards a wide customer base. Descending DeFi adoption rates will cause users to pursue trading systems that simplify and boost efficiency across DeFi platforms. The pre-sale structure of $DEBO, coupled with increasing investor support, makes reaching the $1 milestone a feasible prospect because of its expanding user base.

The blockchain gaming market positions AurealOne as a top project because of its leading position here. AurealOne might achieve a top position among metaverse gaming platforms by helping gaming companies utilize blockchain technology. The combination of investing incentives for DLUME tokens, along with governance capabilities and gaming functions, creates an entire ecosystem that offers benefits for both token holders and gamers who participate in the long run. Widespread adoption of games on the platform combined with an increasing user base could steadily drive DLUME towards $1 value throughout time.

Conclusion

Two upcoming projects that may define gaming and decentralized finance developments are AurealOne and DexBoss. The present-day best cryptocurrency investments are fueled by their successful pre-sale activity combined with their innovative technology and active community involvement. These token platforms show promise to soon reach levels of pre-established crypto projects such as XRP Ripple

Nevertheless, the crypto landscape is volatile and investors must be aware of possible risks before investing in cryptocurrencies.

Disclaimer: The views and opinions presented in this article do not necessarily reflect the views of CoinCheckup. The content of this article should not be considered as investment advice. Always do your own research before deciding to buy, sell or transfer any crypto assets. Past returns do not always guarantee future profits.


Source link

Monthly Dividend Stock In Focus: Fortitude Gold Corporation


Updated on March 31st, 2025 by Nathan Parsh

Monthly dividend stocks are great candidates for income-oriented investors’ portfolios. They distribute their dividends monthly and offer a smoother income stream.

In addition, many of these stocks are laser-focused on maximizing their distributions to their shareholders.

You can download our full Excel spreadsheet of all monthly dividend stocks (along with metrics that matter like dividend yields and payout ratios) by clicking on the link below:


In this article, we will analyze the prospects of Fortitude Gold Corporation (FTCO), a high-quality monthly dividend stock.

Business Overview

Fortitude Gold is a U.S.-based gold producer that generates ~95% of its revenue from gold and targets projects with low operating costs, high returns on capital, and wide margins.

The company targets high-grade gold open pit heap leach operations averaging one gram per tonne of gold or greater. Its property portfolio currently consists of 100% ownership in seven high-grade gold properties.

All seven properties are within an approximate 30-mile radius of one another within the prolific Walker Lane Mineral Belt. The company generated over $37 million in revenues last year, most of which were from gold.

Source: Investor Presentation

On February 25th, 2025, Fortitude Gold posted its Q4 results for the period ending December 31st, 2024. Revenue for the year was $37.3 million, 49% lower than last year.

The revenue decline was driven by a 58% drop in the number of ounces of gold sold. Silver sales volumes fell 22%, even as prices increased 18% to $27.56 per ounce.

As Fortitude Gold generates essentially all of its revenue from gold, it is obviously highly sensitive to the cycles of the price of gold. The average price of gold increased 22% year-over-year to $2,371 per ounce, down slightly from an all-time high of $2,500 per ounce.

Moving to the bottom line, the company recorded a mine gross profit of $18.3 million compared to $41.2 million in 2023 due to lower net sales.

Therefore, the company reported a net loss of $2 million versus a net income of $17 million in 2023. On a per-share basis, net loss was $0.08 compared to net income of $0.71 for the prior period.

We believe the company’s EPS power potential is about $0.60 for 2025. However, EPS in FY2024 could be lower at $0.48.

Growth Prospects

Fortitude Gold’s outlook has been clouded as it awaits regulatory agency permits to mine deeper in the Isabella Pearl deposit.

Additionally, the company is still awaiting permit approval to build its second mine, its County Line project.

Source: Investor Presentation

Therefore, FTCO stock is a high-risk, high-reward situation. On one hand, rising gold prices and improved operating processes can significantly enhance the company’s financial performance amid higher profit margins.

On the other hand, declining gold prices and rising expenses, could negatively affect profitability. Furthermore, high gold prices weren’t enough to help the company turn a profit in 2023.

On the bright side, inflation has persisted, and with the Federal Reserve unlikely to lower interest rates in the near-term, gold prices are likely to remain high.

This bodes well for the price of gold, and by extension FTCO, for the foreseeable future.

Competitive Advantages & Recession Performance

Gold producers are infamous for their cyclicality, which is caused by the wild swings in the price of gold. Fortitude Gold is inevitably vulnerable to these cycles,but it is an above-average gold producer thanks to some key characteristics.

Its properties also feature exceptionally high-ore grade and near-surface deposits, resulting in low-cost operations relative to its peers.

Additionally, the balance sheet is pristine, with $122.1 million in total assets against just $14 million in total liabilities, resulting in a strong equity value of $108.1 million.

Moreover, Fortitude Gold enjoys another key competitive advantage: namely, the exceptional grade of Isabella Pearl Mine.

As a result, Fortitude Gold is much more profitable than most of its peers at a given gold price and is one of the most resilient gold producers to price downturns.

It is also worth noting that the price of gold often rises during recessions, as the precious metal is considered a safe haven during selloffs of the stock market. This means that Fortitude Gold is likely to perform well during recessions.

Dividend Analysis

Income investors should avoid gold stocks in principle due to the high cyclicality that results from the swings of the price of gold. It is not accidental that there are no gold producers in the list of Dividend Aristocrats.

On the other hand, Fortitude Gold has some attractive features for dividend investors. It offers a monthly dividend of $0.04, corresponding to an annualized dividend yield of 9.8%. This is the highest dividend yield in the group of precious metals producers.

In addition, Fortitude Gold’s expected payout ratio for the year is 80%, which is not ideal but reasonable given the asset’s high quality.

Furthermore, the gold producer’s healthy balance sheet means that the dividend is likely to remain safe for the foreseeable future.

Conversely, investors should always be aware of commodity producers’ vulnerability to commodity cycles.

If the price of gold enters a prolonged downturn at some point in the future, Fortitude Gold’s dividend is likely to come under pressure. Gold producers need to spend significant amounts on capital expenses to replenish their reserves.

Final Thoughts

Gold producers are highly cyclical and should, therefore, be avoided by most income investors, who cannot stomach a volatile stock price and a potential dividend cut.

While Fortitude Gold is highly sensitive to the cycles of the gold price, it has some unique advantages. Its strong balance sheet makes it much easier to endure the downturns of this business.

The stock also offers the highest dividend yield in its peer group and pays its dividend monthly. Therefore, it is an appealing (albeit risky) stock for income investors who want to gain exposure to gold.

Don’t miss the resources below for more monthly dividend stock investing research.

And see the resources below for more compelling investment ideas for dividend growth stocks and/or high-yield investment securities.

Thanks for reading this article. Please send any feedback, corrections, or questions to [email protected].


Source link

This Short-Term Market Anomaly Presents a Hidden Opportunity


Hello, Reader.

Life can be filled with anomalies.

A white puppy is born into a litter of brown siblings. Snowfall blankets the Florida Panhandle. That one Monday when Garfield was happy.

Anomalies happen in the stock market, too.

As it happens, a short-term anomaly has developed in the natural gas market: Gas prices are rising, but natural gas stocks are falling. The chart below tells the tale.

Tumbling crude oil prices probably deserve most of the blame for causing this rare divergence.

For starters, falling crude prices cast a pall over the entire fossil fuel sector. In addition, most major natural gas producers also produce significant volumes of crude oil.

As a result, the shares of almost every North American natural gas producer have been sliding lower, no matter how little crude each company produces.

The First Trust Natural Gas ETF (FCG) is a perfect case-in-point. Its price has gone nowhere during the last two months, even though the natural gas price has jumped around 35% over that brief time frame.

Sooner or later, natural gas stocks should begin to reflect the strong pricing in the natural gas market and the bullish trends underway there. U.S. natural gas in storage, relative to seasonal three-year average levels, has been dropping sharply for nearly a year.

The most recent reading showed storage levels 14% below average levels for this time of year.

Against this backdrop, U.S. natural gas demand is on track to surpass supply by a wide margin over the next two years, which should reduce stockpiles even further below three-year average levels.

Our nation’s rapidly growing LNG (liquified natural gas) export capacity will account for most of the demand growth. The U.S. became the world’s biggest LNG supplier in 2023, surpassing Australia and Qatar.

In February, the amount of gas flowing to the eight big U.S. LNG export plants rose to a record-high 15.6 Bcf/d (billion cubic feet per day), as new units at Venture Global’s 3.2-Bcf/d Plaquemines LNG export plant in Louisiana entered service.

So far this month, LNG export volumes are even higher.

Looking down the road, the U.S. Energy Information Administration (EIA) predicts LNG exports will grow by 2.1 Bcf/d and an additional 2.1 Bcf/d in 2026, due to new export facilities that will begin operating during that time frame. Assuming this LNG demand materializes as the EIA expects, it would account for a whopping 72% of the entire country’s expected demand growth in 2025 and 2026.

Unlike domestic demand spikes that occur during exceptionally cold winters or hot summers, LNG export demand is relatively constant. Once in place, it remains in place and continues to consume domestic gas supplies, no matter what national weather conditions might be.

As such, this source of demand puts continuous upward pressure on natural gas prices, especially if domestic gas production fails to keep pace.

The EIA is predicting that exact scenario. Although the agency expects domestic production to increase by 3.6% during the next two years, that figure is well below the 5.8% demand growth the agency predicts.

This widening supply-demand imbalance would reduce U.S. gas inventories, which would be unequivocally bullish for natural gas prices.

My newest Fry’s Investment Report play on natural gas is already reaping rewards from improving natural gas prices in the Permian Basin of West Texas… although the company’s still-depressed share price does not reflect that potential.

At less than eight times earnings, its share price seems substantially undervalued, relative to both its peer group and to its “hidden” earnings potential from its holdings in the Delaware Basin chunk of the Permian.

But all that means is that this company currently offers a great buying opportunity.

Bottom line: U.S. natural gas is “Buy,” which means this natural gas play is a “Strong Buy.”

For more, click here to learn more about becoming a Fry’s Investment Report member today.

Now, let’s look at what we covered here at Smart Money this past week…

Smart Money Roundup

This ‘AI Divide’ Creates a Once-In-a-Generation Opportunity – Which Side Will You Land On?

The tech world is splitting in two due to AI, creating stark contrasts between those who adapt and those left behind. While execs pop Champagne as AI turbocharges stocks and mints new fortunes, others watch their careers vaporize overnight. Read on as Luke Lango digs deeper into how exactly artificial intelligence is widening the gulf between the haves and the have nots.

The Biggest Wealth Shift of Our Lives Is Coming – Here’s How to Prepare

As AI transforms industries, a stark divide emerges between adaptive and stagnant companies. Drawing parallels to past technological disruptions, businesses are leveraging AI to dramatically reduce workforce while increasing efficiency. Louis Navellier is here to share why this shift is happening, and how to prepare for it.

The 5-Letter Word Every Investor Should Memorize to Win in 2025

Investors are feeling frustrated, with bearish sentiment shooting up and many tech stocks taking a beating. But the broader stock market paints a different picture: A quiet shift is happening as forgotten value stocks start to steal the spotlight. Tom Yeung explains why market uncertainty is reshaping investment strategies.

Bill Gates Says You Might Be Obsolete Soon – Here’s What to Do About It

Spring cleaning forces us to confront obsolete tech – those dusty drawers filled with ancient phone chargers and forgotten gadgets. Bill Gates warns us humans might join this obsolete list, predicting AI will soon handle things like medical advice and tutoring without us. In this issue, I’ll take a look at the rise of physical AI and how one company is leading the charge.

The stock market currently resembles Disney’s Tower of Terror ride – a seemingly endless plummet that’s actually shorter than it feels. Recent market volatility, triggered by tariff tensons, has investors experiencing stomach-dropping fear despite limited actual losses. Learn more about the five steps Louis Navellier wants you to take to protect your portfolio.

Looking Ahead

While I have my eye on the natural gas market, I am also keeping my focus on the biggest trend of our time: artificial intelligence.

AI has been the biggest wealth driver in the stock market over the last two years, minting over 500,000 new millionaires.

But for all its promise, AI also has a dark side – one that could shock the financial system. 

My InvestorPlace colleagues Louis Navellier and Luke Lango and I have been talking a lot about the “Technochasm,” a phenomenon I’ve been tracking for the past five years. It refers to the deep divide that technology is creating within the market and society.

On one side of the gap are the companies (and investors) who leverage rapid technological innovation. On the other: investors and businesses that get caught off guard and fall behind.

Well, AI has come along and lit a match under the Technochasm. And this divide is now nearing the point of being uncrossable.

That is why I recently held an important broadcast with Louis and Luke to explain exactly how this massive capital shift will create the next generation of tech millionaires – and leave millions of others behind.

If you want to learn more about this opportunity – and the six stocks at the center of it – click here to access the free replay.

Regards,

Eric Fry


Source link