Archives April 2025

Stocks Haven’t Been Pricing in a U.S. Recession, Says Deutsche Bank


Key Takeaways

  • Investors aren’t currently pricing in a U.S. recession, according to a recent Deutsche Bank analysis comparing recent activity in stock, bond, and oil markets with past recessions.
  • The market’s resilience up to now leaves room for asset prices to fall further if a recession does materialize.
  • Stocks have been buoyed by signs the Trump administration is considering de-escalating its trade war with China.

Analysts say the risk of a U.S. recession has increased this year, but investors are hoping America can weather the storm of President Donald Trump’s tariffs. 

Stock, bond, and oil markets have all been battered by tariff uncertainty, but they’re still in better shape than during recent recessions, according to Deutsche Bank analyst Henry Allen. “So markets clearly don’t see a recession as inevitable, particularly if the tariffs don’t come into force after the latest 90-day extension,” wrote Allen in a note on Wednesday.

When stocks sold off in the wake of Trump’s “Liberation Day” tariff announcement, the S&P 500 declined as much as 18.9%. It was one of the sharpest pullbacks in decades, but it was shallower than the declines that preceded each of America’s five most recent recessions

Credit spreads have widened, but, as with stocks, not as dramatically as in recent recessions. High yield spreads were at 397 basis points (bps) as of Wednesday morning, well below the 1,100 bps registered during COVID-19 and the 1,971 bps seen during the global financial crisis. Spreads, Allen notes, haven’t even reached levels from non-recessionary periods of market stress, like 2022 (583 bps) and 2016 (839 bps). 

Similarly, oil prices haven’t fallen as much as in recent recessions. Brent crude futures contracts had retreated about 13% since “Liberation Day” (April 2), a significant drop but far from the two-thirds declines during COVID-19 and the financial crisis. The relatively modest drop “suggests that investors aren’t anticipating a huge slowdown for global growth just yet,” says Allen.

Unfortunately for investors, the market’s current resilience could bite them down the line. “With markets not fully pricing in a recession, that opens significant downside risks if we do get one,” says Allen.

Recession risks could be lowered by improved U.S.-China relations, which appeared plausible on Wednesday after Trump said Tuesday that he expected China’s final tariffs to be far lower than the current rate of 145%. The Wall Street Journal on Wednesday reported officials are contemplating slashing the rate on Chinese imports to between 50% and 65%. 

Stocks have rallied on the hope of de-escalation, but several economists have warned that even lowered tariffs increase the risk of a slowdown. Trump has also abruptly changed plans in the past, leaving economists uncertain if warmer relations would last. 

“The hard data over the coming days will be crucial,” said Allen. “Investors have been reluctant to fully price in a recession because we don’t have enough evidence that one is likely. But if that changes and we start to see contractionary numbers (e.g., a negative payrolls print), that would lead to a fresh reassessment that could open the way for a fresh selloff.”


Source link

Job Cuts—And Less Hybrid Work—Are Coming to Intel, CEO Says


Another big American employer expects to see more of its people around the office—and fewer people in total.

New Intel (INTC) CEO Lip-Bu Tan late Thursday said in a letter to employees—and published online—that hybrid employees should be on-site at least four days a week by Sept. 1, up from a policy of “approximately three,” to which he said people had been “uneven” in adhering.

“I strongly believe that our sites need to be vibrant hubs of collaboration that reflect our culture in action,” Tan’s letter read. It echoed statements from a swath of big American companies that have been rolling back hybrid- and remote-work programs established during the pandemic, with Amazon (AMZN) just one notable example.

The letter was published alongside quarterly financial results that included a downbeat forecast. It discussed other changes, including a “flatter management structure,” a rethinking of the size and number of meetings, and an effort to shed bureaucracy. And while it stopped short of announcing the layoffs that had been reported in recent days, it made clear that they were coming.

“There is no way around the fact that these critical changes will reduce the size of our workforce,” Tan wrote. “As I said when I joined, we need to make some very hard decisions to put our company on a solid footing for the future.”

That process, he said, will start in the second quarter. “We will move as quickly as possible over the next several months,” Tan wrote.

Intel had more than 100,000 employees worldwide as of the end of last year, according to its annual report.


Source link

Another Bitcoin Treasury Is Coming To Wall Street


Key Takeaways

  • Shares of Cantor Equity Partners—a blank check company headed by the son of President Trump’s commerce secretary—continued to soar after announcing plans on Wednesday to form the world’s third-largest corporate Bitcoin treasury.
  • Cantor will merge with Twenty One, which will own 42,000 bitcoin and be majority-owned by stablecoin issuer Tether and its affiliated exchange Bitfinex.
  • Twenty One follows in the footsteps of Michael Saylor’s Strategy, the world’s largest corporate holder of Bitcoin.

Wall Street’s getting a new Bitcoin treasury.

Shares of Cantor Equity Partners (CEP)—a blank check company headed by Brandon Lutnick, son of President Trump’s commerce secretary—soared 50% on Thursday, a day after it announced a deal to take “Bitcoin-native” Twenty One, “a newly formed entity,” public via SPAC merger. The stock has risen more than 200% since Wednesday’s announcement.

Twenty One is expected to go public with more than 42,000 bitcoin, the third-largest corporate bitcoin treasury in the world. The company will be majority-owned by stablecoin issuer Tether and its affiliated exchange Bitfinex, which are supplying 31,500 bitcoin. Investment holding company SoftBank has agreed to purchase some of Tether’s shares to take “significant minority ownership.”

In a pitch to private investors, the company said it would “leverage its Bitcoin to generate returns for shareholders and benefit from Bitcoin’s potential for price appreciation.”

The Trump administration was one element of the company’s pitch. In March, Trump ordered the creation of a bitcoin reserve and has advocated for Congress and federal agencies to develop a regulatory framework for cryptocurrencies.

Twenty One follows in the footsteps of Michael Saylor’s Strategy (MSTR), formerly MicroStrategy, which in recent years has morphed from a company that makes software to a company that issues stock to collect Bitcoin. Beyond accumulating Bitcoin, Twenty One says it plans “to accelerate Bitcoin adoption” at the corporate and sovereign level through media operations and develop “Bitcoin-related financial and advisory services.”

The company will be led by Jack Mallers, the founder and CEO of Strike, a payments platform. Mallers, the company said, is “one of Bitcoin’s most influential advocates” and “was instrumental” in El Salvador’s decision to become the first country to recognize Bitcoin as fiat currency


Source link

Easing trade war, rate cut hopes – United States


Written by the Market Insights Team

From chaos to calm

George Vessey – Lead FX & Macro Strategist

It’s been yet another topsy turvy week in financial markets, but Thursday marked a third consecutive day of risk-on trading, fuelled by dovish remarks from Fed officials and a de-escalation in Trump’s trade war. Cross-asset price movements suggested a more stable and lasting improvement in market sentiment, contrasting with the sharp, short-covering-driven rallies seen earlier in the week.

Cleveland Fed President Beth Hammack got things rolling yesterday, noting the Fed could cut rates as early as June if it has clear evidence of the economy’s direction. And that sentiment was later echoed by Governor Christopher Waller who said he’d support rate cuts if there’s a significant rise in unemployment. And in the last few hours, in a notable development, Bloomberg reported that China is considering suspending its 125% tariff on certain US imports, signalling a potential easing in trade tensions.

The S&P 500 index was able to exit correction territory, ending at least 10% above its recent low set in the wake of Trump’s April 2 “liberation day” tariffs. In the FX space, US dollar demand is picking up, whilst traditional safe havens like the yen, euro, and Swiss franc have weakened, the latter down more than 1% this week.

Recent events also underscore the bond market’s influence on President Trump’s decisions. After sharp increases in long-term yields caused market unease, Trump suspended most tariffs for 90 days. Similarly, following another yield spike after his remarks on Fed Chair Powell, he clarified he had no plans to fire Powell. These reactions suggest that significant yield rises on the long end will likely prompt mitigating actions to stabilize markets.

Chart of Fed cut probability in H1

Euro quelled by risk-on mood

George Vessey – Lead FX & Macro Strategist

Despite the modest relief rally for the dollar in the wake of recent news, the $1.13 mark remains a key short-term support for EUR/USD for now. A decisive break could open the door for a bigger leg lower with the 21-day moving average, at $1.1136, another important level to decipher the short-term trend. But despite the potential for an extended pullback, longer term dynamics appear favourable with options traders betting on lasting euro strength, pointing to a structural shift in market dynamics.

In the macro space, data yesterday showed Germany’s Ifo index improved slightly to 86.9 in April from 86.7 in March, driven by stronger current assessments, though business expectations weakened. Despite the mild positive surprise, US tariffs and geopolitical shifts pose significant risks. Confidence indicators suggest the German economy has bottomed out but will likely face delays in recovery due to tariff impacts and structural challenges. Fiscal stimulus promises long-term growth but lacks immediate implementation plans, while government tensions over spending could limit its effectiveness. Broader uncertainties, including Ukraine negotiations and shifts in US-China trade policies, add to the economic outlook’s complexity.

Meanwhile, traders have added to European Central Bank (ECB) rate-cut wagers following dovish comments from officials. Markets are currently pricing a 50% probability of another two more rate cuts over the next two ECB meetings, which is another factor capping euro upside for now.

Chart of German Ifo index

Brits bask in sunshine boom

George Vessey – Lead FX & Macro Strategist

Retail sales in the UK rose by 0.4% m/m in March 2025, defying forecasts of a 0.4% decline and follows a revised 0.7% gain in February. Exceptional March sunshine drove retail sales higher for the third consecutive month, achieving the best streak in sales growth since early 2021, when the economy recovered from Covid lockdowns. However, Trump’s tariffs in April have dented consumer confidence to its lowest level since November 2023.

The British pound has largely shrugged off the upbeat retail sales data though given its lagging nature and the huge developments we’ve seen unfold on a global scale this month. Still, GBP/EUR finds itself atop the €1.17 handle and further improvements in risk sentiment should asymmetrically help the pound relative to the euro, which dropped to a 17-month low earlier this month. But uncertainty remains elevated and a downside bias intact as long as GBP/EUR stays below its 21-day moving average at €1.1743.

As for GBP/USD, the pair has dipped under $1.33 again this morning, marginally lower on the week, but still around 3% up on the month so far. Rate differentials suggest the pound is overvalued by over 1% but options traders are still bullish GBP versus USD over the next three months. On a more cautious note, the last time the pair marched above $1.34 back in September last year, a 9% drop over four months unfolded.

Chart of UK retail sales and consumer confidence

Euro erases weekly gains

Table: 7-day currency trends and trading ranges

Table of FX rates

Key global risk events

Calendar: April 21-25

Table of risk events

All times are in BST

Have a question? [email protected]

*The FX rates published are provided by Convera’s Market Insights team for research purposes only. The rates have a unique source and may not align to any live exchange rates quoted on other sites. They are not an indication of actual buy/sell rates, or a financial offer.


Source link

Does All This Inflation Talk Mean I Bond Rates Will Jump on May 1?


Key Takeaways

  • I bonds are a specific type of U.S. Treasury savings bond that pays a variable rate designed to always outpace inflation.
  • To accomplish this, I bond rates are adjusted every six months based on the last half year’s inflation trend. When inflation rises, the I bond rate increases, and vice versa.
  • The next I bond rate announcement will be made May 1.
  • Because of President Donald Trump’s tariff policy, many economists are predicting that inflation will rise in the future.
  • If that happens, it will push I bond rates higher. But it may not happen as quickly as you think.

The full article continues below these offers from our partners.

How I Bonds Are Designed to Always Beat Inflation

U.S. Treasury I bonds are so-named because they are specifically designed to pay more on your cash than inflation eats away from your buying power. You generally won’t earn a huge return, but you’ll always stay a step ahead of the latest inflation trend.

I bonds accomplish this by having a variable interest rate, allowing the Treasury to adjust its rate over time as inflation changes. But while U.S. inflation is measured and reported monthly, I bonds simplify things by adjusting their rate just twice a year, taking into account the inflation trend of the previous six months. A new rate is calculated and announced every May 1 and Nov. 1.

The next I bond rate announcement is coming up next week, alongside much talk in the news about how President Trump’s across-the-globe tariff policy could push inflation rates back up after they’ve recently been drifting lower. So, does this likely upward pressure on consumer prices suggest a higher I bond rate will be announced on May 1?

Here’s why the answer is both yes and no. (Spoiler: It’s all in the timing.)

What’s Expected for I Bond Rates on May 1—and Beyond

Two weeks ago, we reported Investopedia’s calculations for the next I bond rate—which were possible for existing I bonds when the latest Consumer Price Index (CPI) reading was released on April 10. The answer is that I bond rates will climb almost a full percentage point on May 1, and the rates different bonds will earn—based on their issue date—is shown in the table below.

But those increases aren’t tied to any inflation that might result from the new tariffs. That’s because I bond rates are calculated using the past six months’ worth of inflation data. The April CPI report shows the final month of data for the calculation, and it indicates March inflation numbers. President Trump didn’t put tariffs into effect until April 2, however.

So bond rates are increasing on May 1, but only because of inflation readings from October 2024 through March 2025. They will not rise next week because of tariff activity.

That said, tariffs could certainly trigger a future I bond rate increase if they cause inflation to tick higher over the next few months. However, the soonest we would see that impact is the Nov. 1 rate announcement. And whether the November rate will be higher or lower than the May rate is impossible to predict, as six months of future inflation readings are never easy to forecast.

Add to this that the current environment, with on-again, off-again tariffs, is highly uncertain, and it’s anybody’s guess what the full six-month inflation trend will be from April through October of this year.

Important

Not everyone will start earning their new rate right away on May 1, since each bond’s six-month adjustment cycle is pegged to its issue date. For instance, if you bought your bond in February, your rate will change in August and then again the next February. So in this case, you won’t start earning the May 1 rate until August 1. To see the starting months for every bond date, see our article that calculates the next I bond rates.

How Much Will a Newly Purchased I Bond Pay?

Any new I bond purchased in May could pay a different rate than an I bond purchased in April. That’s because in addition to an inflation-adjusting component, each I bond has a permanent fixed-rate component. The Treasury doesn’t share how it calculates this, so we cannot predict what it will announce as the fixed-rate component for bonds issued on or after May 1.

There is certainly a chance, however, that it will decline from the current 1.20% level. If you’d like to ensure you’ve locked in that 1.20% fixed rate (which means your I bond will always out-pay the inflation trend by 1.2 percentage points), you can still secure it by purchasing a new I bond before April 30. Note, however, that you’ll need to start the transaction a couple of days ahead of that to make sure the purchase occurs in April.

Alternatives to I Bonds

Instead of—or in addition to—I bonds, you may want to put some of your savings in a top-paying CD, or even a high-yield savings account. Though they won’t adjust to beat inflation like an I bond will, their rates are very competitive right now and beat the current 2.4% inflation rate. We rank the top rates for these products every business day, and you can find our latest rankings in the links below.

Daily Rankings of the Best CDs and Savings Accounts

We update these rankings every business day to give you the best deposit rates available:

Important

Note that the “top rates” quoted here are the highest nationally available rates Investopedia has identified in its daily rate research on hundreds of banks and credit unions. This is much different than the national average, which includes all banks offering a CD with that term, including many large banks that pay a pittance in interest. Thus, the national averages are always quite low, while the top rates you can unearth by shopping around are often 5, 10, or even 15 times higher.

How We Find the Best Savings and CD Rates

Every business day, Investopedia tracks the rate data of more than 200 banks and credit unions that offer CDs and savings accounts to customers nationwide and determines daily rankings of the top-paying accounts. To qualify for our lists, the institution must be federally insured (FDIC for banks, NCUA for credit unions), and the account’s minimum initial deposit must not exceed $25,000. It also cannot specify a maximum deposit amount that’s below $5,000.

Banks must be available in at least 40 states to qualify as nationally available. And while some credit unions require you to donate to a specific charity or association to become a member if you don’t meet other eligibility criteria (e.g., you don’t live in a certain area or work in a certain kind of job), we exclude credit unions whose donation requirement is $40 or more. For more about how we choose the best rates, read our full methodology.


Source link

Watch These Intel Price Levels as Chipmaker’s Stock Tumbles on Soft Outlook


Key Takeaways

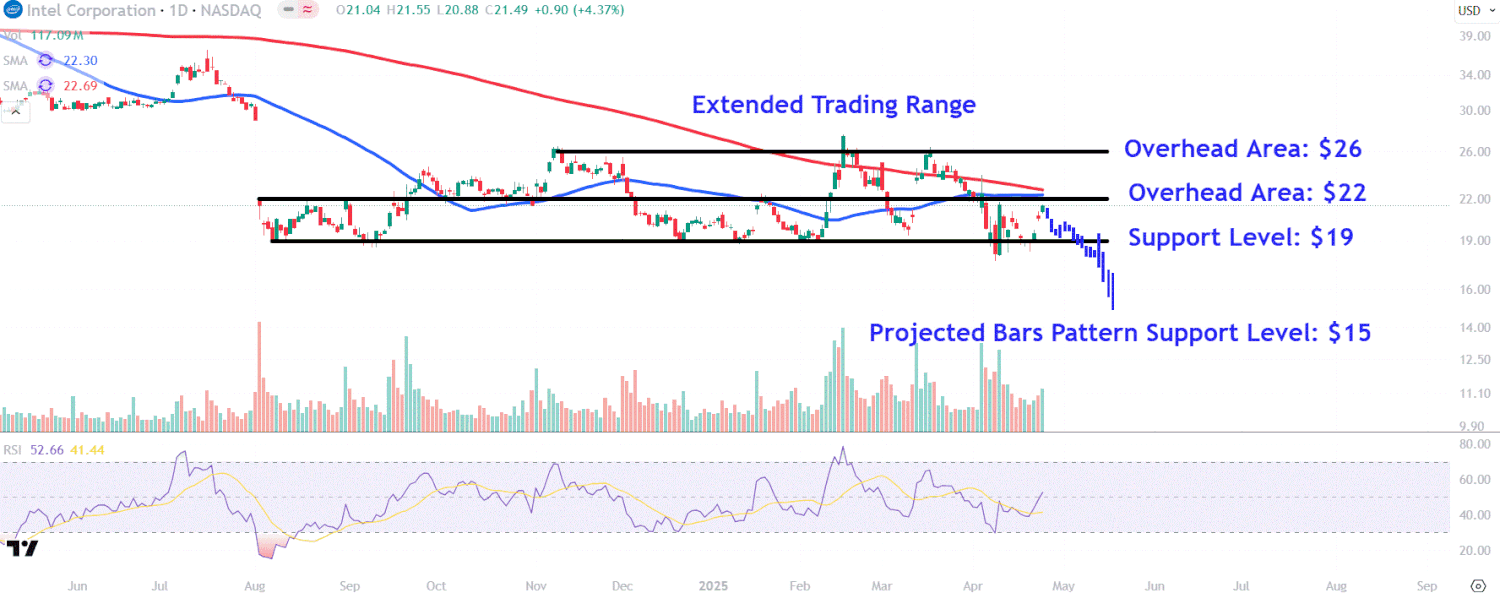
  • Intel shares dropped 5% in extended trading on Thursday after the chipmaker posted a quarterly outlook that fell short of Wall Street expectations.
  • Since gapping sharply lower last August, the stock has drifted sideways in an extended trading range, helping to establish identifiable trading levels.
  • Investors should watch major support levels on Intel’s chart around $19 and $15, while also monitoring vital overhead areas near $22 and $26.

Intel (INTC) shares slumped in extended trading on Thursday after the chipmaker posted a quarterly outlook that fell short of Wall Street expectations.

The chipmaker said uncertainty surrounding the Trump administration’s tariff policies had led customers to stockpile chips in the first quarter, which it expects will weigh on current quarter revenue as a result. Newly installed CEO Lip-Bu Tan cautioned that it would take the company time to gain market share and drive sustainable growth. 

Intel shares have outperformed the S&P 500 since the start of the year amid hopes of a turnaround under Lip-Bu Tan’s leadership. However, the stock is down about 37% over the past 12 months amid worries about the company’s strategic direction and its inability to make inroads into the booming AI chip market.

Intel shares, which gained more than 4% during Thursday’s regular session, fell 5.1% to $20.39 in after-hours trading.

Below, we take a closer look at Intel’s chart and apply technical analysis to identify major price levels that investors will likely be watching.

Extended Trading Range Remains in Play

Since gapping sharply lower last August, Intel shares have drifted sideways in an extended trading range, helping to establish identifiable trading levels.

More recently, an upswing in the stock, which coincided with the relative strength index (RSI) reclaiming the 50 threshold, looks set to end abruptly on Friday following the chipmaker’s uninspiring earnings report.

Let’s identify lower price levels on Intel’s chart that could provide support and also point out two key overhead areas that may attract interest during future upswings.

Major Support Levels to Watch

Amid projected post-earnings weakness in the stock, investors should initially watch a major level of support at $19. This area on the chart would likely attract considerable buying interest near the extended trading range’s lower trendline.

A breakdown below this key technical area could see the shares trend lower toward $15. We projected this level by taking the price bars comprising the stock’s decline from late March to early April and overlaying them from Thursday’s high. This analysis projects that three down trending legs may potentially be playing out on the chart.

Key Overhead Areas to Monitor

During an upswing in the stock, it’s worth keeping track of the $22 area, which sits roughly at the midway point of the extended trading range. The shares could run into overhead selling pressure in this location near the 50-day and 200-day moving averages and a trendline that connects multiple peaks and troughs on the chart stretching back to early August last year.

Finally, a broader recovery could see Intel shares revisit the extended trading range’s upper trendline around $26. Investors who have accumulated the stock at lower levels may decide to book profits in this region near three notable peaks that formed on the chart between November and March.

The comments, opinions, and analyses expressed on Investopedia are for informational purposes only. Read our warranty and liability disclaimer for more info.

As of the date this article was written, the author does not own any of the above securities.


Source link

Intel Stock Tumbles as Chipmaker’s Quarterly Forecast Disappoints


Intel (INTC) issued a quarterly outlook that fell short of analysts’ expectations, sending shares lower in extended trading Thursday.

The chipmaker projected second-quarter revenue of $11.2 billion to $12.4 billion, well below the analyst consensus compiled by Visible Alpha. Intel’s projection of breakeven adjusted earnings per share also trailed analysts’ forecasts.

“The current macro environment is creating elevated uncertainty across the industry, which is reflected in our outlook,” CFO David Zinsner said.

Shares of Intel dropped more than 5% in after-hours trading after climbing 4.4% in Thursday’s session. The stock was up about 7% for 2025 through Thursday’s close.

First-Quarter Results Top Estimates

Intel reported first-quarter revenue of $12.67 billion, down less than 1% year-over-year and above the analyst consensus. Adjusted net income of $580 million, or 13 cents per share, compared to $759 million, or 18 cents per share, a year earlier, also topping Wall Street’s estimates. Intel’s foundry division, which makes chips for other companies, delivered revenue of $4.7 billion, beating projections.

During the company’s earnings call, Zinsner said, “we believe Q1 revenue benefited from customer purchasing behavior in anticipation of potential tariffs,” though he added it’s “difficult to quantify the magnitude.”

CEO Lip-Bu Tan Says There Are ‘No Quick Fixes’

“The first quarter was a step in the right direction, but there are no quick fixes as we work to get back on a path to gaining market share and driving sustainable growth,” said CEO Lip-Bu Tan, who took over the role in March. Tan added that he is “taking swift actions to drive better execution and operational efficiency.”

In a letter published alongside the company’s earnings report, Tan laid out a number of changes, from an expanded return-to-office mandate and directive to cut back on meetings, to “removing layers” of the organization.

“There is no way around the fact that these critical changes will reduce the size of our workforce,” Tan wrote. “As I said when I joined, we need to make some very hard decisions to put our company on a solid footing for the future. This will begin in Q2 and we will move as quickly as possible over the next several months.”

The comments follow a report this week that Intel plans to cut more than 20% of its workforce, as part of a bid to streamline its operations.

This article has been updated since it was first published to include additional information and reflect more recent share price values.


Source link

Watch These Gold Price Levels After Precious Metal’s Retreat From Record High


Key Takeaways

  • Gold rebounded on Thursday after tumbling yesterday, as investors kept a close eye on developments related to tariffs and the economic outlook.
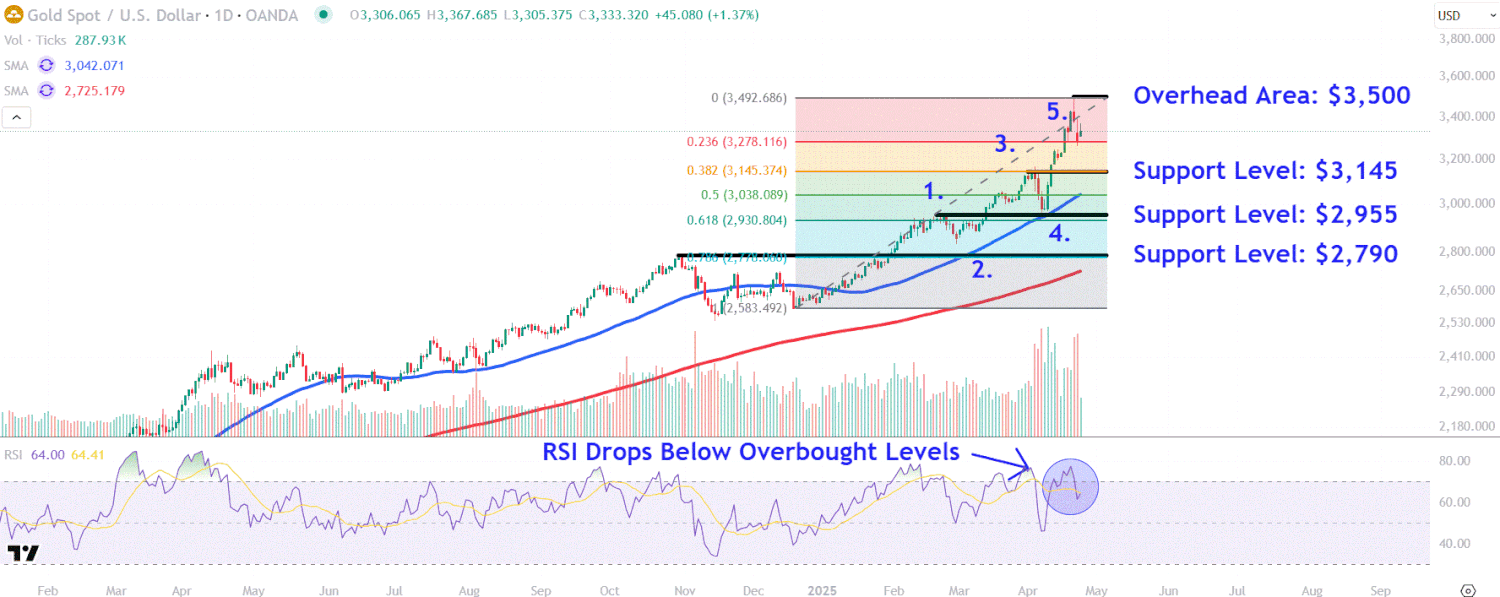
  • Gold’s price rallied to a new record high earlier this week before staging a dramatic intraday reversal to form a bearish shooting star candlestick pattern.
  • Investors should watch key support levels on gold’s chart around $3,145, $2,955, and $2,790, while also watching a critical overhead area near $3,500.

Gold (XAUUSD) rebounded on Thursday after tumbling yesterday from a record high, as investors kept close tabs on developments related to tariffs and the economic outlook.

The precious metal surged to its all-time high of near $3,500 an ounce earlier in the week as investors abandoned risky assets amid concerns about trade tensions between the U.S. and China and President Trump’s repeated criticisms of Federal Reserve Chair Jerome Powell. Gold backed off its highs after Trump said that tariffs on China would likely be significantly reduced and that he has no intention of firing Powell from his role.

The price of gold has soared 28% since the start of the year, boosted by worries that tariffs could slow economic growth and reignite inflation, sending investors flocking to the safe-have asset that is often seen a hedge against rising prices. Gold was trading around $3,350 late Thursday.

Below, we break down the technicals on XAUUSD’s chart and identify key price levels that investors will likely be tracking.

Indicators Signal Momentum Shift

Gold’s price rallied to a new record high earlier this week before staging a dramatic intraday reversal to form a bearish shooting star candlestick pattern.

The recent downside move coincided with a steep drop in the relative strength index (RSI) below overbought levels, indicating a strong momentum shift.

Zooming out, the commodity has trended sharply higher since mid-December, replicating a basic Elliot Wave pattern with five distinct price swings, which is then typically followed by a corrective phase.

Let’s identify three key support levels on XAUUSD’s chart to monitor and also locate a critical overhead area worth watching.

Key Support Levels to Monitor

Further weakness could see gold’s price initially fall to around $3,145. This area may provide support near the early-April swing high, which finds confluence from the 38.2% Fibonacci retracement level when applying a grid from the last year’s December low to this month’s high.

The next lower area to watch sits at $2,955, just above the 61.8% Fibonacci retracement level. Investors may look for opportunities to buy the yellow metal in this region neat the February peak and April trough.

Bullion bulls’ failure to defend this level could trigger a move down to lower support near $2,790. This area, sitting just above the 78.6% Fibonacci retracement level, may attract buying interest around the notable October 2024 swing high.

Critical Overhead Area Worth Watching

Finally, recovery efforts in gold’s price may see the price make another attempt at the $3,500 area. Tactical traders who have bought recent weakness may see the commodity’s record high set this week as a suitable location to lock in profits.

The comments, opinions, and analyses expressed on Investopedia are for informational purposes only. Read our warranty and liability disclaimer for more info.

As of the date this article was written, the author does not own any of the above securities.


Source link

Trump Vs. Powell: What Investors Need to Know


Throughout American history, we’ve seen our fair share of rivalries.

Coke vs. Pepsi. Yankees vs. Red Sox. Celtics vs. Lakers. Microsoft vs. Apple.

Heck, you could even argue our country was built on feuds…

Aaron Burr and Alexander Hamilton’s fierce rivalry ended tragically on a New Jersey dueling ground, with Burr fatally shooting Hamilton.

Abraham Lincoln and Stephen Douglas clashed over slavery and the soul of America in debates that defined our nation’s future.

Viewed in this historical light, the ongoing spat between President Trump and Federal Reserve Chair Jerome Powell isn’t unprecedented, but it certainly commands attention.

Sure, the stakes aren’t pistols at dawn, nor do they possess the grandeur and decorum of those historic debates. Yet investors and markets hang on every social media post and off-hand remark, wondering how this tense feud over monetary policy will reshape the economy – and their own financial futures.

In today’s Market 360, I want to touch on the latest developments that happened between Trump and Powell this week. I’ll cover what’s behind the President’s criticisms and why I think he may have a point in this particular case. I’ll also share how you can position your portfolio for success no matter what happens with tariffs, interest rates or the market.

Trump’s War of Words

Beginning last Thursday, President Trump hasn’t been mincing words when it comes to the Fed – and specifically Jerome Powell. He took to Truth Social, his social media platform, and blasted the Fed Chair, suggesting that his “termination” couldn’t come soon enough.

The verbal jabs kept coming over the weekend, and markets opened on Monday on a sour note.  

Trump’s criticisms didn’t sit well with the stock market, causing it to tumble sharply as investors worried Trump might fire Powell. All the major indices were down roughly 2.4% and 2.5% as a result.

But by Tuesday afternoon, Trump walked back his harsh words. He claimed he had “no intention of firing” Powell and argued the media exaggerated things. After Trump’s reassurance, stocks rebounded overnight, and by Wednesday, markets surged at the opening bell.

So, what changed Trump’s mind? Insiders say Treasury Secretary Scott Bessent and Commerce Secretary Howard Lutnick urged caution. According to reports, they reminded the president that the U.S. economy (and the stock market) has enough on its plate already – namely, in the form of tariffs.

Trump later clarified, “I would like to see [Powell] be a little more active in terms of his idea to lower interest rates. It’s a perfect time to lower rates. If he doesn’t, is it the end? No, it’s not, but it would be good timing.”

He also softened his tone on tariffs, hinting at easing his trade war by slashing China tariffs by as much as 65%, down from previous highs of 145%.

In the wake of these comments, stocks went on to rally for three straight days – with the S&P up over 6% this week. 

What’s Behind the Feud

What’s obvious to me here is that Trump is becoming more sensitive to the market – and that’s a good thing, folks. But why all the back-and-forth?

After all, Trump originally hired Powell during his first term. And Powell’s second term doesn’t expire until May 2026.

It all comes down to two people with two different jobs, folks.

Trump wants to grow the economy. Lower rates will help do that. Powell, on the other hand, is concerned about managing inflation. So, he’s being cautious about lowering rates. In fact, Powell recently warned that the tariffs could cause lingering inflation, making rate cuts tricky.

Cutting rates might help short-term growth, but risks higher inflation down the road. And Powell made clear: The Fed won’t bow to political pressure.

However, in this case, I think Trump has a point. Powell may be acting a little too cautious here, especially since inflation has clearly cooled down lately. Waiting could slow down the economy more than necessary. In fact, the recent Beige Book survey from the Fed noted that economic activity remains roughly the same, although uncertainty over tariffs is high and there are some signs of increasing prices.

But what we need to remember is that a global interest rate collapse is unfolding. The European Central Bank (ECB) recently cut key interest rates by 0.25% for the seventh consecutive time. I remain in the camp that, due to recessions in France and Germany, the ECB will cut another three times this year.

That means it’s only a matter of time before our central bank will have to follow suit. So, I am sticking to my prediction that the Fed will be cutting key interest rates at least four times this year, hopefully starting at the May Federal Open Market Committee (FOMC) meeting.

According to CME’s FedWatch Tool, that probably won’t happen. It has an over 90% probability of no change. But by mid-June, that’s a different story – with a better than 60% chance of a quarter-point rate cut.

How to Survive the Market’s Waves

The bottom line is we all know markets love lower rates. Stocks often jump when the Fed loosens the reins on monetary policy.

I think we’ll get those rate cuts soon enough. But in the meantime, my advice remains simple: Focus on owning strong stocks backed by superior fundamentals.

These are the stocks that hold up the best when waves of uncertainty come crashing down on the market. And they’re usually the stocks that rebound first when the tide lowers and things are “all clear.”

And I hate to break it to you folks, but there is an even bigger financial tidal wave coming for investors. In fact, it’s the biggest I’ve seen in my over four decades in the market.

It has nothing to do with Fed policy, the White House, tariffs or anything like that.

And I’m making it my mission to prepare you for what’s coming.

That’s why I created this presentation. I’ll explain everything you need to know and the best way to not only survive – but thrive – in its wake.

Click here to learn more.

Sincerely,

An image of a cursive signature in black text.An image of a cursive signature in black text.

Louis Navellier

Editor, Market 360


Source link

Dollar retreats as Fed may cut rates sooner fuel hopes – United States


Written by Steven Dooley, Head of Market Insights, and Shier Lee Lim, Lead FX and Macro Strategist

Trump confirms China meeting, risk sentiment improves

The greenback fell as Trump’s comments on China meetings triggered market optimism despite Chinese officials’ earlier dismissals of progress.

Euro firmed from around 1.1365 to 1.1395 during Trump’s press conference with Norway’s PM, benefiting earlier from a positive German Ifo survey.

Meanwhile, Fed Waller’s comments that he’d support rate cuts fuel hopes.

In the equities space, S&P 500 gains 2% while Nasdaq was up 2.7% overnight.

US curves bull steepened on Fedspeak suggesting a rate cut could come sooner if labor and growth data weakens notably and/or market volatility remains high.

Singapore industrial production is due for release today while antipodean markets observe local holidays.

NZD/USD was up +0.9% and AUD/USD gains +0.8%.

USD/CNH was flat while USD/SGD was down -0.4% overnight.

us slowdown case shown in fed pricing, DXY

Fed Waller said the impact of tariffs is likely to occur in July

If businesses begin to lay off employees and the unemployment rate begins to climb, Fed Governor Waller stated that the Fed would support rate cuts. 

Waller, meantime, stated that he believes the effects of tariffs on the economy will become apparent after July, when the jobless rate is expected to rapidly increase. 

He also restates that the inflation shock will only last a short while.

Re APAC FX, as we’ve mentioned earlier, USD/SGD has recovered from oversold levels.

The next key resistance levels for USD/SGD will be 21-day EMA of 1.3223, and 50-day EMA of 1.3315.

USD/SGd

ECB Rehn says banks should continue cutting, EUR recovers


The ECB According to Governor Rehn, tariffs have a two-pronged effect on inflation in Europe.

He believes the ECB should continue lowering rates if the inflation forecast develops as anticipated.

Nevertheless, EUR/USD looks set to continue higher with key support levels now at 21-day EMA of 1.1208.

For EUR/SGD, the pair also has its 21-day EMA of 1.4815 as key support handle, where EUR buyers may look to take advantage.

AUD/EUR however has flirted with the lows of 0.5390 recently, and now near its 21-day EMA resistance of 0.5642.

EUR/USD bollinger

Antipodeans recovered as risk sentiment improves

Table: seven-day rolling currency trends and trading ranges  

FX rates

Key global risk events

Calendar: 21 – 25 April

weekly calendar

Have a question? [email protected]

*The FX rates published are provided by Convera’s Market Insights team for research purposes only. The rates have a unique source and may not align to any live exchange rates quoted on other sites. They are not an indication of actual buy/sell rates, or a financial offer.


Source link

Copyright © 2023 | Powered by WordPress | Coin Market Theme by A WP Life