Archives March 2025

Get Ready for Solar Stocks to Catch Fire Once Again


Solar power is booming, regardless of politics—here’s how to profit from the next big surge.

Hello, Reader.

Much of the United States is still zipping up coats and fitting on gloves. And as it were, Punxsutawney Phil saw his groundhog-shaped shadow in Pennsylvania earlier this month, predicting six more weeks of winter.

We’re now about halfway through the superstitious forecast, which means that nature will soon be gearing up for its rendition of The Beatles’ classic, “Here Comes the Sun.”

The song’s famous lyrics may resonate with you folks in frostier regions, where “it’s been a long, cold, lonely winter.” But the sun will soon come again, and “I say, ‘It’s alright!’”

This sentiment also applies to solar stocks.

It’s true… a dark cloud has been hanging over the solar industry.

After President Trump won reelection in November, solar stocks experienced a selloff over worries that he would repeal the Inflation Reduction Act. This would halt the flow of loans to the solar industry from the Department of Energy and grants from the Environmental Protection Agency’s “Solar for All” program. Indeed, since assuming office, Trump has paused distributions from the act.

And yet… solar stocks performed far better during the first Trump administration than they did during the Biden administration.

A repeat performance may be imminent. Solar stocks may soon catch fire once again.

So in today’s Smart Money, let’s take a brief tour of the recent past and explain why President Trump’s return to office might signal bright prospects for the solar industry.

Then, I’ll share how you can capitalize on this solar resurgence…

The Trump Solar Paradox

During the first Trump administration, U.S. solar power capacity doubled. Then it doubled again during the Biden administration.

And now, based on the latest forecasts from the U.S. Solar Energy Industries Association, solar capacity will come close to doubling again during the second Trump administration.

In other words, the solar power industry does not seem to care which party occupies the White House or Congress.

It simply continues to grow… and do so at an exponential rate. Last year, the solar industry installed about 40 gigawatts of new capacity, which is more than the total capacity that existed 10 years ago.

No other domestic energy source is growing faster. Last year, solar installations accounted for a record-high 64% of all new U.S. electricity-generating capacity – up from 36% three years ago and 23% six years ago. This renewable energy source now produces enough electricity annually to power one-quarter of all U.S. homes.

Another reason to believe solar power will continue to thrive during the current Trump administration is that growth is the path of least resistance. The U.S. needs more power, and solar is one of the cheapest ways to get it.

Therefore, even if Trump enacts policies that encourage oil and gas development, he will not likely enact policies that actively discourage solar development.

And the nation’s soaring demand for energy – led by the data center construction boom we need for AI – will require an all-hands-on-deck solution. It will need contributions from every major energy-generation source, from nuclear to oil and gas to – you guessed it – solar.

A New Solar Landscape

Moving from political rhetoric to boots-on-the-ground policies, the Trump administration’s initial actions provide more “pros” than “cons” for the solar industry.

As I mentioned above, Trump has paused distributions from the Inflation Reduction Act.

However, Trump is also eager to fast-track energy projects of all types – both by removing regulatory obstacles and by providing direct government support.

These efforts are great news for the U.S. solar industry, because the main growth constraints it faces are physical, not political. Like most of the power sources in the United States, solar installations often struggle to overcome lengthy permitting processes and grid bottlenecks that can delay projects for years.

The National Energy Emergency Act that Trump signed into law last month seeks to eliminate all obstacles to what it calls “energy security.” In the words of the act…

The integrity and expansion of our Nation’s energy infrastructure — from coast to coast — is an immediate and pressing priority for the protection of the United States’ national and economic security…

This would create jobs and economic prosperity for Americans forgotten in the present economy…

Without immediate remedy, this situation will dramatically deteriorate in the near future due to a high demand for energy and natural resources to power the next generation of technology. The United States’ ability to remain at the forefront of technological innovation depends on a reliable supply of energy and the integrity of our Nation’s electrical grid…

In light of these findings, I hereby declare a national emergency.

Although Trump clearly intends for fossil fuels to take the lead in delivering energy security, solar will also play an essential role, even if government subsidies disappear forever.

According to recent data from Ernst & Young, solar power has become the cheapest source of energy in most locations. For example, the levelized cost of solar energy is at least 29% lower than the cheapest fossil fuel option, including natural gas combined cycle plants. 

In other words, solar power is no longer a quirky, fringy obsession of “tree-huggers.” It has joined the club of legitimate, economically viable energy sources.

In 2019, I recommended Daqo New Energy Corp. (DQ), a company that makes and sells polysilicon for solar panels. And a little more than a year after that recommendation, Daqo delivered a 148% gain.

I believe that solar stocks are presenting another compelling opportunity, just like they did during the first Trump administration. And at Fry’s Investment Report, we’re positioned to capitalize on the solar sector’s sunny transformation.

In fact, I’ve recently added a promising solar investment to our portfolio that’s primed for significant growth. To learn more about this opportunity, click here to learn how to join me at Fry’s Investment Report.

Regards,

Eric Fry

Frequently Asked Questions (FAQs)

1. Why are solar stocks set to rise again?

Solar energy demand is growing rapidly, driven by cost advantages, regulatory shifts, and increasing power needs.

2. How does politics impact solar investments?

Despite political changes, solar power continues expanding due to economic advantages and rising energy demand.

3. What are the biggest challenges for solar energy growth?

Permitting delays and grid infrastructure bottlenecks are the main obstacles, but new policies aim to address them.

4. Which solar stocks have performed well in past market cycles?

Companies like Daqo New Energy Corp. (DQ) have seen strong gains, and new opportunities are emerging.

5. How can I invest in the next solar boom?

Eric Fry has identified a top solar stock for investors—details are available in Fry’s Investment Report.


Source link

Tariff day and a busy week ahead – United States


Written by the Market Insights Team

The Loonie braces for impact, tariff day is here

Kevin Ford –FX & Macro Strategist

Little has progressed on the trade front since the one-month pause. Officials on both sides have speculated, and Canadian premiers have presented their case in Washington. Yet, here we are again, back to the wire, awaiting news at any moment.

Tariffs are in effect for now, though a last-minute deal remains possible. Last week, the Loonie adjusted to the increased likelihood of tariffs, but markets still largely expect the 25% tariffs won’t materialize. The Loonie climbed from a weekly low of 1.4182—just above the 20-week SMA—to a three-week high of 1.4472, marking a 290-pip weekly gain. If 25% tariffs are confirmed and Canada maintains retaliatory measures, the key resistance level of 1.4472 will likely be broken. Moves toward 1.46 for the Loonie and 21 for the Mexican peso would signal heightened bearish sentiment. The 60-day SMA at 1.433 serves as critical support if tariffs are delayed another month. Speculation continues around smaller tariffs or conditions like stricter drug traffic enforcement or matching U.S. tariffs on China, which could rise from 10% to 20%. Again, contradictory messages on tariff plans for Canada and Mexico have fueled volatility, particularly in USD/CAD, where implied volatility has surged last week.

Amid the chaos, one clear winner has emerged: the Canadian Liberals. PM Trudeau’s decision to prorogue parliament has boosted his party, now leading the Conservatives in polls for the first time in years. The Liberals have gained momentum by opposing Trump’s tariff threats and increasing investment in citizen-focused infrastructure. Time and wait have worked in their favor. Mark Carney has overtaken Chrystia Freeland as the most likely successor, with a final decision expected on March 9th. As March unfolds, Canadian politics will play out against a backdrop of ongoing uncertainty.

Today, key macro data from the U.S. will reveal whether manufacturing levels remain above the 50-expansion mark. In Canada, PMI manufacturing data is also due, though tariff news will dominate market focus.

Chart: Tariff-premia keeps the Loonie trading above 1.44

Dollar between (-) macro and (+) geopolitics

Boris Kovacevic – Global Macro Strategist

Rising inflation expectations and tariff angst are threatening the path of the US economy towards a soft landing, a scenario that seemed increasingly more likely from October onwards. That was when economic momentum started gaining traction again as the labor market began outperforming expectations. The election of President Trump led to a one-off boost in confidence as small and medium sized enterprises bet on tax cuts and the cutting of red tape. Now this narrative is in danger of falling apart due to tariff confusion and lower growth.

Last week, for example, ended on a sour note as Trump and Zelenskiy clashed in the Oval Office due to multiple disagreements regarding the war in Ukraine. The joint press conference that should have followed was canceled, sending a stark signal to the rest of the world that an immediate peace deal seems out of reach. Geopolitics and tariff chatter have clearly been a net-negative factor for risk assets as of late.

To make matters worse, investors have started questioning the health of the US economy. Last week’s weaker than expected macro data and front-loading of imports before US companies are hit by tariffs lead to a drastic drop of growth expectations. The Atlanta Fed Nowcast for Q1 fell from 2.3% to 1.5%, a decline only seen during periods of significant turmoil or crises. Inflation published on Friday was in line with expectations with the PCE index rising by 0.3% m/m in January. However, personal spending fell by 0.2%, the first decline in almost two years.

The dollar rose for a third consecutive session and is currently only supported by the geopolitical uncertainty as the macro picture looks increasingly bad. Investors went from pricing in one rate cut by the Fed just days ago to now expecting three for 2025. This is reflected in Treasuries as well. The 2-year yield fell below 4% for the first time since October, matching the low of the US surprise index. This week’s labor market data will be the first large litmus test for the US economy and therefore the US dollar in some time.

Chart: Dollar helped up by geopolitics, not macro or the Fed

Euro in the shadow of Trump

Boris Kovacevic – Global Macro Strategist

The euro is once again feeling the force that geopolitical uncertainty can have on sentiment and markets. European sentiment as of late has been improving, although at a slower than expected pace. The US macro picture seems to be deteriorating, and investors are back at pricing in three rate cuts from the Fed. At the same time is the narrative surrounding policy easing by the ECB becoming more complicated as inflation is picking up again.

However, none of this mattered for investors concerned with the spat between Trump and Zelenskiy and the falling implied probability of a peace deal being reached in the near term. The euro pushed lower for a second consecutive week and is once again trading below the $1.04 mark. Investors expecting the ECB meeting on Thursday to be a new catalyst to push the currency in either direction might be disappointed.

The 25-basis point cut is fully priced in, so it will be about the forward guidance to play the role of the market mover. However, the uncertain trade and geopolitical environment will likely mean that policy makers should remain caution and sensitive to the news flow. Today’s inflation print for the Eurozone is expected to show some deceleration in inflation pressures. The bigger catalyst for renewed selling pressure might once again come from the political or macro front. We would need a significant surprise on the US labor market report on Friday to see some price action of above $1.05 or below $1.03.

Chart: Peace deal probability drops like a stone.

Swinging with risk sentiment

George Vessey – Lead FX & Macro Strategist

Having jumped to a more than 2-month high above $1.27 last week, GBP/USD is back flirting with the $1.26 handle following renewed geopolitical uncertainty as the hostile White House meeting between Trump and Zelensky threatens prospects of a US-brokered ceasefire with Ukraine and Russia. The risk sensitive pound slid against safe haven peers, but remains firm against the euro, with GBP/EUR closing the month above €1.21 for the first time since 2016.

The UK’s worsening net international investment position and the fact it has a persistent current account deficit leaves sterling reliant on foreign capital inflows. With this in mind, if we see a bigger drawdown in equity markets, then realistically the pound should come under pressure as well via the risk sentiment channel. However, on the trade front, Britain is way down on Trump’s list for tariffs, both because he likes the UK and because the UK-US trading relationship is much more balanced than most, with US actually having a goods trade surplus with the UK. This is why sterling is viewed as a tariff haven of sorts. Indeed, the FX options market reveals that one-week risk reversals are least bearish on sterling right now versus most of the G10.

The main upside risk for sterling this week is if President Trump reverses or delays increases to tariffs on Mexico and Canada that are scheduled for Tuesday as this would likely boost risk sentiment across the board. Moreover, if the influx of US data disappoints this week, particularly the labour market report on Friday, this could help the pound resume its recovery back above $1.27 versus the dollar.

Chart: GBP viewed as less vulnerable in upcoming week

Dollar jumps despite yield slump

Table: 7-day currency trends and trading ranges

Table: 7-day currency trends and trading ranges

Key global risk events

Calendar: March 03-07

Table: Key global risk events calendar

All times are in ET

Have a question? [email protected]

*The FX rates published are provided by Convera’s Market Insights team for research purposes only. The rates have a unique source and may not align to any live exchange rates quoted on other sites. They are not an indication of actual buy/sell rates, or a financial offer.


Source link

Appetite For Alternative Assets Grows In Private Banking


Wealthy investors are expected to look beyond stocks and bonds, prompting private banks to expand offerings and expertise.

Publicly traded stocks and bonds have been great investments over the last 15 years, but wealthy investors are increasingly looking for alternatives to what the public securities markets offer them.

Whether from fear that public stocks are overvalued, that inflation will rise again, or that market volatility will increase going forward, wealthy investors want a change from the traditional.

Private banks are gearing up to help provide alternatives.

“Historically, [private investors] have been under-allocated to alternative assets compared to institutional investors, but we’re seeing a strong rise in demand,” says Mark Sutterlin, head of alternative investments at Bank of America Private Bank and Merrill Lynch. “We think most of our clients would be better off with an alternatives allocation around 25%.”

That would represent a huge shift in investing behavior for high-net-worth (HNW) investors. According to a 2023 report from consulting firm Bain & Co, ultra-high-net-worth investors and family offices with more than $30 million in assets already have 22% of their wealth invested in alternatives. But those with $5 million to $30 million in assets allocate only an average 3% to alternatives and those with $1 million to $5 million just 0.7%.

With individual investors and family offices holding more than half of the $289 trillion in global assets under management, that represents a huge, largely untapped pool of capital for alternative asset managers. It also represents a major challenge for private bankers aiming to help their HNW clients navigate new investment markets.

Preqin, an alternatives research firm, is forecasting that alternative assets under management—including private equity and credit, venture capital, hedge funds, real estate, and infrastructure investments—will rise from $16.8 trillion at the end of 2023 to $29.22 trillion by the end of 2029. Increased fundraising from private banks, family offices, and individual investors is expected to fuel the growth.

While Preqin is forecasting growth in all segments of the alternatives market—including hedge funds, which suffered an abysmal 2022 when both stocks and bonds took double digit losses—private equity and credit are the hottest markets.

“There’s been a tremendous amount of interest in private equity and private credit all along the wealth spectrum,” says William Whitt, analyst with Datos Insights who focuses on wealth management. “I expect the strong demand will likely last a couple more years as long as the economy stays healthy.”

Kinder, Gentler Offerings

Fueling the demand are kinder, gentler investment offerings from private asset managers.

“The preeminent sponsors recognize the opportunity and have become better partners with investors,” says Sutterlin. Large firms like Blackstone Group, KKR & Co, and Apollo Global Management have launched funds with smaller investment minimums, lower fees, greater transparency and even a degree of liquidity (see sidebar). “Investors are getting better access to the best strategies on better terms. Everything is changing in favor of end investors.”

Some banks are launching separate entities to help shepherd investors into private markets. Deutsche Bank launched DB Investment Partners just over a year ago to give institutional and HNW investors access to private credit investments. With floating interest rates, these vehicles have been in high demand for the last several years. DB Investment Partners operates independently and Deutsche is retaining its existing private credit business.

While the demand for alternatives is most developed in North America and Europe, Asia too is trending alternative.

“We’re seeing much more demand from our clients across the spectrum of alternative assets,” says Chee Jiun Wen, head of alternative investments at Bank of Singapore. “It’s not just about reducing risks but generating alpha and accessing opportunities you can’t get in the public markets.”

The bank, formerly known as ING Asia Private Bank, has been hiring people with institutional backgrounds and experience in alternatives markets. Its roughly 500 relationship managers get in-house training on alternative asset classes and how to incorporate them into client portfolios.

“We’ve been able to expand the investment universe for our clients and provide access to more investment solutions and investing strategies,” says Chee.

The bank is doing the same for its financial intermediary clients. Last year it launched a digital platform in partnership with global fintech firm iCapital that provides independent asset managers (IAMs) with access to over 1,600 funds from 600-plus firms. The site also offers research and tools for due diligence and reports and performance updates on fund investments.

“We’re a first mover in this space in Asia,” says Chee. “We’re giving IAMs the power to pick and choose the managers and investing strategies that make sense for their clients.”

A Key Differentiator

For private banks, helping wealthy clients increase their exposure to alternative assets smoothly and successfully will be a key differentiator in the wealth management industry going forward. While most have experience investing in alternatives for their wealthiest clients, the scale of the expected shift into alternatives in the HNW client space will be a major challenge for firms.

“There is a huge opportunity in private wealth, but banks need to be prepared for the growth,” says Trish Halper, CIO in the family office practice at Northern Trust. Halper’s clients have been investing in alternatives for decades with average allocations between 30% and 50%. “Family offices were early adopters in the alternatives space and high-net-worth investors are now catching up.”

The workload for financial advisors is significantly heavier with private market assets than with publicly traded stocks and bonds.

“The dispersion of returns is much wider in private markets than in public markets, which makes manager selection really important,” says Halper. “Banks need to devote enough resources for strong due diligence because access to information and data is much less in the private markets.”

The sourcing of quality investments is just the beginning. Private asset portfolios need to be diversified across sectors, vintages, and financial sponsors to reduce risk; the investments and the asset managers themselves need to be monitored; capital call obligations must be executed; and distributions need to be managed when investments mature.

“There are a lot more operational and administrative tasks involved in private investments,” Halper notes.

The growth in alternative asset markets represents a major shift in the private banking landscape. Banks across global markets are investing in technology and talent to handle the transition and to ensure that alternatives allocations help to optimize clients’ portfolios and meet their financial goals.

“The capital markets have evolved,” argues Bank of America’s Sutterlin. “For investors who want a truly diversified portfolio, if they’re not invested in private markets in both equities and fixed income, they’re not in a big part of the capital markets now.”


Source link

A Bigger, Better Guide for Collectors


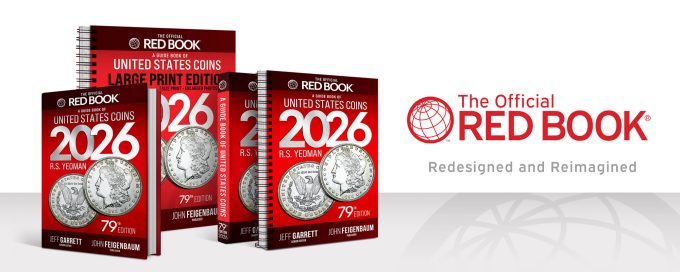
Whitman Brands™ proudly announces the return of A Guide Book of United States Coins, the world’s #1 best-selling price guide and numismatic reference, now enhanced in its completely-redesigned 79th edition.

Now available in more industry-standard 6x9” formats, including hardcover, perfect bound softcover, and spiral-bound, as well as large print spiral-bound, both in double-coil.
Now available in more industry-standard 6×9” formats, including hardcover, perfect bound softcover, and spiral-bound, as well as large print spiral-bound, both in double-coil.

Since 1946, collectors worldwide have trusted this guide for its grade-by-grade coin values, historical insights, detailed specifications, high-resolution photographs, and accurate mintage data. Wholesale shipments begin late March 2025.

The 2026 edition has been meticulously redesigned with the collector in mind. It features a larger 6″ x 9″ format, an intuitive layout, and over 32,500 market values in up to nine grades for more than 12,000 coins, tokens, medals, sets, and other collectibles. It also includes new market insights, updated research, and the latest mint data.

This year’s edition features a completely redesigned interior layout for easier use, market values for more than 12,000 listings using CPG® retail pricing, fun fact spotlights, updated research, the latest U.S. Mint data, and much more.

For the first time, pricing is based on Collector’s Price Guide (CPG®) retail pricing, and Greysheet Identification (GSIDSM) catalog numbers are integrated for seamless identification across Whitman’s family of products.

“I am truly honored to have been part of this year’s transformation, working closely with the extremely talented and professional staff at Whitman and the invaluable Red Book Advisory Panel of more than 70 numismatic industry leaders, experts, and supporters,” said Jeff Garrett, Editor and President of Mid-American Rare Coin Galleries.

“Every change, from the book’s physical size to its presentation order, was carefully chosen and implemented with a single goal—to enhance the collector’s experience.”

Key Enhancements

A Guide Book of United States Coins, affectionately known as the Red Book for its distinctive red color, debuts an all-new cover design for 2026.

In terms of layout, collectors will notice several key improvements, with certain major sections now arranged by collector preference rather than strict technical definitions.

  • The Private and Territorial Gold chapter has been significantly expanded, now including BG (Breen-Gillio) attribution numbers. Previously covering about 100 listings in two-and-a-half pages, this section now spans more than five pages with approximately 580 total listings.
  • Commemoratives chapter has been reorganized to better align with market conventions. They are now grouped by denomination and listed by the familiar names collectors use. Classic commemoratives are arranged alphabetically, while modern commemoratives remain listed by date.
  • Circulation and Proof-strike value charts have been separated throughout the book, making it easier for collectors to assess market values. Type-coin value charts have been added for each coin type, where applicable, including qualities of surface (e.g., Deep Cameo, DMPL), strike (e.g., Full Bands for dimes, Full Bell Lines for half dollars), and color (Brown, Red Brown, and Red). Coins known in all three levels of the relevant quality may have as many as 27 price points, ranging from G-4 to MS-65RD.
  • New data organization consolidates coin type information at the beginning of each section, allowing readers to compare multiple types without flipping back and forth, improving readability and accessibility.

Additional enhancements include:

  • Fun-fact spotlights throughout the book.
  • A regular, fully illustrated case study in the “Grading U.S. Coins” section (this edition’s focus: Morgan Dollars).
  • A new “Collector’s Notebook” covering timely topics in numismatics (this edition’s subject: Misinformation in Numismatics).

With over 25 million copies sold, the Red Book remains one of the best-selling nonfiction books in American publishing history – an invaluable resource for collectors at all levels.

“Our commitment remains strong, not only to preserving its legacy but also to expanding its reach,” said John Feigenbaum, Publisher and President/CEO of Whitman Brands. “From the Red Book to Red Book Quarterly (formerly CPG Coin & Currency Market Review) to the Red Book Podcast (now in its sixth episode and quickly growing in popularity), we are building something truly special and enduring for the collecting community.”

In addition to the larger 6×9″ format, the 2026 Red Book will be available in four different print bindings: hardcover, perfect bound softcover, spiral-bound, and large print spiral-bound. Pre-order purchases can be made now at Whitman.com and Amazon; regular purchases can be made through Whitman’s Ebay Store, Walmart.com, bookstores, hobby shops, and other retailers nationwide beginning April 8, 2025.

For more information, visit whitman.com.

For all episodes of the The Red Book Podcast or to subscribe to the Greysheet & Red Book YouTube channel, visit https://www.youtube.com/@greysheet-redbook/playlists.

Title: A Guide Book of United States Coins, 2026, 79th Edition
Authors: R.S. Yeoman
ISBN: 9780794851637
Binding: Spiral-bound
Dimensions: 6 x 9 inches
Pages: 484
Retail: $17.95 U.S
https://whitman.com/a-guide-book-of-united-states-coins-2026-spiral/

About Whitman Brands

Whitman Brands logo

Formed from the 2023 merger of the numismatic publishing powerhouses of CDN and Whitman, Whitman Brands unites iconic series and titles like the Red Book, Blue Book, 100 Greatest, Paper Money of the United States, and Cherrypicker’s Guide, plus, an expansive line of folders, albums, and supplies that have defined the retail market for decades, with the pricing and data-rich expertise of industry-standard publications like Greysheet, Greensheet, Red Book Quarterly, The Banknote Book and CDN Exchange.

Whitman Brands provides comprehensive resources for collectors, offering unparalleled coverage of collectibles, literature, cataloging, and pricing. Dedicated to celebrating the rich heritage of numismatics, Whitman enriches the lives of coin and paper-money enthusiasts across the globe.

As North America’s leader in coin and currency events, Whitman Expos further elevates the brand, hosting three premier shows annually in Baltimore and expanding the company’s national influence.


Source link

Intel Pushes Back Ohio Chipmaking Plant Opening by Four Years to 2030


Key Takeaways

  • Intel said it plans to push back the opening of two chipmaking facilities currently under construction in Ohio. 
  • The company’s chief global operations officer said the move reflected market demand.
  • Intel’s chipmaking business has been the subject of recent deal speculation.

Intel (INTC) said it plans to push back the opening of two chipmaking facilities currently under construction in Ohio. 

The beleaguered chipmaker now expects the two plants on its Ohio One campus to finish construction in 2030 and 2031, Intel Chief Global Operations Officer Naga Chandrasekaran said in an open letter to employees Friday. A year ago, the company said its goal was to finish construction on the $28 billion project in 2026—already a delay from its original target of 2025. Intel broke ground on the project in 2022.

“As we continue to invest across our U.S. sites, it’s important that we align the start of production of our fabs with the needs of our business and broader market demand,” Chandrasekaran said. Construction could be accelerated in the future “if customer demand warrants,” he added. 

The delay comes as Intel’s struggling foundry business has been the subject of acquisition speculation. TSMC (TSM), the world’s largest chip manufacturer, has reportedly considered taking over some or all of Intel’s chip plants as part of an investor consortium or another structure. Separately, Broadcom (AVGO) has also reportedly looked into buying Intel’s chip-design and marketing business. 

Shares of Intel were little changed in extended trading Friday after climbing close to 3% in the regular session. They’ve lost close to half their value over the past 12 months.


Source link

2 High-Potential Cyclical Stocks to Buy Now—and a Secret


These two names are riding powerful market cycles higher, and with the right strategy, you can find even more opportunities.

Last month, I (Tom Yeung) introduced eight cyclical stocks to buy immediately. These high-quality companies had winds in their sails, and all have since performed splendidly. As of writing, these companies have returned:

  • CME Group Inc. (CME): 6.4%
  • Cboe Global Markets Inc. (CBOE): 6.2%
  • DTE Energy Co. (DTE): 7.0%
  • Duke Energy Corp. (DUK): 4.9%
  • Dominion Energy Inc. (D): 3.1%
  • Eversource Energy (ES): 12.7%
  • AbbVie Inc. (ABBV): 19.0%
  • Kimberly-Clark Corp. (KMB): 9.1%

On average, these eight stocks have surged 8.6% in less than a month.

That’s more than ten times better than the S&P 500’s return, and stands in total contrast with the negative returns of the Dow Jones Industrial Average (-0.3%) and Nasdaq Composite (-0.1%).

We didn’t even have to take much “risk” to achieve these results. CME Group and CBOE have virtual monopolies in options and futures markets… Eversource is a New England power utility… and it’s hard to think of a more stereotypically dull firm than Kleenex maker Kimberly-Clark.

That’s because conservative stocks can provide magnificent returns when they have cyclical tailwinds on their side. Short-term seasonal effects are powering the four energy companies higher because natural gas prices typically rise during the cold winter months. Medium-term optimism is driving KMB’s gains. And longer-term business cycles are helping CME, CBOE, and ABBV do well.

Still, these cycles are a blink of an eye when viewed through the lens of Keith Kaplan, CEO of TradeSmith. To him, he’s looking for cycles across decades… if not longer.

These generational shifts can power stocks like Apple Inc. (AAPL) for a quarter-century, turning every $10,000 invested in 1997 into $16 million today.

That’s why I encourage you to reserve your spot for Keith’s latest presentation. During that free broadcast, next Thursday, February 27, he’ll be revealingwhat he’s calling “the pattern,” a cyclical effect that’s only happened every 49.5 years on average.

When this patten appears, Keith says, it can send a specific class of stocks soaring. In fact, back-tests show the last time this pattern appeared under these conditions, it led to historic gains over the long haul, such as 9,731% from a leading software company… and 28,894% from a computer-driven hardware firm.

For long-term investors, it’s an event you don’t want to miss.

To save a seat for that event, click here.

Meanwhile, I’d like to introduce two more cyclical stocks for shorter-term investors seeking to ride cyclical waves higher.

2 Roaring Cyclical Stocks to Buy

Like before, I apply four key criteria to find cyclical firms to buy:

  • Upside. These firms must score an “A” or “B” in Louis Navellier’s Stock Grader (subscription to any Navellier service required). This proven quantitative system has long been a solid predictor of future gains, thanks to its focus on institutional fund flows, fundamental quality, and other critical factors.
  • Quality. Companies must have “moats” around their businesses that protect them during low-cycle moments. Buying cyclical companies is pointless if the firms can’t survive the next inevitable downturn.
  • Cyclicality. The firm’s industry must demonstrate an ability to bounce back. So, I exclude any “sunset” industries that are trending downward into oblivion.
  • Timing. The company must trade within 30% of its 52-week low. This prevents us from buying shares of cyclical companies at the top of the market.

The Data Center Giant Hiding in Plain Sight

Anyone who has visited Northern Virginia will have seen its picturesque rolling hills, scenic trails, and budding winery industry.

In addition to the occasional hidden government base, this natural beauty hides another secret:

America’s largest data center network.

The region hosts more than 500 of these facilities – drawn in by Virginia’s world-class fiber optic network, affordable electricity, and proximity to other data centers. When you’re running a massive computer network, it’s best to locate your servers near others.

That’s where Digital Realty Trust Inc. (DLR) comes in. The San Francisco-based firm is the world’s largest data center and co-location provider – the service that rents data center facilities to other companies. Digital Realty’s 300 data centers span 50 cities, and it has strategically located centers in almost every major computing cluster.

That’s made Digital Realty an incredible winner in the race for AI computing power. On February 13, the company announced revenues of $1.4 billion (a solid 5% rise from the prior year) and earnings per share of $0.51, a fivefold jump.

The cycle will likely continue through 2025 as cloud computing companies struggle to construct data centers fast enough. In January, companies from Alphabet Inc. (GOOGL) to Microsoft Corp. (MSFT) reported they were turning business away from a lack of capacity.

This has triggered a surge in new leasing activity for Digital Realty, which should bring in record profits in 2025. Analysts expect adjusted EBITDA growth to accelerate to 8% this year and 11% in 2026.

Please note that the party will eventually end for Digital Realty. Many tech firms are building their own hyperscale data centers, and these facilities will compete against Digital Realty’s vast network. DLR is also not immune from the “bust” part of the boom-bust cycles of data centers, given its relatively commoditized business.

Nevertheless, Digital Realty’s double-digit selloff since November provides an opening for investors to buy into the AI Revolution for a discount. Shares likely have a 30% short-term upside from here.

Getting Back on the Menu

In 1992, the National Livestock and Meat Board launched an advertising campaign aimed at promoting beef consumption.

“Beef. It’s What’s for Dinner” was a surprising success. Over 88% of Americans now recognize the slogan, and it may have contributed to the recovery of beef consumption in the late 1990s.

Nevertheless, no advertising campaign has ever solved the cyclicality of the meat production industry. Cattle producers typically adjust their herds collectively, and the U.S. Department of Agriculture notes this creates a “cattle cycle” that lasts 8to 12 years. The graph below illustrates how regular these peaks and troughs can be.

The latest trough is now in sight. Cattle herds are expected to bottom out this year and potentially rise again in 2026. The trade publication Drovers Magazine notes that Oklahoma calf prices are up 61% since 2022, which is creating “increasingly strong market signals for cow-calf producers to expand the beef cow herd.”

That’s excellent news for Tyson Foods Inc. (TSN), North America’s largest cattle processor. The firm handles almost a quarter of beef packed in the U.S., and has divisions across Asia and Europe that do the same. A turnaround in U.S. cattle production will strongly impact the company’s bottom line since that segment is loss-making at current production volumes.

In addition, Tyson is benefiting from consistent poultry demand, because it also controls 25% of that market. That segment generated 9.1% adjusted operating margins in its most recent quarter – the highest level since 2017. Chicken feed costs have eased, and Tyson has managed the recent bird flu epidemic relatively well.

Together, analysts expect Tyson’s net income to rise at a 19% annualized rate through 2027, a bullish sign for the stock. Shares of the meat processor have typically surged during cattle upcycles (60% during 2004-’07 and 120% in 2015-’22), and this new cattle cycle promises more of the same.

The Even Greater Cycle

The downside to cyclical companies like Digital Realty and Tyson is that “what goes up must come down.” Good times eventually end, and investors have a habit of acting as if peak cycles will never return. Shares of both firms fell as much as 50% in the last market downturn and will likely do so again.

That’s why I urge you to sign up now for Keith’s special briefing on Thursday, February 27th.

During that event, he’ll demo his company’s new tech breakthrough that revealed “the pattern.”

He’ll show you the pattern in full.

Keith will even reveal the names and tickers for 10 tech stocks poised to soar as the pattern begins to play out in 2025.

Based on what happened last time, the long-term gains could get legendary.

Just go here to get your name on the list for Keith’s February 27 briefing.  

I’ll see you here next week,

Regards,

Thomas Yeung

Markets Analyst, InvestorPlace

Thomas Yeung is a market analyst and portfolio manager of the Omnia Portfolio, the highest-tier subscription at InvestorPlace. He is the former editor of Tom Yeung’s Profit & Protection, a free e-letter about investing to profit in good times and protecting gains during the bad.


Source link

Forecasting Future Fraud: Q&A With Joanne Horton Of Warwick Business School


Global Finance: Can you briefly describe what your model does?

Joanne Horton: Yes. We’ve got what we think is a rather exciting model, which we describe in a working paper, that helps forecast in advance the likelihood that a firm will go on to commit accounting fraud.

What’s the likelihood that fraud will take place in the future? There’s lots of motivation, obviously, because a lot of fraud takes place: few cases, but each one is very expensive. In a recent interview, the US Securities and Exchange Commission’s (SEC) enforcement director said they had a record $600 million in penalties in 2024 just for 70 cases. So obviously, the penalties and deterrence for doing it are not doing their role, and we need to find something else that can hopefully prevent this from happening.

But most—well, all—of the research into accounting fraud has focused on detection rather than prevention. We wanted to examine prevention. So, what can we do before the fraud occurs? Can the board of directors, the auditors, or other gatekeepers do something? Can I identify the year the fraud occurred in the account? That’s what all the models currently do.

We’re trying to look at data well before the fraud took place and say, “Would we have red-flagged this firm as likely to be committing fraud in the future?” Our model will not tell you it will happen—it simply says there’s a high risk of it happening in the future, which allows us, hopefully, to take corrective action so the fraud doesn’t take place. We don’t include the fraud at all in our model, so we can accurately identify those who are likely to commit fraud and those who are unlikely to commit fraud at 87.68% of cases on average: 90.58% one year before the fraud takes place, 83% two years, and 75% three years before the fraud takes place.

GF: What does your model tell you about how accounting fraud happens?

Horton: We know the antecedents to fraud: It is never a cliff edge but always a slippery slope. You start off small, and then it starts escalating. If we think about it, a manager—if facing pressure to beat an analyst forecast, or beat last year’s earnings, or wanting a particular bonus—has enough flexibility in the accounting rules to manage those numbers while staying within the rules. So, they change inventory methodology, or they change their assumptions on revenue recognition, and they make it such that they beat these forecasts.

But eventually, they’ll hit the limit, and then the only thing they can do is either come clean or go on to egregious misreporting. Now, we know from the academic literature that three years before the fraud, they tend to beat earnings benchmarks. And there’s a recent paper that says you’re more likely to round up your earnings-per-share number about five years before. However, the problem with this research is that they already know the fraud has taken place.

So, how are we going to track the slippery slope? Ultimately, what the managers are doing is increasing their human intervention in the accounts—legitimately, within the rules, but then that human intervention has to keep escalating because with accruals reversals, you’ve got to cover the reversal, and then you’ve got to increase the amount to beat any forecast. So, human intervention in the accounts escalates.

GF: So how do you capture that human interventionthat higher risk of fraud?

Horton: We use Benford’s law, which is a mathematical frequency model. And what we know from prior literature is that the data in the financial statements and notes will follow Benford’s law on average—if there is no human intervention in the accounts. Now, some human intervention may be legitimate, so it will change the deviation, and some may be illegitimate. So, we have to infer whether the deviations are legitimate or not, and we do that by seeing whether the deviations increase and escalate over time. That shows the slippery slope.

Even if there are small but consecutive increases in deviation, they’re having to use human intervention to cover it up; and it’s still increasing relative to what the firm should look like.

The key benefit of Benford’s law is that it doesn’t matter what kind of firm it is—public, private, what accounting policies it follows, what currency it operates in, whether it’s loss-making, whether it’s a growth company, highly leveraged or no leverage at all—makes absolutely no difference. This enables this model to be universal because you can apply it to any company, country, or industry. Once we’ve got a probability from the model, we use that to determine a red flag. And we have to have a red flag twice, so we don’t have anything that’s just random.

GF: What does it take to get that first red flag?

Horton: If they say they made a legitimate change in depreciation, you’ll see an increase in human intervention, but then the deviation shouldn’t escalate.

The model learns from prior fraud as to what it takes: when it gets to a point where, in other cases, there is a higher likelihood. The model creates this hazard ratio, which tells us the likelihood, and then we compare that to what we’d expect in the overall population. If it’s higher than we’d expect in the population, then it’s red-flagged.

GF: And when does the company get a second red flag?

Horton: So what we’ve actually found out, which is interesting, is that it’s very rare—almost impossible—to stop being red-flagged. The model keeps red-flagging you, and then you either go bankrupt or commit fraud. What we haven’t been able to observe is a firm with a red flag that then suddenly stops.

In firms that commit fraud, there’s a culture where you can be overly optimistic about things and rationalize what you’ve done prior. This is why auditors are hopeless at capturing and identifying fraud: because it’s so incremental. The problem for auditors is that if they agree to one change, it’s quite difficult not to agree to a second change, because you’ve rationalized the agreement on the first change.

GF: How do you know to look for fraud in M&A?

Horton: There’s fraud in a lot of places; and the more opaque, the more fraud. You can hide it more easily in M&A, but it’s more about due diligence. So, you are acquiring another company; and we all know that if it’s a hostile takeover, the company is going to make itself look very expensive. So, more human intervention is needed in accounting. And you see that happening over time. And even if it’s not hostile, you’re going to make yourself look good for a takeover.

The other thing we notice is where most of the fraud takes place. It’s not in the parent company, it’s in the subsidiaries. They’re not under the purview of the top brass. They may have different auditors. The parent may be putting a lot of requirements on their subsidiaries to provide a huge return, and if they can’t do it, how do you alleviate the pressure? You manage your numbers.

GF: Do you have an example?

Horton: Here’s one. HP was under pressure to achieve high revenue targets. Their initial response was to increase their human intervention in 2008: They changed their inventory valuation assumption, their revenue recognition assumptions, and a few other things. But in the end, they couldn’t maintain that. So, they ended up, in 2015 and 2016, creating fictitious revenues, valuing the inventory upward, channel stuffing, and many other things. The SEC announced in 2020 that HP had committed fraud. Our model identified the fraud, and we red-flagged HP in the fourth quarter of 2010. So, we already knew at the end of 2010 that they were likely to commit fraud.

A more recent one is [fitness-beverage maker] Celsius. They committed accounting fraud in the second and third quarters of 2021; it was announced in 2025. We red-flagged it in the fourth quarter of 2019.

GF: How are you making your model available?

Horton: We have been offered quite a lot of money to buy the model. But being an academic, I think research is a social good; and therefore, we would just like to build up the model so it’s global and then provide the output to anybody who wants it. So, we would like to allow anyone to download our red flags. The other thing is that we will publish it in detail so our model will be perfectly replicable.

The other thing we’ve noticed in our analysis is that identifying escalating human intervention also exponentially improves bankruptcy risk models, because what do you do before you go bankrupt? You try to delay it, and you will do that through the accounting. So, we think this human intervention measure should be utilized in IPOs and M&As when you’re doing due diligence—all that sort of thing. In that respect, I want it to be a public good.

GF: Would it be possible for fraudsters to use AI to fly under the radar of Benford’s law?

Horton: That is very difficult, because human intervention is human intervention in whatever form it takes. We actually tried to use AI to create a set of accounts that had a huge level of human intervention but followed Benford’s law, and it was practically impossible. Because the trouble is, if you change a few numbers in revenue, it’s going to change a lot of numbers in accounting. It’s going to change your equity, your retained earnings, your profits, your earnings per share, your EBIT, your EBITDA—all these numbers would change. And it’s incredibly difficult. I’m sure someone could spend a lot of time trying to do it, but doing it quarter on quarter on quarter, we believe, is incredibly difficult, because we’ve tried it. But nothing’s impossible.

GF: Who do you foresee using the model besides academics?

Horton: I think auditors, for sure, because they want to know their audit risk, especially if you are taking over from a previous auditor.

I think board members, because it’s their risk as well. I think for due diligence in IPOs and M&A, because you’ll notice a lot of IPOs that commit accounting fraud. So I think short sellers. Regulators could use it, too.

GF: Will there be some technology available using your model?

Horton: I imagine somebody will be capitalizing on that in the future. But we’ve just got money for a postdoc to put this into AI and see what other things we can do. We have used all listed US firms from 1962 till 2020 because that’s when we wrote the paper. We use quarterly data, which we download from Compustat. Anything in the notes, as long as it’s not a repetition of another number.

Since Benford’s law is indifferent about currency or anything else, we’re going to build the model globally: put India in there, China, the UK, Europe, etc. We’re hoping this might actually improve the accuracy because it’ll have more data to learn. But to date, it’s all listed US firms.

GF: What specific changes do you see that might suggest a company is on the slippery slope?

Horton: We look at misreporting: all types of misreporting. We also looked at fraudulent security class actions. And we also look at firms that have made restatements. Nobody said it was a fraud, but nobody said it wasn’t a fraud, either. We can forecast restatements with quite a high level of accuracy.

GF: Are regulators doing anything to anticipate fraud, or are their efforts all retrospective?

Horton: It’s very difficult because the regulator is going in because something has happened. The Public Company Accounting Oversight Board [PCAOB]  looks at companies’ accounts and audit papers and tries to make sure that the accounting is being done correctly. Here in the UK, the Financial Reporting Council looked into audit papers of the FTSE 100 and basically gave them a good health score. So, I think regulators have been trying to do it, but I don’t think they’re as good as they should be.

I think regulation should be about prevention, because the people who win are the people who commit the fraud, and the people who lose—because who pays these fines?—are the shareholders. They price it in. I would have hoped the PCAOB looked at audit reports, but you still have failure.

GF: Why is so much fraud connected with IPOs? Because they don’t do enough due diligence?

Horton: If they have an IPO, they’ll be big firms, and they’ll follow International Financial Reporting Standards or US GAAP. Even if they’re private, they will still be doing so because they’re larger firms.

So, some of it is because they’re overly optimistic. If you’re overly optimistic, you’ll make more changes because you think it’s all going to happen. You are going to make those sales, right? You’ve got to look like you’ve got a future. And then, of course, they have to maintain it, even if things don’t turn out as optimistically as they thought.

GF: If your model becomes widely used, could its presence deter people or companies from committing fraud?

Horton: I hope it would. However, let’s say you’re the CEO, and you think, “Well, let’s see if I can just get away with it.” You’re going to do a cost-benefit analysis of just keeping going. Then I hope the auditors are looking at it and asking questions. Our model might improve auditing since it can provide a list of X red flags across all listed companies in the US.

Interestingly, we also find problems like a lack of an internal control system, which is also a prelude to human intervention. If you’ve been found to have poor internal controls, you’re highly likely to have this increasing human intervention.


Source link

U.S. Coin Production Reaches 633.56 Million in January 2025


CoinNews US 2025 quarter, obverse
The U.S. Mint produced 633.56 million coins in January, with 172.8 million of them quarters

U.S. coin production reached a three-month high in January, according to newly released United States Mint manufacturing data. However, output remained below 1 billion coins for the 17th consecutive month, following an earlier streak of eight months above that threshold.

The U.S. Mint produced 633.56 million coins for circulating during the month – including cents, nickels, dimes, quarters, and half dollars – reflecting a 61.8% jump from December but a 16.2% decline from January 2024.

Here’s how January’s production compares to previous months over the past year:

January 2024 to January 2025 Circulating Coin Production

Month Mintages Rank
January 2025 633.56 M 4
December 2024 391.70 M 9
November 2024 602.90 M 5
October 2024 826.60 M 1
September 2024 486.00 M 6
August 2024 405.20 M 7
July 2024 235.20 M 12
June 2024 168.22 M 13
May 2024 396.08 M 8
April 2024 368.20 M 11
March 2024 332.70 M 10
February 2024 644.86 M 3
January 2024 755.98 M 2


The U.S. Mint’s primary mission is to manufacture coins in response to public demand. It manufactures, sells, and delivers circulating coins to Federal Reserve Banks and their coin terminals, ensuring commercial banks and other financial institutions have the necessary supply.

Despite costing the Mint 3.69 cents to produce and distribute each penny, the Federal Reserve consistently orders more of them than any other denomination. In January, the Mint struck 242.4 million Lincoln cents, accounting for 38.3% of all circulating-quality coins produced for the month.

The future of the penny, however, is increasingly uncertain. On Feb. 9, President Trump ordered an end to its production, calling the move a step toward reducing “wasteful” government spending.

“For far too long the United States has minted pennies which literally cost us more than 2 cents,” Trump said in a Truth Social post. “This is so wasteful! I have instructed my Secretary of the US Treasury to stop producing new pennies. Let’s rip the waste out of our great nations budget, even if it’s a penny at a time,” Trump wrote.

Month-Over-Month

In month-over-month comparisons for coins commonly used by Americans, January production saw:

  • 9.4% fewer Lincoln cents,
  • 280% more Jefferson nickels,
  • 52.8% more Roosevelt dimes, and
  • 870.8% more quarters.

Mintages of Native American Dollars and Kennedy Halves

The U.S. Mint also produces other coins in circulating quality, including half dollars and dollars. While Native American $1 coins are no longer ordered by the Federal Reserve, they continue to be minted in circulating quality for collectors. The same applied to Kennedy half dollars until recent years — specifically in 2021, 2022, 2023, and 2024.

In many years, the U.S. Mint strikes both denominations in January to meet the expected demand for the entire year. However, that has not been the case for Kennedy half dollars over the past four years, as the Federal Reserve unexpectedly ordered millions more for circulation — approximately 12 million in 2021, 7 million in 2022, 18 million in 2023, and 52 million in 2024.

It remains unclear whether any 2025 Kennedy half dollars will be produced for general circulation. So far, production figures show 3.6 million half dollars struck at the Denver Mint and 5.8 million at the Philadelphia Mint, for a total of 9.4 million coins. By comparison, 2024 production totaled 21.9 million from Denver and 15.7 million from Philadelphia, amounting to 37.6 million coins.

Mintage levels for 2025 Native American dollars are expected to remain unchanged, with 1.12 million struck at both the Denver and Philadelphia Mints for a combined 2.24 million coins – the same totals as in the previous two years.

On Jan. 28, the U.S. Mint began selling rolls, bags, and boxes of 2025 Native American dollars from the Denver and Philadelphia Mints. Collectors can expect rolls and bags of circulating 2025 Kennedy half dollars to become available on May 6.

The following table details 2025 circulating coin mintages by production facility, denomination, and design.

U.S. Mint Circulating Coin Production in January 2025

Denver Philadelphia Total
Lincoln Cent 82,400,000 160,000,000 242,400,000
Jefferson Nickel 43,680,000 38,400,000 82,080,000
Roosevelt Dime 68,500,000 56,000,000 124,500,000
Quarters 84,200,000 88,600,000 172,800,000
Kennedy Half-Dollar 3,600,000 5,800,000 9,400,000
Native American $1 Coin 1,120,000 1,260,000 2,380,000
Total 283,500,000 350,060,000 633,560,000


In total January production, the Denver Mint struck 283.5 million coins, while the Philadelphia Mint produced 350.06 million, bringing the combined output to 633.56 million coins. As previously noted, this represents a 16.2% decline from the 755.98 million coins minted in January 2024.

If the current production pace continues through December, the 2025 annual mintage would surpass 7.6 billion coins. For comparison, the U.S. Mint produced just over 5.6 billion coins for circulation in 2024, marking the lowest output since 2009.

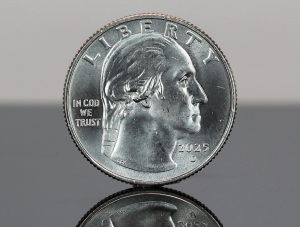
Mint data also shows that 172.8 million quarters were struck in January, primarily consisting of Ida B. Wells quarters (168.4 million) and Juliette Gordon Low quarters (4.4 million), the 16th and 17th releases in the Mint’s 20-coin American Women Quarters™ series. Given their relatively low mintages, more of these same designs are likely to be produced later this year. The Mint began selling Ida B. Wells quarters in early February, with Juliette Gordon Low quarters set for release in March.


Source link

Marco Rubio’s Net Worth Is 7 Figures—Here’s Where It Came From


Key Takeaways

  • U.S. Secretary of State Marco Rubio has an estimated net worth of more than $1 million, according to Forbes.
  • Rubio’s net worth comes largely from his salary as a government official and a real estate property in his home state of Florida.
  • Rubio also has earned royalties from writing several books.

Marco Rubio, President Donald Trump’s secretary of state, was the first member of the new cabinet to be confirmed. For years a senator from Florida, he differs from some members of Trump’s inner circle on financial terms: He’s not exactly one of the ultra-rich.

Neither a tech entrepreneur nor a titan of finance, Rubio’s money has come mostly from his government salary, his home and book royalties. (For examples of some of Trump’s wealthier advisers, here’s our coverage of the fortunes of Elon Musk, Howard Lutnick, and Robert F. Kennedy Jr.)

Rubio served as a U.S. senator from 2011 to 2025, and was a member of the Florida House of Representatives before that. He ran unsuccessfully for the Republican presidential nomination in 2016.

He has an estimated net worth of more than $1 million, according to Forbes. Here’s how Rubio got there.

Senate and Secretary of State Salaries

Rubio earned an estimated $174,000 annually in his years as a U.S. senator from 2011 to 2025. In his latest role secretary of state, Rubio will earn more than $200,000 each year, according to Forbes.

Rubio’s most recent financial disclosure, from August 2024, shows stock in Coca-Cola (KO) and Cisco Systems (CSCO) valued at between $1,001 and $15,000 each. Both assets were divested after the report was filed, according to endnotes on the disclosure.

Book Royalties

Rubio has written several books, incluidng “An American Son,” “American Dreams,” and “Decades of Decadence.” He earned an $800,000 book advance in 2012 for “An American Son,” per Forbes.

He earned $102,500 in royalties from Penguin Random House for “American Dreams,” according to the secretary of state’s financial disclosures.

Rubio also earned more than $100,000 from sales of his most recent book, “Decades of Decadence,” which came out in 2023, according to an estimate by Forbes. Rubio’s 2024 disclosure shows he earned up to $50,000 in royalties for “Decadence.”

Real Estate

Rubio bought a property in Miami in 2021 for just under $1 million. It is now valued at about $1.75 million, according to an estimate by Forbes.


Source link

This Advanced Stock Picking Tool Uncovers Tomorrow’s Profits


When it comes to stock fundamentals, three things matter most: sales, earnings, and profit margins

Editor’s note: “This Advanced Stock Picking Tool Uncovers Tomorrow’s Profits” was previously published in December 2024. It has since been updated to include the most relevant information available.

“Americans Cut Spending at Most Drastic Level in Four Years”…

“Stocks Bounce Back, But Head for Down Week, Month”…

“Homebuyers in U.S. Canceled Contracts at Record Rate for January”…

“Bitcoin Down 25% From All-Time High as Crypto Rout Worsens”…

No matter where you look, it’s clear that Americans are feeling the pain. We’re living through turbulent times. And for investors, that volatility is on full display in the stock market.

But what if I told you there was a better way to invest, avoiding the rollercoaster while still achieving enormous returns? 

That is, in response to recent market volatility, my team and I have turned to data and analytics to create a smart stock-picking model that only invests in the best stocks at the best times, maximizing upside potential while mitigating downside risk.

This screener analyzes thousands of stocks each month to find those best positioned to rise over the next 30 days. I’m talking stocks with a strong fundamental, technical, and sentimental basis. 

We’ve dubbed this advanced tool Auspex – in recognition of the ancient Roman officials who interpreted omens to guide their decisions. 

As I mentioned, each month, Auspex runs a comprehensive scan of the market, examining many thousands of data points to find the few stocks that are strong across the board. 

But what exactly does that entail? 

Today, we’ll start by reviewing the fundamental aspect of Auspex’s stock picking.

There are a lot of fundamental factors to consider. And that means there are a lot of ways for a stock to be fundamentally strong. 

Trained to Seek Only the Best Fundamental Setups

In our experience, three things matter most when it comes to stock fundamentals: sales, earnings, and profit margins.

Are sales rising? What about earnings? Is the trend of that growth picking up or slowing down? And how about profits? Are margins compressing or expanding? 

When looking for the market’s top performers, we want to find stocks that are growing sales and earnings. Moreover, we want to see sales growth acceleration, meaning the business is seeing underlying sales momentum. The same goes for earnings growth. 

Additionally, we want to see profit margin expansion, too. That means we’re hoping to uncover businesses whose profit margins are higher today than where they were last year. 

When a stock meets all those criteria, Auspex deems it fundamentally strong. 

And not many meet such strict criteria. 

That is, very few stocks have rising and accelerating sales and earnings growth, as well as profit margin expansion, all at the same time.

When we have Auspex scan the markets, it analyzes a universe of roughly 14,000 stocks.

In a recent scan we conducted, only about 300 of those 14,000 stocks were deemed fundamentally strong, with accelerating sales and earnings growth and swelling profit margins. 

That is just about 2% of all possible picks. 

Yet, the complete list of the most promising stocks Auspex flags is even narrower.


Source link