Key Takeaways
- United shares stabilized Friday after several days of turbulent price swings as investors asses what impact economic uncertainty will have on the airline’s outlook.
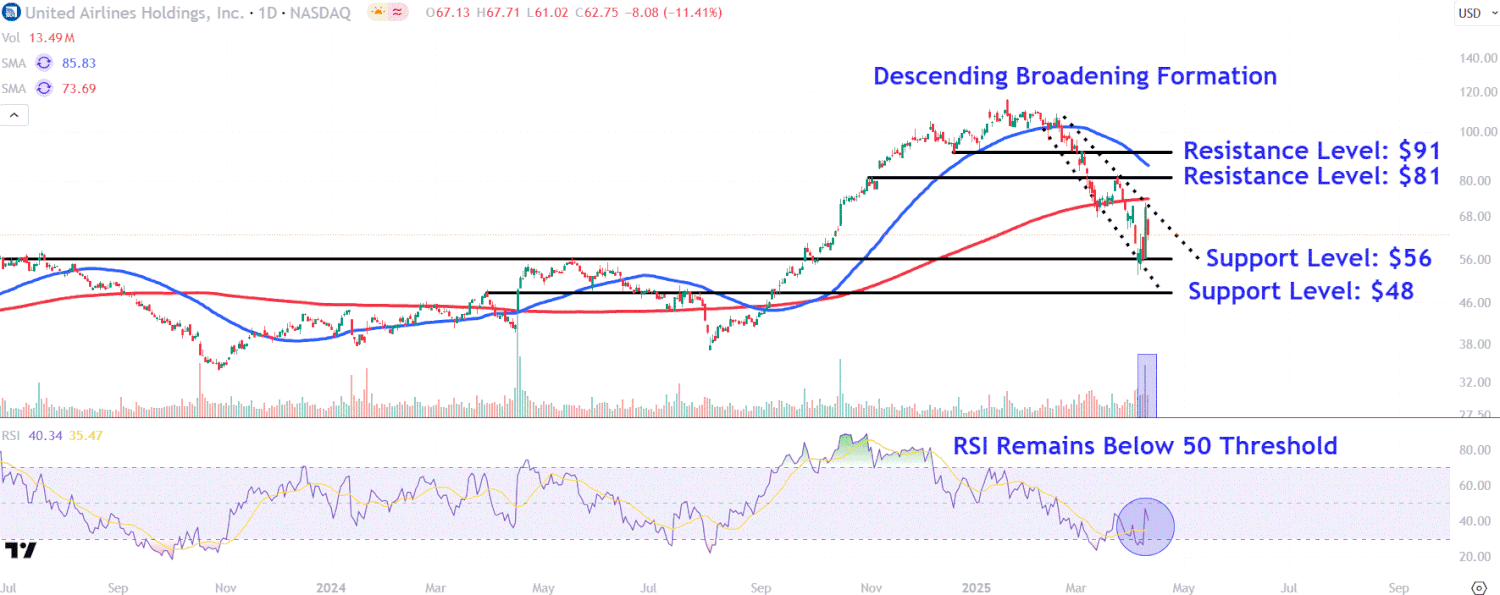
- The stock ran into selling pressure near the upper trendline of a descending broadening formation and 200-day moving average during Wednesday’s rally that saw the stock register its highest daily volume since October last year.
- Investors should monitor major support levels on United’s chart around $56 and $48, while also watching crucial resistance levels near $81 and $91.
United Airlines (UAL) shares stabilized Friday after several days of turbulent price swings as investors asses what impact economic uncertainty will have on the airline’s outlook.
United’s stock, which soared 26% during Wednesday’s tariff-pause relief rally before paring a little more than half of those gains yesterday, may see further near-term volatility as market watchers brace for the company’s earnings due after next Tuesday’s closing bell.
Investors will likely focus on the airline’s commentary regarding its full-year outlook and watch to see if it follows Delta (DAL), which reported better-than-expected earnings this week, in reducing capacity to manage softer demand.
United shares have lost about a third of their value since the start of the year amid concerns that a tariff-induced economic slowdown could stall leisure and business travel demand. United shares were up slightly at just under $63 in early-afternoon trading Friday.
Below, we take a closer look at United’s chart and use technical analysis to point out major price levels worth watching.
Descending Broadening Formation in Focus
United shares have trended lower within a descending broadening formation since mid-February. More recently, the price ran into selling pressure near the pattern’s upper trendline and 200-day moving average during Wednesday’s rally that saw the stock register its highest daily volume since October last year.
Meanwhile, the relative strength index (RSI) has recovered above oversold levels but remains below the indicator’s neutral 50 reading.
Let’s identify several major support and resistance levels on United’s chart.
Major Support Levels to Monitor
Descending prices could see the shares initially fall to around $56. Investors may look for buying opportunities on a retracement to this week’s lows, which closely align with several prominent peaks on the chart extending back to June 2023.
The next lower level to watch sits at $48. This area may provide support near notable peaks on the chart in April and July last year, and depending on the timing of such a move, gain further confluence from the descending broadening formation’s lower trendline.
Crucial Resistance Levels to Watch
Further buying from current levels could see the shares take flight to around $81. Investors who have accumulated the stock at lower prices may look for exit points in this region near last month’s swing high and the upper level of a brief consolidation period that preceded November’s post-election breakaway gap.
Finally, buying above this level sets the stage for a retest of overhead resistance around $91. United shares may encounter selling pressure in this location near last December’s pullback low and a minor countertrend high that emerged on the chart in early March.
The comments, opinions, and analyses expressed on Investopedia are for informational purposes only. Read our warranty and liability disclaimer for more info.
As of the date this article was written, the author does not own any of the above securities.

Leave a Reply