
Key Takeaways
- Ford shares rose Tuesday after the automaker reported quarterly results that topped Wall Street expectations and suspended its full-year forecast amid uncertainty about tariffs.
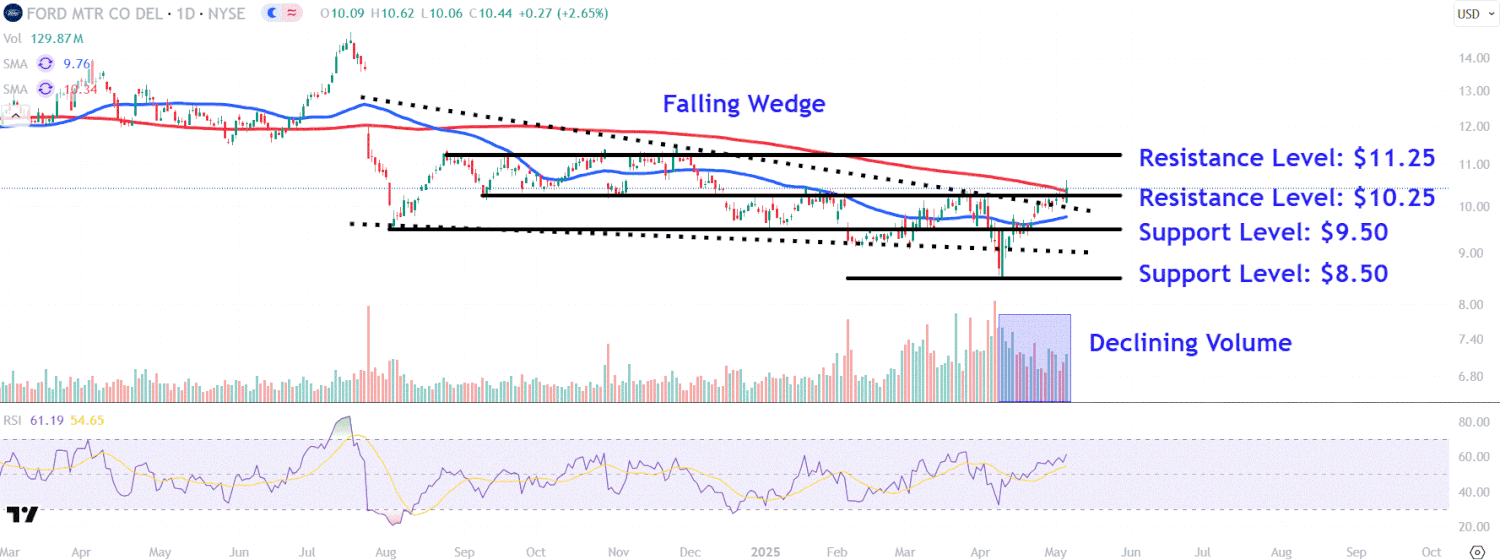
- The stock recently broke out above the upper trendline of a falling wedge pattern but has encountered resistance near the closely watched 200-day moving average.
- Investors should watch crucial support levels on Ford’s chart around $9.50 and $8.50, while also monitoring important resistance levels near $10.25 and $11.25.
Ford (F) shares closed higher on Tuesday, one day after the automaker reported quarterly results that topped Wall Street expectations and suspended its full-year forecast amid auto tariff worries.
Although the company pulled its annual guidance, it said it expects tariffs to reduce adjusted earnings by $1.5 billion this year, putting a number on the impact of the Trump administration’s hefty auto import duties. The news comes after rival General Motors (GM) recently slashed its outlook, warning that auto tariffs could have a $4 billion to $5 billion impact on its full-year profit.
Ford shares gained 2.7% on Tuesday to close at $10.44. The stock is down more than 16% over the past 12 months as challenges in the company’s EV division and ongoing tariff concerns weigh on investor sentiment, though it’s gained more than 20% from its early-April low.
Below, we take a closer look at Ford’s chart and apply technical analysis to locate crucial price levels worth watching out for.
200-Day Moving Average Provides Resistance
Ford shares oscillated within a falling wedge pattern between July last year and April, potentially indicating a long-term accumulation phase.
More recently, the stock broke out above the pattern’s upper trendline but has encountered resistance near the closely watched 200-day moving average (MA).
It’s also worth noting that trading volume has declined during the current move higher, suggesting that larger market participants, such as institutional investors and hedge funds, remained on the sidelines ahead of the automaker’s quarterly report.
Let’s identify crucial support and resistance levels on Ford’s chart that investors will likely be watching.
Crucial Support Levels to Watch
The first lower level to watch sits around $9.50. The shares could find support in this area near a trendline that connects a range of corresponding price action on the chart stretching from August to April.
Selling below this level could see the shares revisit lower support at $8.50. Investors may seek buying opportunities in this region near last month’s prominent swing low, which also marked a bear trap in the stock, a trading event that lures investors to sell upon a breach of major support—the falling wedge pattern’s lower trendline in this case—before the price makes a swift reversal.
Important Resistance Levels to Monitor
Coming into Tuesday’s trading session, $10.25 was a key level. This area on the chart, just below the downward sloping 200-day MA, was susceptible to selling pressure near a trendline that linked an array of peaks and troughs on the chart extending back to last September.
A sustained breakout above this level could drive a move toward $11.25. Investors who have bought Ford shares at lower prices may look for profit-taking opportunities in this area near several peaks that developed on the chart between August and November last year.
CORRECTION: The chart in this story has been updated to correctly identify a trading pattern as a falling wedge pattern.
The comments, opinions, and analyses expressed on Investopedia are for informational purposes only. Read our warranty and liability disclaimer for more info.
As of the date this article was written, the author does not own any of the above securities.
Leave a Reply