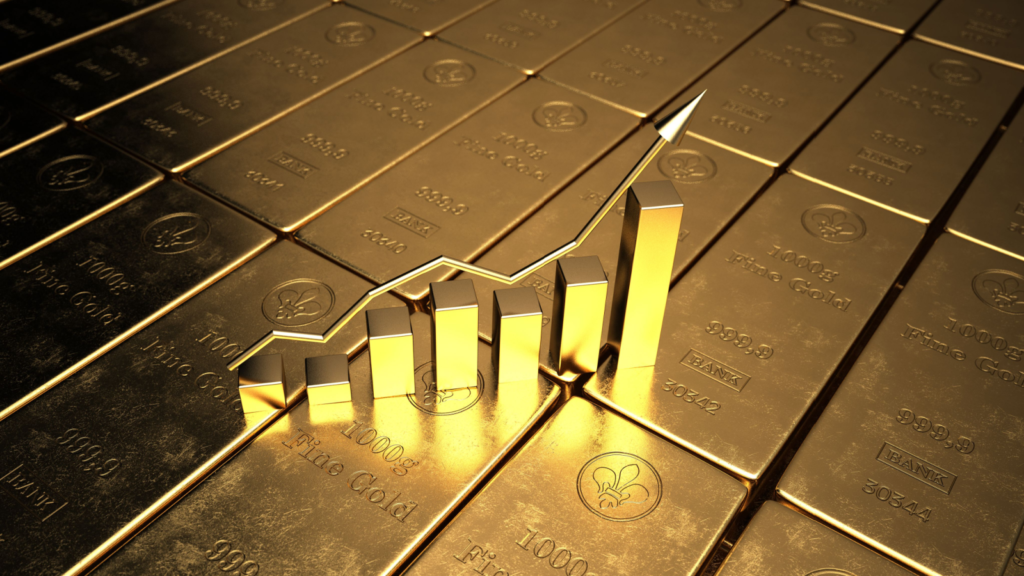
Why April’s Inflation Data Proves the Fed Is Chasing Ghosts
I have been saying this for a while now, but I think the Federal Reserve is fighting a mythical “boogeyman” that doesn’t exist.
According to Fed Chairman Jerome Powell, the Fed wants “greater confidence” that inflation is cooling. And not just in headline numbers, but in core services and housing, where inflation has remained stubbornly sticky.
So, the Fed’s decision to hold key interest rates steady last week was no surprise. And it wasn’t a shock either to learn that they are still in “wait-and-see” mode. But as I mentioned in a Market 360 article last week, I think they’re making a mistake.
In short, that’s because I think the effect of tariffs on prices is overblown. As I’ve explained previously, much of the baseline 10% tariffs will be absorbed by a strengthening dollar. And now that just about every country is coming to the negotiating table, I think the end result will be not only free trade, but fairer trade for the U.S.
However, I will acknowledge that this will take some time, folks.
That’s where this week’s economic data comes in…
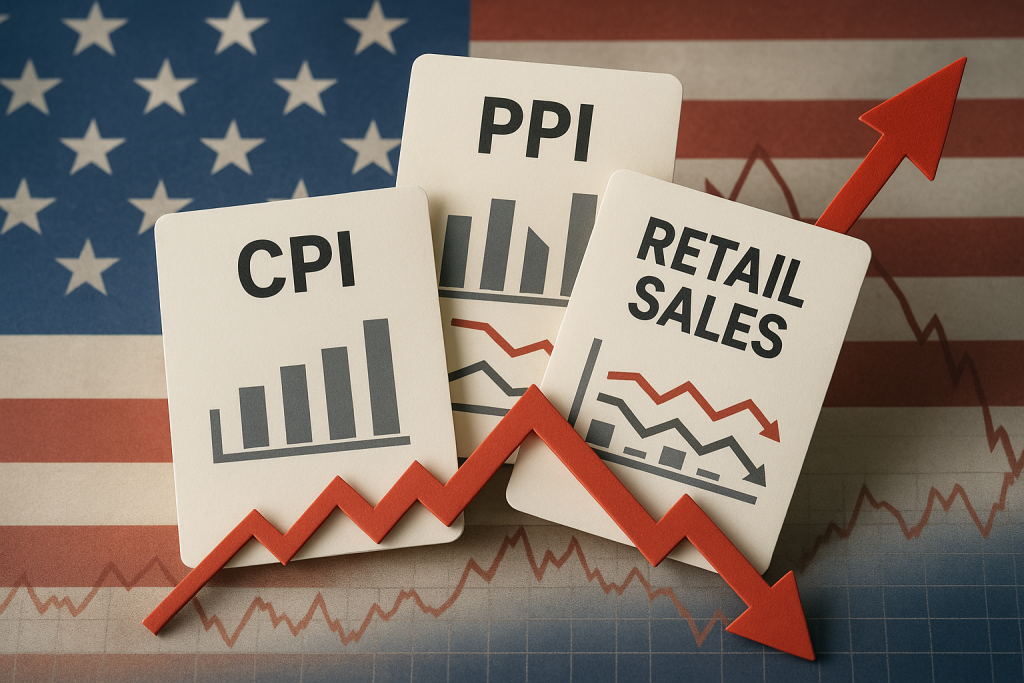
The April Consumer Price Index (CPI) and Producer Price Index (PPI) reports offer fresh insight into whether inflation is continuing to ease – or if tariffs are having an impact on prices, as many feared.
Meanwhile, the April retail sales report will show us whether the American consumer is still spending – or finally starting to slow down under the weight of high interest rates.
Simply put, the Fed’s next move could hinge on this data. If inflation shows real signs of retreat and consumer demand cools just enough, the path to rate cuts later this year remains open.
That’s why, in today’s Market 360, I want to dig into the details of these three reports.
Let me be clear, folks. I think the Fed needs to wake up and start cutting rates now, rather than later. I’ve said this too many times to count, but the reality is we’re in the middle of a global interest rate collapse, and our central bank will have to eventually play catch-up.
They might as well start with the rate cuts now, because, as I’ll explain in a moment, a far bigger threat is on the horizon that investors need to be preparing for… one I am sure many folks are missing because of all of this tariff and interest rate drama.
We’ve got a lot to cover today, so let’s dive in.
Consumer Price Index
Tuesday’s CPI report was further confirmation of what I have been saying – inflation is moderating and the Federal Reserve needs to cut key interest rates sooner rather than later.
In April, consumer prices rose just 2.3% over the past year, down from 2.4% in March and below expectations for 2.4%. That’s the slowest pace since February 2021. Month over month, prices rose just 0.2%. That’s lower than the 0.3% estimated by economists.
Core CPI, which excludes food and energy, rose 0.2% in April and was up 2.8% over the last year. Expectations were for a 0.1% monthly rise and a 2.8% yearly increase.
Digging a little deeper, the energy index rose 0.7%, driven by increases in natural gas (up 3.7%) and electricity (up 0.8%).
Meanwhile, after rising 0.4% in March, food prices fell 0.1% as food at home decreased 0.4%. The fact is five of the six major grocery store food group indexes decreased in April. After months of soaring egg prices, we saw a 12.7% drop in April.
The chart below does a great job of showing where inflation is high, and where it isn’t…

Now, as I noted above, shelter costs have been a sticking point for the Fed. And in April, it rose 0.3%, representing more than half of the total increase for the month.
Producer Price Index
Today’s PPI report showed an unexpected drop. The PPI fell 0.5% in April, compared to expectations for a 0.3% increase. This marks the largest monthly drop in wholesale prices in over five years – since the pandemic.
Excluding food, energy and trade, “core” PPI declined 0.1%, or 2.9% year-over-year. Economists were looking for a 0.3% rise.
The biggest surprise was that wholesale service costs plunged 0.7%, the biggest drop in data going back to 2009.
Looking further into the report, wholesale goods prices rose 0.2%, food prices dropped 1% and wholesale energy prices declined 0.4%.
So overall, the PPI demonstrated that despite all the trade chaos, wholesale prices are falling due to lackluster economic activity as well as surplus goods being dumped into America ahead of the tariffs.
Retail Sales
The other report today was April retail sales. Retail sales rose only 0.1% in April, although March numbers were revised up to 1.7% from a previously reported 1.4%.
Looking into the details of this report, here are your green shoots:
- Sales at bars and restaurants were up 1.2%
- Building material and garden sales rose 0.8% in April, which is probably due to the good weather and everybody sprucing up their gardens
- Sales at gas stations declined 0.5% due to lower prices at the pump
The big surprise was that vehicle sales declined 0.1% in April. There were multiple reports that consumers were buying vehicles to beat the tariffs. That’s proving to be unfounded (though it may have helped the March number).
The bottom line is this was just a messy report, folks.
Online sales were up 0.2%, but department stores and sporting goods and all that stuff were down sharply. So we have a fickle consumer – but hey, when they’re out drinking at bars and restaurants, that’s a good sign.
Overall, only 5 of the 13 sectors that the Commerce Department surveyed increased. So, let’s just throw the April retail sales report away and we’ll go from there.
Don’t Forget to Look Behind the Scenes…
These reports just show you that the economists can’t hit the broad side of a barn right now.
Most of them are misreading the situation. They are so preoccupied with the tariffs that they are missing the signs of a weakening economy, a fickle consumer – and, perhaps most importantly, a global interest rate collapse.
Next month, the European Central Bank is going to cut key rates again – it’s already cut seven times in the past year.
The lowest rates are actually in China. They’re really hurting, and they have a widespread deflation problem. There are even rumblings of a currency devaluation because their rates are so low that they can’t do anything else.
So, the pressure is mounting. I hope this week’s evidence is going to make the Fed cut. But I doubt it. The Fed seems to be very stubborn right now.
The best thing we can hope for is that the global interest rate collapse forces our bond market rates low enough to force their hand.
Another reason I hope the Fed cuts rates soon is because a lot of folks are frankly distracted right now. They’re worried about the implications of the tariffs, high interest rates are hurting their pocketbook, and they have no idea of what’s going on behind the scenes in this economy.
The fact is, we are in a period of dramatic upheaval that is only getting started.
And it’s all thanks to what I’m calling the Economic Singularity.
This isn’t just another market cycle or recession. It’s a fundamental restructuring of how wealth is created, how work is valued and who gets left behind. And inflation plays no role in this. It is happening regardless of what the inflation reports say, whether the Fed cuts rates or continues to hold steady.
Make no mistake: This could either cost you dearly or make you significantly wealthier.
That’s why I’ve broken my silence and filmed a special video to explain what’s happening.
I urge you to watch my new presentation now.
The sooner you understand what’s really unfolding – and position yourself accordingly – the better off you’ll be when this shift accelerates.
Sincerely,

Louis Navellier
Editor, Market 360