Five Things to Know about BNPL Provider Klarna Ahead of Its IPO


Key Takeaways

  • Klarna, a buy now, pay later provider, said in its IPO prospectus that it was profitable for several years, but earnings came under pressure when it expanded in the US.
  • The company said in its most mature market, Sweden, a majority of adults paid with Klarna in 2024.
  • Klarna aims to bolster its advertising and retail banking business lines, according to its paperwork.

Klarna, which helped popularize buy now, pay later plans, filed a prospectus to hold an initial public offering earlier this month, offering details about its growth over the past two decades.

The company’s buy now, pay later plans caught on with Swedish consumers, who could take home their purchases, while paying a portion of their bill and agreeing to have further installments deducted from their account in the coming weeks.

Klarna has since expanded to 25 other countries, partnered with 675,000 merchants and taken payments from 93 million consumers. The company said it handled an average of 2.9 million transactions daily in 2024, with underwriting decisions on short-term loans made in seconds using a “fully automated process.”

The filing didn’t include details about how many shares Klarna intends to sell, or at what price. Here’s a look at what the company did have to say.

US Growth Has Squeezed Profits Lately

Klarna made money for its first 14 years, but said its profits came under pressure when it launched in the US in 2019.

It calls 2023 an inflection point because that’s when it achieved the scale needed in America to generate positive margins. Klarna reported a $21 million profit in 2024 after two years of losses. Klarna’s revenue has grown nearly 48% over the past three years, from $1.9 billion in 2022 to $2.8 billion in 2024.

Klarna Has Several Revenue Streams

Nearly 64% of revenue last year came from merchants. Klarna charges retailers transaction fees when their consumers pay using the service, and several big names offer Klarna at checkout, including Uber (UBER), Apple (AAPL), Macy’s (M) and Wayfair (W). (Klarna recently signed on Walmart (WMT) and DoorDash (DASH) the company said.)

Merchants also pay to advertise on Klarna’s website and app, and to have their products prominently displayed in users’ search results.

Another 12% of revenue last year involved consumer payments, such as “reminder” fees for late payments, the company said. Consumer payments also includes money from Klarna Plus, a roughly $8-a-month subscription plan that comes with deals and waived service fees, the company said.

The remaining 24% related to interest—both interest paid by borrowers and interest Klarna earned on investments.

Basic Payment Processing Is Playing a Smaller Role at Klarna

Klarna handles three types of transactions, including basic payment processing, where funds are immediately transferred.

About 26% of gross merchandise value—or the total cost of items sold via Klarna—in 2022 were paid for outright, but that fell to 16% in 2024, the company said. During that period, Klarna’s “Pay Later” product, where consumers delay or divide a payment into installments, went from 70% of GMV in 2022 to 79% in 2024, Klarna said.

The share of GMV paid for with short-term loans, which can carry interest, ticked up slightly during these three years.

Swedes Use Klarna for a Range of Purchases

In its filing, the company compared the scope of its operations in Sweden and the U.S., showing the role it can play in a mature market.

About 82% of adults in Sweden used Klarna last year, and they had an average of 32 transactions each, the company said. Their spending was fairly evenly distributed across categories including apparel and accessories, health and beauty, home and electronics, food and beverage and leisure.

In the US, nearly 10% of adults paid with Klarna in 2024—about five years after the company launched in the States. Americans had an average of more than five purchases that year, and 69% of their spending was concentrated in apparel and accessories, the company said.

Klarna Says it Has Room to Grow

Klarna envisions growing by working with more merchants, operating in new regions and drawing in additional consumers.

The company wants to build up two revenue streams. Klarna, which has a banking license from Sweden, wants to boost its retail banking business, which held $9.5 billion in deposits for consumers at the end of 2024.

Klarna also wants to scale its advertising business, which brought in $180 million, or more than 6% of all revenue last year.


Source link

Nio Stock Slips on Wider Loss Than Expected, Disappointing Sales


Key Takeaways

  • Nio’s U.S.-listed shares moved lower Friday after the electric vehicle maker’s fourth-quarter results missed estimates.
  • Revenue and deliveries each fell short, as Nio also reported a larger loss than expected.
  • The Chinese company’s first-quarter projections were also below analysts’ forecasts.

The U.S.-listed shares of Chinese electric vehicle maker Nio (NIO) fell Friday morning after its fourth-quarter sales fell short of analysts’ expectations.

The EV maker said Friday it lost an adjusted 3.17 Chinese yuan ($0.44) per share, wider than the 2.49 yuan ($0.34) per share loss that analysts expected. The loss came on $2.7 billion in revenue, nearly half a billion dollars short of the analyst consensus compiled by Visible Alpha.

Nio delivered 72,689 vehicles in the final quarter of 2024, also short of the 73,144 vehicles that analysts had forecast.

The company said it expects to deliver 41,000 to 43,000 vehicles in the first quarter, generating $1.69 billion to $1.76 billion. Nio’s forecasts are well below the current analyst consensus of 62,240 deliveries and $2.36 billion in revenue.

The EV maker also missed estimates last quarter, and said again in this quarter that lower average selling prices negatively impacted revenue as a number of Chinese competitors have cut prices to gain market share.

Nio’s U.S.-listed shares were down around 4% premarket Friday following an 8% drop Thursday. They entered the day down nearly 8% over the last 12 months.


Source link

London’s Heathrow Airport Shuts as Substation Fire Causes Power Outage


KEY TAKEAWAYS

  • London’s Heathrow Airport, one of the world’s busiest, closed for the day Friday following a fire at a nearby substation that caused a power outage.  
  • The airport operator said that the hub would remain closed until 11:59 p.m. local time (07:59 p.m. ET) on Friday. 
  • The closure has caused widespread disruption, with more than 1,350 flights canceled today, according to FlightRadar24. 

London’s Heathrow Airport, one of the world’s busiest, closed for the day Friday following a fire at a nearby substation that caused what it called a “significant” power outage.

The airport operator said that the hub would remain closed until 11:59 p.m. local time (07:59 p.m. ET) on Friday. The closure has caused widespread disruption, with more than 1,350 flights canceled today, according to FlightRadar24.

“Due to a fire at an electrical substation supplying the airport, Heathrow is experiencing a significant power outage,” Heathrow said, adding that passengers shouldn’t travel to the airport.

British Airways said that the outage will “clearly have a significant impact on our operation and our customers and we’re working as quickly as possible to update them on their travel options for the next 24 hours and beyond.”  Shares of British Airways parent International Consolidated Airlines Group were down 2% in London trading. 

According to data provider OAG, Heathrow is the world’s second-busiest international airport by capacity this month, with just over 4 million seats, and fifth-busiest airport at about 4.3 million seats if you include domestic flights. The airport handled a record 83.9 million passengers in 2024, Heathrow said in January.


Source link

Watch These Micron Price Levels as Stock Rises After AI-Driven Earnings Beat


Key Takeaways

  • Micron shares moved higher in extended trading Thursday after the chipmaker posted better-than-expected results and issued a strong outlook, bolstered by surging demand for AI. 
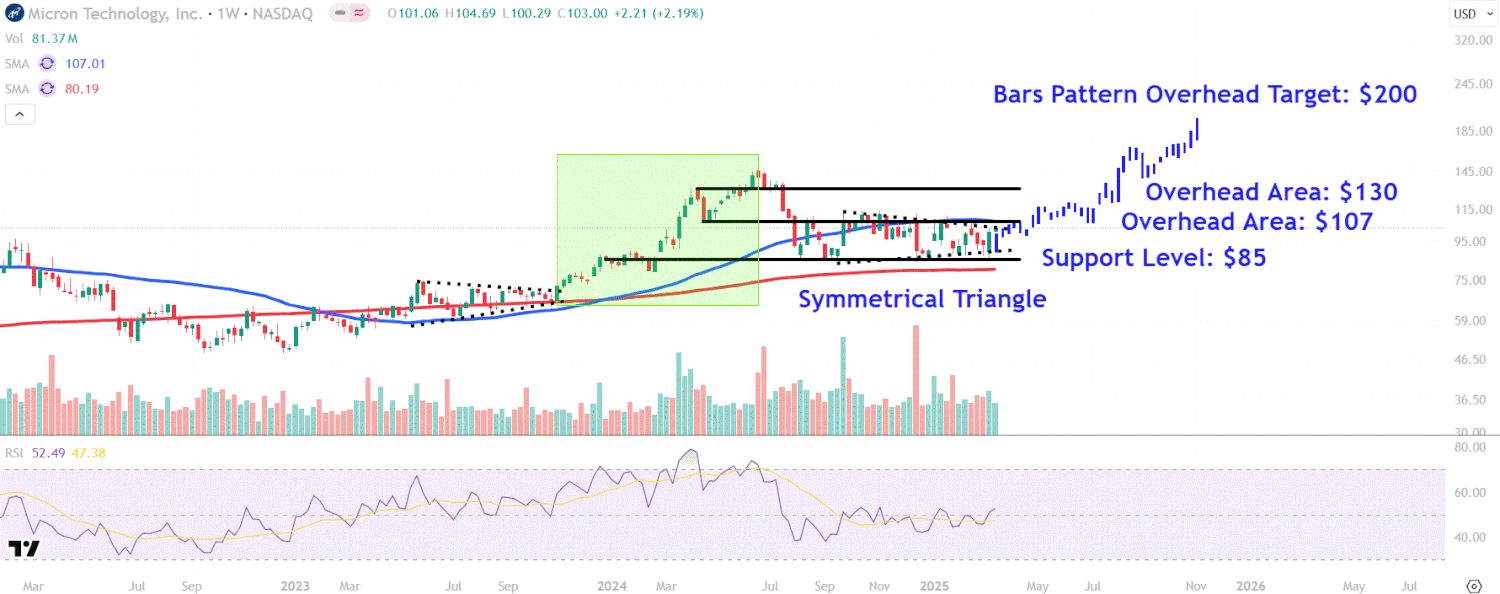
  • The stock recently found buying interest near the lower trendline of a symmetrical triangle and could break out above the pattern in Friday’s trading session after the company’s upbeat results.
  • Investors should watch key overhead areas on Micron’s chart around $107, $130, and $200, while also monitoring a crucial support level near $85.

Micron Technology (MU) shares moved higher in extended trading Thursday after the chipmaker posted better-than-expected results and issued a strong outlook, bolstered by surging demand for AI.

The memory chip maker and Nvidia (NVDA) partner saw its data center revenue triple in the fiscal second quarter from a year earlier amid strong demand for its high-bandwidth memory chips used in systems that develop and run AI software.

Micron shares have gained 22% since the start of the year as of Thursday’s close, though trade just 7% higher over the past 12 months as surging demand for the company’s AI offerings has been partially offset by modest demand for its chips used in smartphone and PCs. The stock rose 1% to $104 in after-hours trading Thursday.

Below, we break down the technicals on Micron’s weekly chart and point out key price levels worth watching out for.

Potential Symmetrical Triangle Breakout

Micron shares have traded within a symmetrical triangle since September last year, potentially forming a continuation pattern ahead of another move higher.

More recently, the stock found buying interest near the triangle’s lower trendline and could break out above the pattern in Friday’s trading session after the company’s upbeat results.

Let’s apply technical analysis to Micron’s chart to identify three key overhead areas that investors will likely be watching and also locate a crucial support level worth monitoring during pullbacks in the chipmaker’s stock.

Key Overhead Areas to Watch

Earnings-driven buying above the symmetrical triangle could see the shares initially make a move up to the $107 level. This area provides overhead resistance near the 50-week moving average and a horizontal line that connects a series of price points on the chart stretching back to April 2024.

A move above this area could spark a rally to around $130. Investors who have accumulated shares at lower levels may look for exit points in this region near last year’s April peak, which also closely aligns with a range of closing prices positioned just below the stock’s all-time high (ATH) set in June last year.

To forecast a potential upside target above the ATH, investors can use bars pattern analysis. To apply this technique, we take the price bars that make up the stock’s uptrend from October 2023 to June last year and overlay them from this month’s low. The analysis projects a target of around $200, nearly double Micron’s Thursday closing price.

We selected this prior trend as it followed an earlier symmetrical triangle on the chart, providing insight as to how a future move higher in the stock may play out..

Crucial Support Level to Monitor

During pullbacks in Micron shares, investors should keep tabs on the $85 level. The stock would likely find support in this area near a range of lows extending back to August last year and a consolidation period that formed on the chart in December 2023 and January 2024.

The comments, opinions, and analyses expressed on Investopedia are for informational purposes only. Read our warranty and liability disclaimer for more info.

As of the date this article was written, the author does not own any of the above securities.


Source link

Watch These Intel Stock Price Levels After Recent Rally Stalls


Key Takeaways

  • Intel shares fell slightly Thursday after a steep downturn the previous session that snapped a five-day winning streak, during which the stock gained about 30%. 
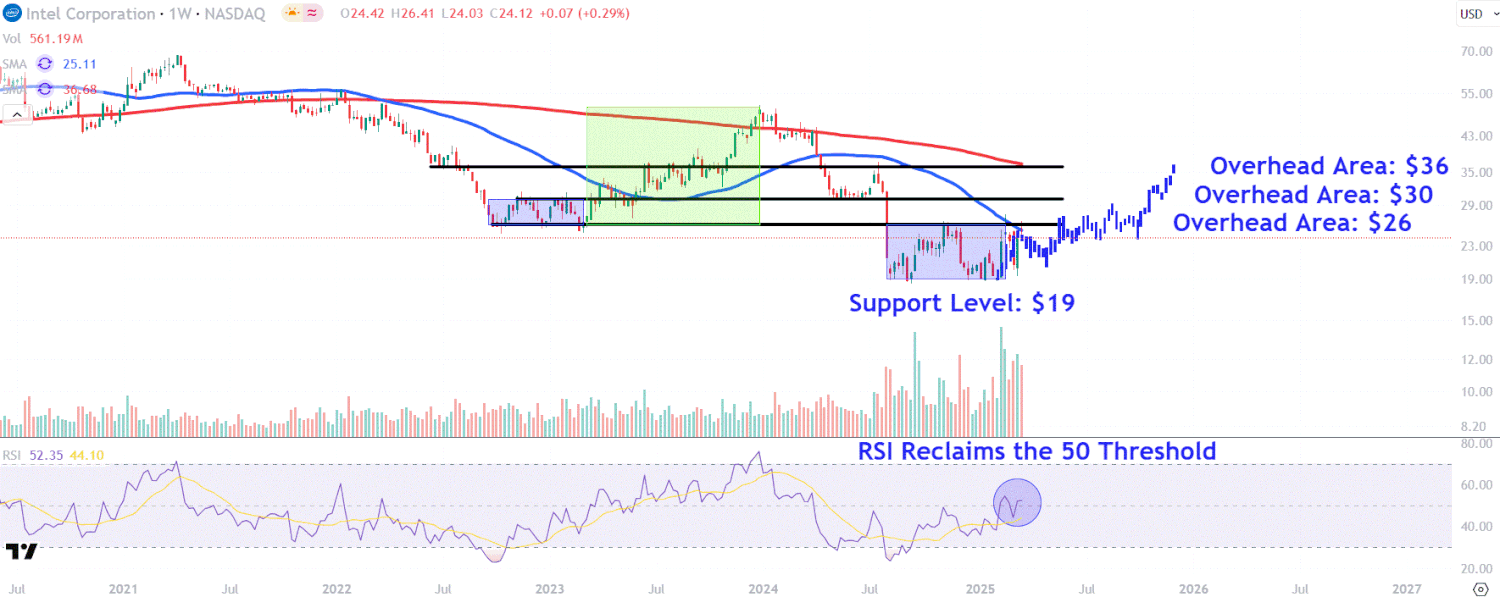
  • Since the stock’s steep drop in early August last year, the price has oscillated within an orderly trading range, potentially carving out a rectangle bottom.
  • Investors should watch key overhead areas on Intel’s chart around $26, $30 and $36, while also monitoring an important support level near $19.

Intel (INTC) shares fell slightly Thursday after a steep downturn the previous session that snapped a five-day winning streak for the embattled chipmaker.

The stock surged about 30% during the week-long run, which came as Intel named Lip-Bu Tan as its new CEO and amid fresh reports that the company could sell parts of its business. The stock fell 7% on Wednesday as reports emerged that threw cold water on some of the latest deal speculation.

Despite the recent rally, Intel shares are down 43% over the past 12 months amid the company’s inability to make inroads into the booming AI chip market and months of restructuring and deal rumors. The stock fell 0.7% to around $24 on Thursday.

Below, we take a closer look at Intel’s weekly chart and use technical analysis to identify key price levels worth watching.

Potential Rectangle Bottom

Since Intel’s steep drop in early August last year, the price has oscillated within an orderly trading range, potentially carving out a rectangle bottom similar to a rangebound period that preceded a trending move in the stock between February and December 2023.

More recently, the shares have tested the respected 50-week moving average over the past five weeks but have met selling pressure on each occasion.

In a win for the bulls, the relative strength index (RSI) has reclaimed the 50 threshold, indicating improving price momentum. Trading volume has also increased in recent weeks, suggesting growing investor interest in the stock.

Let’s identify three key overhead areas on Intel’s chart that investors may be watching and also point out an important support level that would likely attract interest during potential retracements.

Key Overhead Areas to Watch

The first overhead area to watch sits around $26. This level finds a confluence of resistance from the 50-week moving average and a horizontal line that connects the lower and upper ranges of the two rectangle patterns on Intel’s chart.

A decisive breakout above this level could trigger a move to the key $30 area. Investors may look to lock in profits in this region near the psychological round number and a series of peaks and troughs that formed on the chart between November 2022 and June last year.

Follow-through buying may see the shares climb to around $36, a location where they could run into selling pressure near the downward sloping 200-week moving average, which closely aligns with a range of price action on the chart stretching back to June 2022.

This area also roughly corresponds with a projected bars pattern price target that extracts the stock’s trending move from February to December 2023 and repositions it from last month’s low, predicting what a move higher might look like if price history rhymes.

Important Support Level to Monitor

Finally, during retracements in Intel shares, investors should keep a close eye on the $19 level. Investors may view this area as a trading floor near the low of the rectangle pattern.

The comments, opinions, and analyses expressed on Investopedia are for informational purposes only. Read our warranty and liability disclaimer for more info.

As of the date this article was written, the author does not own any of the above securities.


Source link

Carvana Stock Rises as Piper Sandler Advises Buying the Dip After Recent Selloff


Key Takeaways

  • Carvana shares gained Thursday as analysts at Piper Sandler advised buying the dip in the company’s stock after a recent selloff.
  • The online used car retailer could stand to increase its market share tenfold over the long term, Piper Sandler said.
  • The analysts also suggested Carvana could be well insulated from the impact of new tariffs.

Carvana (CVNA) shares gained Thursday as analysts at Piper Sandler advised buying the dip in the online used car retailer’s stock after a recent selloff.

Carvana’s stock has lost roughly a third of its value since the company reported quarterly results in February. Piper Sandler analysts told clients they would “accumulate” shares, and reiterated a $225 price target, implying more than 20% upside from Thursday’s close. The consensus of analysts tracked by Visible Alpha is even higher, at about $287.

The company currently has a roughly 1% share of the used car market, Piper Sander said, but the analysts expect that could eventually grow to more than 10%. They said Carvana could go from 416,000 vehicles sold last year to over 3 million in the long term. 

Piper Sander also suggested Carvana could be particularly well insulated from the impact of new tariffs. That’s in part because used cars are primarily sold domestically, the analysts said, but also because Carvana could have room to grow its sales even if the broader used car market struggles. 

Shares of Carvana added over 5% Thursday to close at $185.42. Even with the recent selloff, its shares have more than doubled in value over the past 12 months. 


Source link

Stop Chasing Returns and Start Getting Rising Dividends With These 10 Blue Chip Stocks


Published on March 20th, 2025 by Bob Ciura

Many investors have a desire to ‘beat the market’.

This sounds like a good goal. After all, the market is ‘just average’, so it would make sense to at least beat average.

But instead of focusing on an arbitrary benchmark or compounding target (‘I want to compound at 20% annually’ as an example), I believe it makes more sense to focus on the reason you are investing.

Broadly, that’s to make money. But more specifically, the point of dividend growth investing is to build a rising passive income stream.

And the underlying purpose there is to have a growing passive income stream that exceeds your expenses – so you have true, lasting financial freedom.

The securities you select for your dividend growth portfolio in order to achieve lasting financial freedom through rising passive income certainly matter.

That’s where dividend growth stocks come in–more specifically, blue chip stocks that have increased their dividends for at least 10 consecutive years.

You can download our free blue chip stocks list with important financial metrics such as dividend yields and price-to-earnings ratios, by clicking on the link below:


There are currently more than 500 securities in our blue chip stocks list.

Blue-chip stocks are established, financially strong, and consistently profitable publicly traded companies.

Their strength makes them appealing investments for comparatively safe, reliable dividends and capital appreciation versus less established stocks.

Instead of chasing returns, investors can start building long-term passive income through dividend growth stocks.

The following 10 blue chip stocks have increased their dividends for at least 10 years, and have Dividend Risk Scores of ‘C’ or better in the Sure Analysis Research Database, plus the highest dividend growth.

The 10 blue chip stocks are sorted by dividend growth rate.

Table of Contents

The table of contents below allows for easy navigation.

Blue Chip #10: Raymond James Financial (RJF)

  • Dividend History: 13 years of consecutive increases
  • Dividend Growth: 13.0%

Raymond James Financial (RJF) is a financial holding company whose major operations include wealth management, investment banking, asset management, and commercial banking. Approximately 90% of the company’s revenue is from the U.S., and 74% of fiscal 2024 revenue is from the company’s Private Client Group (wealth management) segment.

Other segments are Capital Markets (11% of revenues), Asset Management (8%), and Banking (7%). The company has more than 19,000 employees and supports 8,900 financial advisors across the United States, Canada, and the United Kingdom.

On January 29th, 2025, Raymond James Financial released results for its first quarter of fiscal year 2025 for the period ending December 31st, 2024.

For the quarter, the company reported a net income of $599 million, which is flat compared to the preceding quarter’s net income of $601 million, and a 21% increase compared to the same quarter in the previous year.

Earnings per diluted share for the quarter were $2.86, the same as in the preceding quarter, and up from $2.32 in the same quarter of the previous year. Strong performances in investment banking and brokerage contributed positively to the Capital Markets segment’s outcomes.

Click here to download our most recent Sure Analysis report on RJF (preview of page 1 of 3 shown below):

Blue Chip #9: Intuit Inc. (INTU)

  • Dividend History: 13 years of consecutive increases
  • Dividend Growth: 13%

Intuit is a cloud-based accounting and tax preparation software giant, headquartered in Mountain View, California. Its products provide financial management, compliance, and services for consumers, small businesses, self-employed workers, and accounting professionals worldwide.

Its most popular platforms include QuickBooks, TurboTax, Mint, and TSheets. Cumulatively they serve more than 100 million customers. The company recorded $16.3 billion in revenues last year and is headquartered in Mountain View, California.

On February 25th, 2025, Intuit published its fiscal Q2 results for the period ending January 31st, 2025. This was another solid quarter, with “Global Business Solutions Group” revenues up 19% year-over-year.

Specifically, QuickBooks Online Accounting revenues grew 22% year-over-year, driven by customer growth, higher effective prices, and mix-shift.

Adjusted EPS for the quarter grew by 26% to $3.32 compared to FQ2 2024.

Management reiterated its revenue and nonGAAP EPS guidance for FY2025. Revenues are expected to be in a range of $18.160 billion to $18.347 billion, implying a growth rate between 12% and 13% from last year.

Adjusted EPS is expected to be between $19.16 and $19.36. This implies a year-over-year growth of 18% to 19%.

Click here to download our most recent Sure Analysis report on INTU (preview of page 1 of 3 shown below):

Blue Chip #8: Visa Inc. (V)

  • Dividend History: 16 years of consecutive increases
  • Dividend Growth: 13%

Visa is the world’s leader in digital payments, with activity in more than 200 countries. The company’s global processing network provides secure and reliable payments around the world and is capable of handling more than 65,000 transactions a second.

On January 30th, 2025, Visa reported first quarter 2025 results for the period ending December 31st, 2024. (Visa’s fiscal year ends September 30th.)

For the quarter, Visa generated revenue of $9.5 billion, adjusted net income of $5.5 billion and adjusted earnings-per-share of $2.75, marking increases of 10%, 11% and 14%, respectively.

These results were driven by a 9% gain in Payments Volume, a 16% gain in Cross-Border Volume and an 11% gain in Processed Transactions. Visa processed 63.8 billion transactions in the quarter.

Click here to download our most recent Sure Analysis report on Visa (preview of page 1 of 3 shown below):

Blue Chip #7: Apple Inc. (AAPL)

  • Dividend History: 12 years of consecutive increases
  • Dividend Growth: 13.9%

Apple is a technology company that designs, manufactures, and sells products such as iPhones, iPads, Mac, Apple Watch and Apple TV. Apple also has a services business that sells music, apps, and subscriptions.

On January 30th, 2025, Apple reported financial results for the first quarter of fiscal year 2025 (Apple’s fiscal year ends the last Saturday in September).

Total sales grew 4% over the prior year’s quarter, to a new record of $124.3 billion, thanks to sustained growth in iPhone, iPad and Wearables across all regions.

Earnings-per-share grew 10%, from $2.18 to $2.40, and exceeded the analysts’ consensus by $0.05. Notably, Apple has missed the analysts’ estimates only once in the last 25 quarters.

Going forward, Apple’s earnings growth will be driven by several factors. One of these is the ongoing cycle of iPhone releases, which creates lumpy results. In the long run, Apple should be able to grow its iPhone sales, albeit in an irregular fashion.

Click here to download our most recent Sure Analysis report on AAPL (preview of page 1 of 3 shown below):

Blue Chip #6: UnitedHealth Group (UNH)

  • Dividend History: 15 years of consecutive increases
  • Dividend Growth: 14%

UnitedHealth dates back to 1974 when Charter Med was founded by a group of health care professionals looking for ways to expand healthcare options for consumers.

The company has two major reporting segments: UnitedHealth and Optum. The former provides global healthcare benefits to individuals, employers, and Medicare/Medicaid beneficiaries. The Optum segment is a services business that seeks to lower healthcare costs and optimize outcomes for its customers.

UnitedHealth posted fourth quarter and full-year earnings on January 16th, 2025, and results showed a rare miss on the top line. Despite the fact that shares were well off their highs prior to the report, the stock declined anyway as the company disappointed investors for the first time in a while.

Adjusted earnings-per-share came to $6.81, which was seven cents ahead of estimates. However, revenue was up only 6.8% to $100.8 billion, missing by almost a billion dollars.

UnitedHealthcare saw revenue of $74.1 billion during the quarter, missing consensus by $1.3 billion. OptumRx posted $35.8 billion of revenue, up 15% year-over-year and beating estimates. OptumHealth saw 5% growth year-over-year to $25.7 billion, also beating estimates.

The company’s medical care ratio was 85.5% in 2024, a deterioration of about 230 basis points year-over-year. This was attributable to increased Medicare funding reductions and member mix, primarily. The company issued guidance for this year of $29.50 to $30.00 in adjusted earnings-per-share.

Click here to download our most recent Sure Analysis report on UNH (preview of page 1 of 3 shown below):

Blue Chip #5: Mastercard Inc. (MA)

  • Dividend History: 14 years of consecutive increases
  • Dividend Growth: 15%

MasterCard is a world leader in electronic payments. The company partners with 25,000 financial institutions around the world to provide an electronic payment network. MasterCard has more than 3.1 billion credit and debit cards in use.

On January 30th, 2025, MasterCard announced fourth quarter and full year results for the period ending December 31st, 2024.

For the quarter, revenue improved 15.4% to $7.5 billion, which was $120 million above estimates. Adjusted earnings-per-share of $3.82 compared favorably to $3.18 in the prior year and was $0.13 more than expected.

For the year, revenue grew 12% to $28.2 billion while adjusted earnings-per-share of $14.60 compared to $12.26 in 2023.

On a local currency basis, gross dollar volumes for the quarter grew 12% worldwide to $2.56 trillion during the quarter, with the U.S. improving 9% and the rest of the world higher by 13%.

Cross border volumes remained strong, growing 20% from the prior year and 17% from Q3 2024.

Click here to download our most recent Sure Analysis report on Mastercard (preview of page 1 of 3 shown below):

Blue Chip #4: Zoetis Inc. (ZTS)

  • Dividend History: 11 years of consecutive increases
  • Dividend Growth: 15%

Zoetis is a drug company that focuses on animal health, including discovering, developing, manufacturing, and commercialising medicines, vaccines, and diagnostic products.

Biodevices, genetic tests, and precision livestock farming complement the company’s offerings. The Vaccine segment is the largest revenue generating segment, with 22% of the total revenue, while the United States generates 54% of the revenue.

On February 13th, 2025, Zoetis Inc. reported strong financial results for the fourth quarter of 2024, with revenue reaching $2.3 billion, a 5% increase from the previous year and up 6% on an operational basis. The company experienced growth in both its U.S. and International segments, driven primarily by strong demand for companion animal products.

In the U.S. segment, revenue was $1.3 billion, reflecting a 4% increase compared to Q4 2023. Sales of companion animal products grew by 7%, fueled by continued strong demand for Simparica Trio, dermatology products such as Apoquel and Cytopoint, and monoclonal antibody treatments for osteoarthritis pain.

Growth was partially offset by the impact of the initial stocking of Librela and Apoquel Chewable products during their prior-year launches. Livestock product sales declined by 8%, primarily due to the divestiture of the medicated feed additive portfolio and certain water-soluble products.

Click here to download our most recent Sure Analysis report on ZTS (preview of page 1 of 3 shown below):

Blue Chip #3: Eli Lilly & Co. (LLY)

  • Dividend History: 11 years of consecutive increases
  • Dividend Growth: 15%

Eli Lilly develops, manufactures, and sells pharmaceuticals around the world, and has about 43,000 employees globally. Eli Lilly has annual revenue of $59 billion.

On December 9th, 2024, Eli Lilly raised its quarterly dividend 15.4% to $1.50, extending the company’s dividend growth streak to 11 years.

On February 6th, 2025, Eli Lilly announced fourth quarter and full year results for the period ending December 31st, 2024. For the quarter, revenue surged 44.7%% to $13.5 billion, which beat estimates by $100 million.

Source: Investor Presentation

Adjusted earnings-per-share of $5.32 compared very favorably to adjusted earnings-per-share of $2.49 in the prior year and was $0.24 ahead of expectations.

For the year, revenue grew 32% $45 billion while adjusted earnings-per-share of $12.99 compared to $6.32 in 2023. Volumes company-wide were up 48% for the quarter, but pricing was down 4%.

U.S. revenue grew 40% to $9.03 billion, as volume was up 45% while pricing fell 5%. International revenues were up 55% to $4.5 billion as volumes improved 56%.

Revenue for Mounjaro, which helps patients with weight management and is the company’s top gross product, totaled $3.53 billion, compared to $2.21 billion a year ago.

Demand remains incredibly high for the product. Zepbound, which is also used to treat patients with obesity, had revenue of $1.91 billion for the quarter and $4.9 billion for the year.

Click here to download our most recent Sure Analysis report on LLY (preview of page 1 of 3 shown below):

Blue Chip #2: Comfort Systems USA (FIX)

  • Dividend History: 13 years of consecutive increases
  • Dividend Growth: 15%

Comfort Systems USA provides mechanical and electrical contracting services across the U.S. The company specializes in HVAC, plumbing, piping, controls, and electrical system installations and services, running 47 units with 178 locations in 136 cities.

Serving primarily commercial, industrial, and institutional markets, Comfort Systems USA works in sectors like manufacturing, healthcare, education, and government.

The company generated $7.0 billion in revenues last year, with 56.7% of it coming from new facility installations and 43.3% coming from services for existing buildings. On February 20th, 2025, Comfort Systems raised its dividend by 14.3% to a quarterly rate of $0.40.

On the same day, the company posted its Q4 and full-year results for the period ending December 31st, 2024. Revenue for the period was $1.87 billion, up 37.5% compared to last year.

The rise included strong same-store activity growth and contributions from acquisitions. The same-store revenue growth was largely driven by continued strength in market conditions, particularly in data centers and chip plants.

The mechanical segment recorded revenue growth of over 40% year-over-year, fueled by robust organic growth in construction and services. The electrical segment also maintained solid performance, reflecting sustained demand. EPS increased by about 60% to $4.09.

For the full year, the company reported EPS of $14.64, exceeding prior estimates. The company’s backlog remained strong, reaching $5.99 billion at the end of December.

Click here to download our most recent Sure Analysis report on FIX (preview of page 1 of 3 shown below):

High Yield Blue Chip #1: Badger Meter Inc. (BMI)

  • Dividend History: 32 years of consecutive increases
  • Dividend Growth: 15%

Badger Meter was founded in 1905 in Milwaukee, WI. It manufactures and markets meters and valves that are used to measure and control the flow of liquids, such as water, oil and various chemicals.

Its products are also used to control the flow of air and other gases. Badger Meter generates ~$827 million in annual revenues.

On January 31st, 2025, Badger Meter announced fourth quarter and full year earnings results for the period ending December 31st, 2025. For the quarter, revenue improved 12.5% to $205.2 million, which topped estimates by $2.45 million.

Earnings-per-share of $1.04 compared favorably to earnings-per-share of $0.84 in the prior year and was $0.04 more than expected. For the year, revenue grew 18% to a new record $826.6 million. Earnings-per-share totaled $4.23, which was a new record and was up from $3.14 in 2023.

The utility water business once again grew 14% for the quarter. As with prior periods, this growth was led by an increase in demand for ORION Cellular endpoint, E-Series Ultrasonic meters, and BEACON Software as a Service.

Click here to download our most recent Sure Analysis report on BMI (preview of page 1 of 3 shown below):

Additional Reading

If you are interested in finding other high-yield securities, the following Sure Dividend resources may be useful:

High-Yield Individual Security Research

Other Sure Dividend Resources

Thanks for reading this article. Please send any feedback, corrections, or questions to [email protected].


Source link

Microchip Technology Moves to Sell Facility, Launches $1.35B Stock Offering


Key Takeaways

  • Microchip Technology announced it has brought in Macquarie Group to facilitate the sale of its manufacturing facility in Tempe, Ariz.
  • The semiconductor firm also launched a $1.35 billion convertible stock offering, which led to a Moody’s downgrade of its senior unsecured rating.
  • Microchip Technology has faced falling demand, with sales slumping 42% in the last quarter.

Microchip Technology (MCHP) shares fell Thursday as the struggling semiconductor firm said it hired Macquarie Group to help sell its Fab 2 wafer fabrication plant in Arizona, and launched a $1.35 billion convertible stock offering.

The company explained that Fab 2 will be “marketed and sold under the guidance of the semiconductor and technology team within Macquarie’s Commodities and Global Markets business.” It did not indicate how much it expects to receive from the sale. 

Microchip Technology announced last December that it planned to offload the Tempe facility to restructure its manufacturing operations. At that time, newly installed interim CEO Steve Sanghi explained that the decision was made with “inventory levels high and having ample capacity in place.” The site produces installed and operational chip equipment, and its product manufacturing and technologies are being transferred to Fabs 4 and 5 in Oregon and Colorado, respectively. 

Michael Finley, senior vice president of fab operations, called the closure and sale “the latest development in our ongoing restructuring, demonstrating our efforts to resize our manufacturing footprint.” The company said in December that it anticipated the shutdown would occur in the September quarter and create annual cash savings of about $90 million. 

Microchip Technology has been hurt by falling demand. Last month, it reported that third-quarter fiscal 2025 net sales tumbled 42% year-over-year, with Sanghi noting that the performance reflected “the need for the decisive steps we are taking to realign our business.”

Moody’s Downgrades Microchip Technology Rating

In response to Microchip Technology’s issuing the convertible stock, Moody’s Ratings on Thursday downgraded its senior unsecured rating to “Baa2” from “Baa1.” “The rating downgrade reflects Microchip’s weak financial profile resulting from a sharp erosion in earnings,” Moody’s said. 

Microchip Technology shares, which fell about 5% Thursday afternoon, have lost about 40% of their value over the last year.

UPDATE—This story has been updated with the stock offering, Moody’s downgrade, and latest share price information.

TradingView


Source link

Best Long-Term Disability Insurance Companies


Why You Should Trust Us

Investopedia reviews are based on thorough, unbiased research and analysis conducted by our team of experts. We compiled this list of the best long-term disability insurance companies by gathering data on 11 providers. We considered factors like coverage maximums, riders, and premiums, allowing us to provide an objective evaluation. Investopedia was founded in 1999 and has reviewed disability insurance companies since 2020.


How We Chose the Best Long-Term Disability Insurance Companies

Investopedia’s list of the best disability insurance companies is based on extensive research of 11 providers. To be considered for this list, insurance companies had to meet Investopedia’s standards for transparency and financial strength. We gathered 190 data points across 19 criteria between Jan 3, 2025, and Jan 23, 2025. We collected the data from company websites, media representatives, AM Best, and customer service calls.

Then, staff editors and research analysts created a quantitative model that scores each company on eight major categories. We weighted the categories as follows:

  • Maximum benefit period: 20%
  • Maximum monthly benefit: 18%
  • Percentage of income covered: 15%
  • Riders: 14%
  • Financial strength: 11%
  • Minimum elimination period: 10%
  • Quotes: 10%
  • Maximum issue age: 2%


Source link

Boeing Surges on Several Positive Signals


Key Takeaways

  • The S&P 500 added 1.1% on Wednesday, March 19, 2025, as the Fed held interest rates steady, reaffirming plans for future cuts but expressing caution on inflation and growth.
  • Boeing shares surged after an order from Japan Airlines, comments from an executive on limited tariff impacts, and an upbeat delivery forecast.
  • Following a string of gains, shares of Intel moved lower as the chipmaker’s incoming CEO reportedly evaluated restructuring measures.

Major U.S. equities indexes moved higher as the Federal Reserve’s policy committee concluded its second meeting of 2025.

In a widely expected move, policymakers maintained benchmark interest rates at current levels. Although the Fed’s freshly released “dot plot” showed that officials still anticipate two interest-rate cuts this year, updated projections from the central bank included forecasts for higher inflation and slower economic growth compared with previous predictions.

The S&P 500 advanced 1.1% in the midweek trading session. The Dow closed 0.9% higher following the Fed’s announcement, while the Nasdaq was up 1.4%.

Shares of aerospace giant Boeing (BA) soared 6.8%, logging the S&P 500’s top performance on Wednesday. The move higher followed several positive signals for the plane manufacturer, including an announcement that Japan Airlines has placed an order for 17 of Boeing’s 737-8 aircraft. In addition, Boeing’s chief financial officer Brian West downplayed the potential impact of U.S. tariffs on the company, while analysts at Bank of America said they expect Boeing to achieve a month-over-month uptick in plane deliveries in March.

Super Micro Computer (SMCI) unveiled new systems that incorporate the Blackwell Ultra platform, the latest generation of artificial intelligence (AI) chips from Nvidia (NVDA). The updated products are designed to handle complex AI tasks such as training models, graphics, and visualization. Supermicro stock gained 5.8% on Wednesday, clawing back a portion of the steep losses posted in the previous session.

Caesars Entertainment (CZR) shares jumped 5.7% after the resort and casino operator announced that two additional independent members would join its board of directors. Executives from Icahn Enterprises (IEP) will occupy both new board seats. Founder and controlling shareholder of the investment firm Carl Icahn previously indicated that he would not engage in activism related to operations at Caesars, but following the board deal, the major investor discussed the possibility of exploring strategic options for the gaming company’s digital business.

Intel (INTC) shares failed to build on their five-day winning streak, declining the most of any S&P 500 stock on Wednesday with a drop of 6.9%. Recent enthusiasm for the stock has revolved around the chipmaker naming semiconductor industry veteran Lip-Bu Tan as its new CEO. The incoming top executive, who officially took the helm of Intel this week, has reportedly discussed significant restructuring moves including middle-management staff cuts, changes to manufacturing processes, and shifts in AI strategy.

Progressive (PGR) stock slipped 3.5% after the insurer released its results from February 2025. Although the company achieved strong year-over-year gains in premiums and net income, Progressive reported a total pretax net realized loss on securities of $110 million, down sharply from a gain of $80 million in February 2024.

Shares of biopharmaceutical company Gilead Sciences (GILD) fell 2.5% following reports that the Department of Health and Human Services is considering sharp reductions in federal funding for HIV prevention. HIV treatments, including pre-exposure prophylaxis drugs prescribed as a preventive measure for people at risk of contracting the virus, accounted for more than half of Gilead’s revenue last year.


Source link