2025 Kevin O’Leary Complete Stock Portfolio List & Top 10 Dividend Picks Now


Updated on March 7th, 2025 by Bob Ciura

Kevin O’Leary is Chairman of O’Shares Investment Advisors, but you probably know him as “Mr. Wonderful”.

He can be seen on CNBC as well as the television show Shark Tank. Investors who have seen him on TV have likely heard him discuss his investment philosophy.

Mr. Wonderful looks for stocks that exhibit three main characteristics:

  1. First, they must be quality companies with strong financial performance and solid balance sheets.
  2. Second, he believes a portfolio should be diversified across different market sectors.
  3. Third, and perhaps most important, he demands income—he insists the stocks he invests in pay dividends to shareholders.

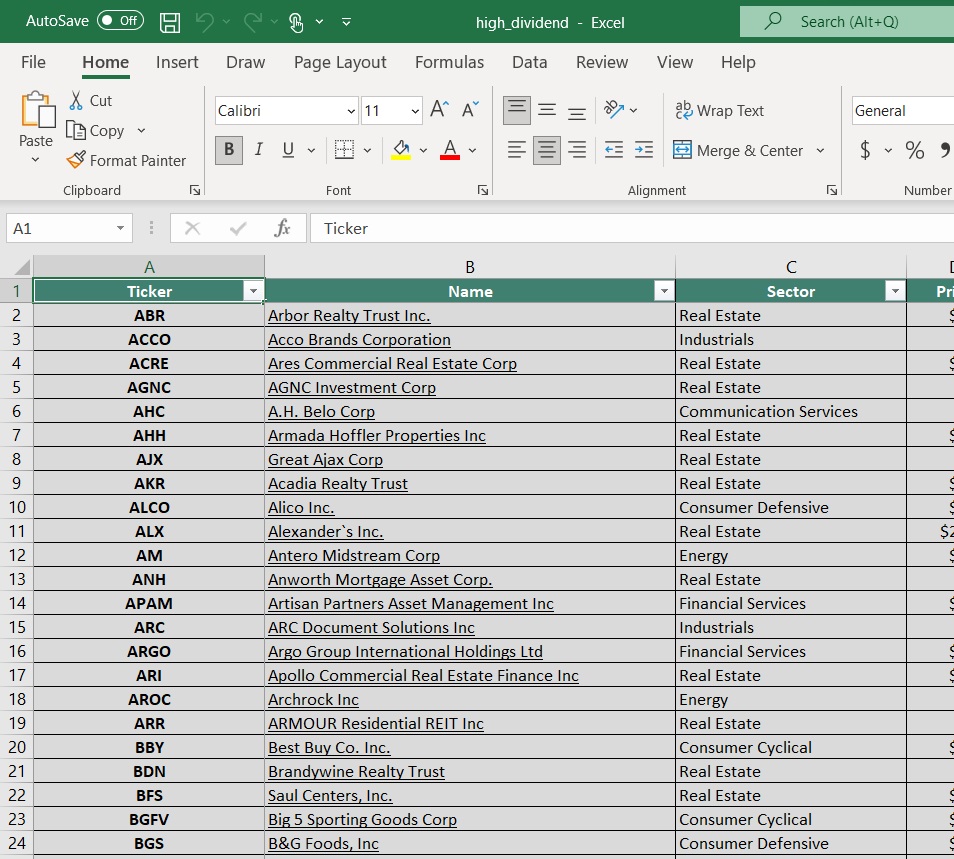
You can download the complete list of all of O’Shares Investment Advisors stock holdings by clicking the link below:


OUSA owns stocks that display a mix of all three qualities. They are market leaders with strong profits, diversified business models, and they pay dividends to shareholders.

The list of OUSA portfolio holdings is an interesting source of quality dividend growth stocks.

This article analyzes the fund’s largest holdings in detail.

Table of Contents

The top 10 holdings from the O’Shares FTSE U.S. Quality Dividend ETF are listed in order of their weighting in the fund, from lowest to highest.

No. 10: Cisco Systems (CSCO)

Dividend Yield: 2.6%

Percentage of Portfolio: 3.36%

Cisco Systems is the global leader in high performance computer networking systems. The company’s routers and switches allow networks around the world to connect to each other through the internet. Cisco also offers data center, cloud, and security products.

On February 12th, 2025, Cisco announced a 2.5% dividend increase in the quarterly payment to $0.41. That same day, Cisco announced results for the second quarter of fiscal year 2025 for the period ending January 25th, 2025.

For the quarter, revenue grew 9.4% to $13.99 billion, which beat estimates by $120 million. Adjusted earnings-per-share of $0.94 compared favorably to adjusted earnings-per-share of $0.87 in the prior year and was $0.03 ahead of expectations.

Excluding the company’s recent acquisition of Splunk, total revenue grew 11% for the quarter. Networking fell 3% while Security grew 117%, Observability was up 47%, and Collaboration improved 1%. By region, the Americas increased 9%, Europe/Middle East/Africa was higher by 11%, and Asia-Pacific/Japan/China was up 8%.

Click here to download our most recent Sure Analysis report on Cisco Systems (CSCO) (preview of page 1 of 3 shown below):

No. 9: McDonald’s Corporation (MCD)

Dividend Yield: 2.2%

Percentage of OUSA Portfolio: 3.53%

McDonald’s is the world’s leading restaurant chain with 41,822 locations in about 119 countries at end of 2022. The highest store counts are in the US (13,449), China (5,903), Japan (2,982), France (1,560), and Canada (1,466).

Approximately 95% of the stores are franchised or licensed and the rest are company owned. However, the company owns about 55% of the real estate and 80% of the buildings in its network.

Total system sales were approximately $129.5B in 2023 and total revenue was around $25.5B in 2023.

On February 10th, McDonald’s reported Q4 2024 results. Total revenue came in at $6.38 billion, flat compared to Q4 2023, on 2% higher system-wide sales (adjusting for currency).

Diluted earnings were flat at $2.80 per share compared to $2.80 per share in comparable periods on pre-tax charges.

On a geographic basis, comparable sales were -1.4% in the US, +0.1% in the International Operated Markets, and +4.1% in the International Developmental Licensed Markets.

The firm’s focus on value deals and the McValue platform should boost traffic and sales.

Click here to download our most recent Sure Analysis report on MCD (preview of page 1 of 3 shown below):


No. 8: Merck & Co. (MRK)

Dividend Yield: 3.4%

Percentage of OUSA Portfolio: 3.81%

Merck & Company is one of the largest healthcare companies in the world. Merck manufactures prescription medicines, vaccines, biologic therapies, and animal health products.

Merck employs 68,000 people around the world and generates annual revenues of more than $63 billion.

Source: Investor Presentation

On February 4th, 2025, Merck announced fourth quarter and full year results for the period ending December 31st, 2024.

For the quarter, revenue improved 7% to $15.6 billion, which was $110 million above estimates. Adjusted earnings-per-share was $1.72 compared to $0.03 the prior year and $0.04 more than expected.

For the year, revenue increased 7% to $64.2 billion while adjusted earnings-per-share of $7.65.

Keytruda, which treats cancers such as melanoma that cannot be removed by surgery and non-small cell lung cancer, continues to be the key driver of growth for the company as sales for the drug were up 19% to $7.8 billion during the period.

Click here to download our most recent Sure Analysis report on MRK (preview of page 1 of 3 shown below):


No. 7: Alphabet Inc. (GOOGL)

Dividend Yield: 0.47%

Percentage of OUSA Portfolio: 3.92%

Alphabet is a technology conglomerate that operates several businesses such as Google search, Android, Chrome, YouTube, Nest, Gmail, Maps, and many more. Alphabet is a leader in many of the areas of technology that it operates.

On February 4th, 2025, Alphabet announced fourth quarter and full year results for the period ending December 31st, 2024. For the quarter, revenue grew 11.8% to $96.5 billion, but this was $170 million less than expected.

Adjusted earnings-per-share of $2.15 compared very favorably to $1.64 in the prior year and was $0.02 above estimates. For the year, revenue grew 14% to $350 billion while adjusted earnings-per-share of $8.04 compared to $5.80 in 2023.

Most businesses performed well during the period. For the quarter, revenue for Google Search, the largest contributor to results, grew 12.5% to $54 billion. YouTube ads increased 13.8% to $10.5 billion while Google Network declined 4.1% to just under $8 billion.

Click here to download our most recent Sure Analysis report on GOOGL (preview of page 1 of 3 shown below):


No. 6: MasterCard Inc. (MA)

Dividend Yield: 0.57%

Percentage of OUSA Portfolio: 4.13%

MasterCard is a world leader in electronic payments. The company partners with 25,000 financial institutions around the world to provide an electronic payment network. MasterCard has more than 3.1 billion credit and debit cards in use.

On January 30th, 2025, MasterCard announced fourth quarter and full year results for the period ending December 31st, 2024.

For the quarter, revenue improved 15.4% to $7.5 billion, which was $120 million above estimates. Adjusted earnings-per-share of $3.82 compared favorably to $3.18 in the prior year and was $0.13 more than expected.

For the year, revenue grew 12% to $28.2 billion while adjusted earnings-per-share of $14.60 compared to $12.26 in 2023.

On a local currency basis, gross dollar volumes for the quarter grew 12% worldwide to $2.56 trillion during the quarter, with the U.S. improving 9% and the rest of the world higher by 13%.

Cross border volumes remained strong, growing 20% from the prior year and 17% from Q3 2024.

Click here to download our most recent Sure Analysis report on Mastercard (preview of page 1 of 3 shown below):

No. 5: Microsoft Corporation (MSFT)

Dividend Yield: 0.86%

Percentage of OUSA Portfolio: 4.52%

Microsoft Corporation manufactures and sells software and hardware to businesses and consumers. Its offerings include operating systems, business software, software development tools, video games and gaming hardware, and cloud services.

In late January, Microsoft reported (1/29/25) financial results for the second quarter of fiscal 2025 (its fiscal year ends June 30th).

The company grew its revenue 12% over the prior year’s quarter. Growth came from Intelligent Cloud and Productivity & Business Processes, which grew 19% and 14%, respectively.

Sales of Azure, Microsoft’s high-growth cloud platform, grew 31%. Earnings-per-share grew 10%, from $2.94 to $3.23, and exceeded the analysts’ consensus by $0.13.

Click here to download our most recent Sure Analysis report on MSFT (preview of page 1 of 3 shown below):


No. 4: Johnson & Johnson (JNJ)

Dividend Yield: 3.0%

Percentage of OUSA Portfolio: 4.54%

Johnson & Johnson is a diversified health care company and a leader in the area of innovative medicines and medical devices Johnson & Johnson was founded in 1886 and employs nearly 132,000 people around the world.

On January 22nd, 2025, Johnson & Johnson announced fourth quarter and full year results for the period ending December 31st, 2024.

Source: Investor Presentation

For the quarter, revenue grew 5.1% to $22.5 billion, which beat estimates by $50 million. Adjusted earnings-per-share of $2.04 compared to $2.29 in the prior year, but this was $0.02 above expectations.

For the year, revenue grew 4.3% to $88.8 billion while adjusted earnings-per-share of $9.98 was up slightly from the prior year. Results included adjustments related to the costs of acquisitions.

Click here to download our most recent Sure Analysis report on JNJ (preview of page 1 of 3 shown below):


No. 3: Home Depot (HD)

Dividend Yield: 2.5%

Percentage of OUSA Portfolio: 4.95%

Home Depot was founded in 1978 and since that time has grown into a juggernaut home improvement retailer with over 2,300 stores in the US, Canada and Mexico that generate around $153 billion in annual revenue.

Home Depot reported fourth quarter 2025 results on February 25th, 2025. The company reported sales of $39.7 billion, up 14% year-over-year. Comparable sales in the quarter increased 0.8%.

Net earnings equaled $3.0 billion, or $3.02 per share, compared to $2.8 billion, or $2.82 per share in Q4 2023. Adjusted EPS was $3.13.

Average ticket improved 0.3% compared to last year, from $88.87 to $89.11. Additionally, sales per retail square foot rose 1.2% from $550.50 to $556.90.

The company spent $649 million on common stock repurchases in 2024, compared to $8.0 billion in the prior year.

Click here to download our most recent Sure Analysis report on HD (preview of page 1 of 3 shown below):


No. 2: Apple (AAPL)

Dividend Yield: 0.42%

Percentage of OUSA Portfolio: 5.14%

Apple is a technology company that designs, manufactures, and sells products such as iPhones, iPads, Mac, Apple Watch and Apple TV. Apple also has a services business that sells music, apps, and subscriptions.

On January 30th, 2025, Apple reported financial results for the first quarter of fiscal year 2025 (Apple’s fiscal year ends the last Saturday in September).

Total sales grew 4% over the prior year’s quarter, to a new record of $124.3 billion, thanks to sustained growth in iPhone, iPad and Wearables across all regions.

Earnings-per-share grew 10%, from $2.18 to $2.40, and exceeded the analysts’ consensus by $0.05. Notably, Apple has missed the analysts’ estimates only once in the last 25 quarters.

Going forward, Apple’s earnings growth will be driven by several factors. One of these is the ongoing cycle of iPhone releases, which creates lumpy results. In the long run, Apple should be able to grow its iPhone sales, albeit in an irregular fashion.

Click here to download our most recent Sure Analysis report on AAPL (preview of page 1 of 3 shown below):

No. 1: Visa Inc. (V)

Dividend Yield: 0.70%

Percentage of OUSA Portfolio: 5.86%

Visa is the world’s leader in digital payments, with activity in more than 200 countries. The company’s global processing network provides secure and reliable payments around the world and is capable of handling more than 65,000 transactions a second.

On January 30th, 2025, Visa reported first quarter 2025 results for the period ending December 31st, 2024. (Visa’s fiscal year ends September 30th.)

For the quarter, Visa generated revenue of $9.5 billion, adjusted net income of $5.5 billion and adjusted earnings-per-share of $2.75, marking increases of 10%, 11% and 14%, respectively.

These results were driven by a 9% gain in Payments Volume, a 16% gain in Cross-Border Volume and an 11% gain in Processed Transactions. Visa processed 63.8 billion transactions in the quarter.

Click here to download our most recent Sure Analysis report on Visa (preview of page 1 of 3 shown below):

Final Thoughts

Kevin O’Leary has become a household name due to his appearances on the TV show Shark Tank. But he is also a well-known asset manager, and his investment philosophy largely aligns with Sure Dividend’s.

Specifically, Mr. Wonderful typically invests in stocks with large and profitable businesses, with strong balance sheets and consistent dividend growth every year.

Not all of these stocks are currently rated as buys in the Sure Analysis Research Database, which ranks stocks based on expected total return due to a combination of earnings per share growth, dividends, and changes in the price-to-earnings multiple.

However, several of these 10 stocks are valuable holdings for a long-term dividend growth portfolio.

Additional Resources

If you are interested in finding more high-quality dividend growth stocks suitable for long-term investment, the following Sure Dividend databases will be useful:

The major domestic stock market indices are another solid resource for finding investment ideas. Sure Dividend compiles the following stock market databases and updates them monthly:

Thanks for reading this article. Please send any feedback, corrections, or questions to [email protected].


Source link

Dividend Aristocrats In Focus: Automatic Data Processing


Updated on March 5th, 2025 by Felix Martinez

Automatic Data Processing (ADP) might not be a household name, but it should be for dividend growth investors. ADP has raised its dividend each year for 50 years in a row.

ADP is a member of the Dividend Aristocrats, a group of 69 stocks in the S&P 500 Index with 25+ years of consecutive dividend increases. ADP has one of the longest streaks of dividend increases among the Dividend Aristocrats.

We have created a full list of all 69 Dividend Aristocrats, along with important metrics like P/E ratios and dividend yields, which you can download by clicking on the link below:


Disclaimer: Sure Dividend is not affiliated with S&P Global in any way. S&P Global owns and maintains The Dividend Aristocrats Index. The information in this article and downloadable spreadsheet is based on Sure Dividend’s own review, summary, and analysis of the S&P 500 Dividend Aristocrats ETF (NOBL) and other sources, and is meant to help individual investors better understand this ETF and the index upon which it is based. None of the information in this article or spreadsheet is official data from S&P Global. Consult S&P Global for official information.

ADP’s long history of dividend growth is the result of a strong business model and durable competitive advantages. This has led to domination of its core markets for decades. To quote legendary investor Warren Buffett, ADP has a wide economic moat.

This article will review ADP’s fundamentals and discuss whether the stock is currently trading at an attractive enough valuation.

Business Overview

ADP is a business outsourcing services company. It was founded in 1949 and began with a single client. In the 75 years since ADP has grown into the leading payroll and human resource outsourcing company. It has over 1 million clients in more than 140 countries worldwide.

ADP provides services to companies of all sizes, including payroll, benefits administration, and human resources management. These services are highly demanded, as companies prefer to outsource these functions to better focus on their core business activities.

ADP has a leading position across its strategic pillars and a highly diversified client list.

The company has undergone significant restructuring in recent years. In 2014, ADP spun off its human capital management business, which now trades as CDK Global (CDK).

ADP posted fiscal second-quarter earnings on January 29th, 2025. ADP reported an 8% revenue increase to $5.0 billion in Q2 FY25, with net earnings up 10% to $963 million. Adjusted EBIT rose 11% to $1.3 billion, expanding the margin to 25.2%. Diluted EPS grew 10% to $2.35. The company reaffirmed its full-year outlook, expecting 6%-7% revenue growth and 7%-9% adjusted EPS growth.

Employer Services revenue grew 8%, with a 90-basis-point margin increase, while PEO Services revenue rose 8% but saw a 140-basis-point margin decline. Interest on client funds jumped 21% to $273 million, supported by higher balances and yields. Strong new business bookings and interest in client funds drove overall growth.

For FY25, ADP expects Employer Services revenue growth of 6% – 7% and margin expansion. PEO Services revenue is projected to rise 5% – 6% despite margin pressure. Client funds interest revenue is forecasted at $1.14-$1.16 billion. ADP remains focused on sustainable growth and shareholder value.

Source: Investor Presentation

Growth Prospects

Automatic Data Processing has compounded its adjusted earnings-per-share at a rate of more than 11% per year over the last decade, which we believe it can come close to matching moving forward.

Beyond 2023, we believe the company can deliver 9% annualized growth in earnings-per-share over full economic cycles. Much of this growth is likely to be driven by the company’s Professional Employer Organization (PEO) Services segment, which continues to deliver strong growth.

Importantly, this revenue growth has been accompanied by meaningful margin expansion, which means that the segment’s growth has outsized the firm’s bottom line.

In addition, share buybacks are a low single-digit tailwind to annual EPS growth, and we expect that to continue.

Source: Investor Presentation

Two key long-term growth catalysts for ADP are continued payroll increases and expanding regulations.

The number of employees on ADP clients’ payrolls continues to grow, and we believe this will continue for the foreseeable future. Next, the increasingly complex regulatory environment creates significant compliance costs for businesses; this also helps provide ADP with long-term growth.

Competitive Advantages & Recession Performance

Many competitive advantages fuel ADP’s growth. ADP has a deep connection with its customers and enjoys a strong reputation for customer service, which helps keep customer retention very high.

ADP enjoys a tremendous scale that its competitors cannot match. As a global company, ADP is uniquely positioned to help companies with employees on multiple continents.

In addition, ADP benefits from a recession-resistant business model. ADP’s earnings-per-share during the Great Recession are shown below:

  • 2007 earnings-per-share of $1.83
  • 2008 earnings-per-share of $2.20 (20% increase)
  • 2009 earnings-per-share of $2.39 (8.6% increase)
  • 2010 earnings-per-share of $2.39 (flat)

ADP increased earnings-per-share in 2008 and 2009, which is a rare accomplishment. ADP’s continued growth during the Great Recession is because businesses still need payroll and human resource services, even during an economic downturn.

The company continued to perform relatively well in the 2020 economic downturn caused by the coronavirus pandemic. ADP remained highly profitable during the pandemic, which allowed it to maintain its streak of annual dividend increases.

The necessary nature of ADP’s services helps insulate the company from the effects of a recession. Given ADP’s size and scale, we believe it will perform well during the next recession.

Valuation & Expected Returns

We forecast adjusted earnings-per-share of approximately $9.95 for fiscal 2025. Based on the current share price of ~$310, the stock has a price-to-earnings ratio of 31.2.

We see fair value for ADP at 29 times earnings, meaning the stock appears to be overvalued. This implies a slight headwind to total returns in the coming years from valuation expansion.

If the P/E multiple expands from 31.2 to 29 over the next five years, it would decrease annual returns by 1.5% per year.

We expect ADP to grow earnings-per-share by 9% annually over the next five years. In addition, the stock has a current dividend yield of 1.9%.

The combination of earnings growth, dividends, and valuation expansion results in a total expected return of 9.4% per year over the next five years.

Given its strong fundamentals, ADP will almost certainly continue increasing its dividend for many years to come. ADP maintains a target payout ratio of 55%- 60% of annual earnings, so the payout is very safe with room to grow.

Final Thoughts

ADP is a strong business. It maintains a large list of customers and holds a top position in the industry. This gives it a wide economic “moat,” a term popularized by investing legend Warren Buffett.

Indeed, ADP’s wide moat keeps competitors at bay, leading to high profitability levels.

There should be plenty of growth going forward, both in terms of earnings and dividends. Regulations continue to become more complex.

And, as the economy expands, companies are adding employees and increasingly use ADP’s services. If a recession occurs, ADP should continue to increase its dividend, as customers will still need its services.

With an expected rate of return above 9.4%, we rate ADP stock a hold.

If you are interested in finding high-quality dividend growth stocks suitable for long-term investment, the following Sure Dividend databases will be useful:

The major domestic stock market indices are another solid resource for finding investment ideas. Sure Dividend compiles the following stock market databases and updates them monthly:

Thanks for reading this article. Please send any feedback, corrections, or questions to [email protected].


Source link

10 KISS Stocks For Reliable Retirement Income


Updated on March 6th, 2025 by Bob Ciura

“KISS” stands for Keep It Simple Stupid.

The “Stupid” part isn’t meant to be an insult. It’s a reminder that smart people can make “stupid” mistakes when things are over-complicated.

“Simplicity is the ultimate sophistication”
– Attributed to Leonardo Da Vinci

Retirement investing should be kept simple in order to minimize mistakes. At its core, retirement investing is all about creating passive income.

At Sure Dividend, we focus on dividend-paying stocks to build a growing passive income stream.

One way for investors to find great dividend stocks is to focus on those with the longest histories of raising dividends.

With this in mind, we created a downloadable list of over 130 Dividend Champions, which have increased their dividends for over 25 consecutive years.

You can download your free copy of the Dividend Champions list, along with relevant financial metrics like price-to-earnings ratios, dividend yields, and payout ratios, by clicking on the link below:


Investors are likely familiar with the Dividend Aristocrats, a group of 69 stocks in the S&P 500 Index with 25+ consecutive years of dividend increases.

Meanwhile, investors should also familiarize themselves with the Dividend Champions, which have also raised their dividends for at least 25 years in a row.

While their length of dividend increases is the same, leading to some overlap, there are also some important differences between the Dividend Aristocrats and Dividend Champions.

As a result, the Dividend Champions list is much more expansive. There are many high-quality Dividend Champions that are not included on the Dividend Aristocrats list.

This article will discuss 10 Dividend Champions that are ideal candidates for investors looking to keep investing simple with high-quality dividend stocks.

Table of Contents

The 10 stocks below have all increased their dividends for over 25 years, with Dividend Risk Scores of ‘C’ or higher. In addition, they have dividend payout ratios below 70% which indicates dividend sustainability.

Lastly, the 10 stocks have dividend growth rates above 5%.

You can instantly jump to any specific section of the article by clicking on the links below:

The 10 KISS stocks have been ranked by expected total annual return over the next five years, from lowest to highest.


KISS Stock #10: Tennant Co. (TNC)

  • 5-year expected returns: 12.3%

Tennant Company is a machinery company that produces cleaning products and that offers cleaning solutions to its customers.

In the US, the company holds the market leadership position in its industry, but the company also sells its products in more than 100 additional countries around the globe.

Source: Investor Presentation

Tennant Company reported its fourth quarter earnings results on February 19. Revenues of $328 million during the quarter, which was 6% more than the top line number from the previous year’s quarter.

This was slightly better than the recent trend, as revenue had grown less on a year-over-year basis during the previous quarter.

Tennant Company generated adjusted earnings-per-share of $1.52 during the fourth quarter, which was less than what the analyst community had forecast, and which was down compared to the previous year.

Management is forecasting that adjusted earnings-per-share will fall into a range of $5.70 to $6.20 in 2025.

Click here to download our most recent Sure Analysis report on TNC (preview of page 1 of 3 shown below):


KISS Stock #9: Sysco Corp. (SYY)

  • 5-year expected returns: 13.5%

Sysco Corporation is the largest wholesale food distributor in the United States. The company serves 600,000 locations with food delivery, including restaurants, hospitals, schools, hotels, and other facilities.

Source: Investor Presentation

On January 28th, 2025, Sysco reported second-quarter results for Fiscal Year (FY)2025. The company reported a 4.5% increase in sales for the second quarter of fiscal year 2025, reaching $20.2 billion.

U.S. Foodservice volume grew by 1.4%, while gross profit rose 3.9% to $3.7 billion. Operating income increased 1.7% to $712 million, with adjusted operating income growing 5.1% to $783 million. Earnings per share (EPS) remained at $0.82, while adjusted EPS grew 4.5% to $0.93.

The company reaffirmed its full-year guidance, projecting sales growth of 4%-5% and adjusted EPS growth of 6%-7%.

Click here to download our most recent Sure Analysis report on SYY (preview of page 1 of 3 shown below):


KISS Stock #8: Target Corp. (TGT)

  • 5-year expected returns: 13.5%

Target was founded in 1902 and now operates about 1,850 big box stores, which offer general merchandise and food, as well as serving as distribution points for the company’s e-commerce business.

Target posted third quarter earnings on November 20th, 2024. Third quarter revenue was $25.67 billion, up 1.1% year-over-year, but missing estimates by $230 million. Adjusted earnings-per-share came to $1.85, which missed estimates by a staggering 45 cents, or 20%.

For Q3, comparable sales were up just 0.3%, missing estimates of 1.5%. Guest traffic was up 2.4% in the quarter while digital comparable sales rose 10.8%. Gains there were led by Target Circle 360 and Drive Up.

Operating margin was 4.6% of revenue, down from 5.2% a year ago. Gross margins were off 20 basis points to 27.2% of revenue, reflecting higher digital fulfillment and supply chain costs.

Click here to download our most recent Sure Analysis report on TGT (preview of page 1 of 3 shown below):


KISS Stock #7: Bank OZK (OZK)

  • 5-year expected returns: 13.8%

Bank OZK is a regional bank that offers services such as checking, business banking, commercial loans and mortgages to its customers in Arkansas, Florida, North Carolina, Texas, Alabama, South Carolina, New York and California.

On January 2nd, 2025, Bank OZK announced a $0.42 quarterly dividend, representing a 2.4% raise over the last quarter’s payment and a 10.5% raise year-over-year. This marked the company’s 58th consecutive quarter of raising its dividend.

In mid-January, Bank OZK reported (1/16/25) results for the fourth quarter of 2024. Total loans and deposits grew 13% each over the prior year’s quarter. Net interest income grew 2% over the prior year’s quarter, despite higher deposit costs.

Earnings-per-share grew 4%, from $1.50 to a new all-time high of $1.56, and exceeded the analysts’ consensus by $0.11. Bank OZK has exceeded the analysts’ consensus in 17 of the last 19 quarters and has posted record earnings-per-share for 9 consecutive quarters.

Management expects a recovery of net interest margin from mid-2025 thanks to lower interest rates and deposit costs.

Click here to download our most recent Sure Analysis report on OZK (preview of page 1 of 3 shown below):


KISS Stock #6: Becton Dickinson & Co. (BDX)

  • 5-year expected returns: 13.8%

Becton, Dickinson & Co. is a global leader in the medical supply industry. The company was founded in 1897 and has 75,000 employees across 190 countries.

The company generates about $20 billion in annual revenue, with approximately 43% of revenues coming from outside of the U.S.

On February 5th, 2025, BD released results for the first quarter of fiscal year 2025, which ended December 31st, 2024. For the quarter, revenue increased 9.8% to $5.17 billion, which was $60 million more than expected.

Source: Investor Presentation

On a currency neutral basis, revenue improved 9.6%. Adjusted earnings-per-share of $3.43 compared favorably to $2.68 in the prior year and was $0.44 ahead of estimates.

For the quarter, U.S. grew 12% while international was up 6.7% on a reported basis. Excluding currency, international was higher by 6.3%. Organic growth was up 3.9% for the period.

The Medical segment grew 17.1% organically to $2.62 billion, mostly due to gains in Mediation Management Solutions and Medication Delivery Solutions. Life Science was up 0.5% to $1.3 billion.

Click here to download our most recent Sure Analysis report on BDX (preview of page 1 of 3 shown below):


KISS Stock #5: SEI Investments Co. (SEIC)

  • 5-year expected returns: 13.9%

SEI Investments was founded in 1968 and over the last 50+ years has grown into a global provider of investment processing, investment management, and investment operations solutions for financial institutions and advisors.

SEI has about $1.6 trillion combined in assets under administration and management. The company should produce about $2.3 billion in revenue this year.

SEI posted fourth quarter and full-year earnings on January 29th, 2025, and results were mixed. Revenue soared 15% year-on-year to $557 million, beating estimates narrowly.

Adjusted earnings-per-share came to $1.19, missing estimates by a penny. Earnings were up 31% from the year before.

Management noted reduced earnings in Q4 from higher incentive compensation, the timing of stock-based compensation, and forex translation. Despite this, earnings in Q4 were very near a record for SEIC.

Consolidated operating income soared 43% year-over-year on strong revenue and expense management, with each segment seeing higher profits.

Click here to download our most recent Sure Analysis report on SEIC (preview of page 1 of 3 shown below):


KISS Stock #4: Nordson Corp. (NDSN)

  • 5-year expected returns: 14.1%

Nordson was founded in 1954 in Amherst, Ohio by brothers Eric and Evan Nord, but the company can trace its roots back to 1909 with the U.S. Automatic Company.

Today the company has operations in over 35 countries and engineers, manufactures, and markets products used for dispensing adhesives, coatings, sealants, biomaterials, plastics, and other materials, with applications ranging from diapers and straws to cell phones and aerospace.

Source: Investor Presentation

On December 11th, 2024, Nordson reported fourth quarter results for the period ending October 31st, 2024. For the quarter, the company reported sales of $744 million, 4% higher compared to $719 million in Q4 2023, which was driven by a positive acquisition impact, and offset by organic decrease of 3%.

Industrial Precision saw sales decrease by 3%, while the Medical and Fluid Solutions and Advanced Technology Solutions segments had sales increases of 19% and 5%, respectively.

The company generated adjusted earnings per share of $2.78, a 3% increase compared to the same prior year period.

Click here to download our most recent Sure Analysis report on NDSN (preview of page 1 of 3 shown below):


KISS Stock #3: PPG Industries (PPG)

  • 5-year expected returns: 14.8%

PPG Industries is the world’s largest paints and coatings company. Its only competitors of similar size are Sherwin-Williams and Dutch paint company Akzo Nobel.

PPG Industries was founded in 1883 as a manufacturer and distributor of glass (its name stands for Pittsburgh Plate Glass) and today has approximately 3,500 technical employees located in more than 70 countries at 100 locations.

On January 31st, 2025, PPG Industries announced fourth quarter and full year results for the period ending December 31st, 2024. For the quarter, revenue declined 4.6% to $3.73 billion and missed estimates by $241 million.

Adjusted net income of $375 million, or $1.61 per share, compared favorably to adjusted net income of $372 million, or $1.56 per share, in the prior year. Adjusted earnings-per-share was $0.02 below expectations.

Source: Investor Presentation

For the year, revenue from continuing operations decreased 2% to $15.8 billion while adjusted earnings-per-share totaled $7.87.

PPG Industries repurchased ~$750 million worth of shares during 2024 and has $2.8 billion, or ~10.3% of its current market capitalization, remaining on its share repurchase authorization. The company expects to repurchase ~$400 million worth of shares in Q1 2025.

For 2025, the company expects adjusted earnings-per-share in a range of $7.75 to $8.05.

Click here to download our most recent Sure Analysis report on PPG (preview of page 1 of 3 shown below):


KISS Stock #2: SJW Group (SJW)

  • 5-year expected returns: 17.8%

SJW Group is a water utility company that produces, purchases, stores, purifies and distributes water to consumers and businesses in the Silicon Valley area of California, the area north of San Antonio, Texas, Connecticut, and Maine.

SJW Group has a small real estate division that owns and develops properties for residential and warehouse customers in California and Tennessee. The company generates about $750 million in annual revenues.

Source: Investor Presentation

On February 27th, 2025, SJW Group announced fourth quarter and full year results for the period ending December 31st, 2024. For the quarter, revenue improved 15.5% to $197.8 million, which topped expectations by $10.3 million.

Earnings-per-share of $0.74 compared favorably to earnings-per-share of $0.59 in the prior year and was $0.19 ahead of estimates. For the year, revenue grew 12% to $748.4 million while earnings-per-share of $2.87 compared to $2.68 in 2023.

Click here to download our most recent Sure Analysis report on SJW (preview of page 1 of 3 shown below):


KISS Stock #1: Stepan Co. (SCL)

  • 5-year expected returns: 19.9%

Stepan manufactures basic and intermediate chemicals, including surfactants, specialty products, germicidal and fabric softening quaternaries, phthalic anhydride, polyurethane polyols and special ingredients for the food, supplement, and pharmaceutical markets.

It is organized into three distinct business lines: surfactants, polymers, and specialty products. These businesses serve a wide variety of end markets, meaning that Stepan is not beholden to just a handful of industries.

Source: Investor presentation

The surfactants business is Stepan’s largest by revenue, accounting for ~68% of total sales in the most recent quarter. A surfactant is an organic compound that contains both water-soluble and water-insoluble components.

Stepan posted fourth quarter and full-year earnings on February 19th, 2025, and results were mixed once again. Revenue was down 1.2% year-on-year to $526 million, but did beat estimates by almost $5 million. Adjusted earnings-per-share came to 12 cents, which missed estimates by 21 cents.

Global sales volume was off 1% year-over-year as double-digit growth in surfactants was offset and then some by demand weakness in polymers. Surfactants were up 3% year-over-year in Q4 to $379 million. Polymer net sales fell 12% to $130 million.

The company managed to generate about $13 million in pre-tax cost savings during the quarter, and about $48 million for the full year.

Click here to download our most recent Sure Analysis report on SCL (preview of page 1 of 3 shown below):

Final Thoughts

In order for a company to raise its dividend for at least 25 years, it must have durable competitive advantages, highly profitable businesses, and leadership positions in their respective industries.

This is why the Dividend Champions are attractive for long-term investors.

Plus, quality dividend growth stocks allow investors to simply their investing process, with a buy-and-hold approach that can create wealth over the long-run.

Additional Reading

The Dividend Champions list is not the only way to quickly screen for stocks that regularly pay rising dividends.

  • The Dividend Kings List is even more exclusive than the Dividend Aristocrats. It is comprised of 54 stocks with 50+ years of consecutive dividend increases.
  • The High Dividend Stocks List: stocks that appeal to investors interested in the highest yields of 5% or more.
  • The Monthly Dividend Stocks List: stocks that pay dividends every month, for 12 dividend payments per year.

Thanks for reading this article. Please send any feedback, corrections, or questions to [email protected].


Source link

Dividend Aristocrats In Focus: Ecolab


Updated on March 5th, 2025 by Felix Martinez

There are just 69 stocks on the list of Dividend Aristocrats, members of the S&P 500 Index that have raised their dividends for 25+ consecutive years.

We view the Dividend Aristocrats as among the best dividend stocks to buy and hold.

You can download a free list of all 69 Dividend Aristocrats, along with important metrics like dividend yields and price-to-earnings ratios, by clicking on the link below:


Disclaimer: Sure Dividend is not affiliated with S&P Global in any way. S&P Global owns and maintains The Dividend Aristocrats Index. The information in this article and downloadable spreadsheet is based on Sure Dividend’s own review, summary, and analysis of the S&P 500 Dividend Aristocrats ETF (NOBL) and other sources, and is meant to help individual investors better understand this ETF and the index upon which it is based. None of the information in this article or spreadsheet is official data from S&P Global. Consult S&P Global for official information.

Ecolab (ECL) is an example of a company that possesses all of these qualities. Ecolab has a long history of growth, and has increased its dividend for over 33 years.

This article will examine the various factors behind Ecolab’s rise to prominence and our current rating of Ecolab stock.

Business Overview

Ecolab was created in 1923 when its founder Merritt J. Osborn invented a new cleaning product called “Absorbit”. This product cleaned carpets without the need for businesses to shut down operations to conduct carpet cleaning. Osborn created a company revolving around the product, called Economics Laboratory, or Ecolab.

Today, Ecolab is the industry leader, generating roughly $16 billion in annual sales.

Ecolab operates three major business segments: Global Industrial, Global Institutional, and Global Energy, each roughly equal in size. The business is diversified in terms of operating segments and geography. About 55% of the company’s sales take place outside North America.

In mid-February, Ecolab reported (2/11/25) financial results for the fourth quarter of fiscal 2024. Ecolab delivered a strong fourth quarter and record 2024 performance, with reported diluted EPS up 18% to $1.66 and adjusted EPS rising 17% to $1.81. Sales grew 2% to $4.0 billion, with organic sales up 4%, led by Industrial and Healthcare & Life Sciences. Operating income margins improved, with organic margin reaching 17.4% due to higher sales and strategic investments.

For 2025, Ecolab expects adjusted EPS of $7.42–$7.62, a 12%–15% increase despite a 4% currency impact. Growth will be driven by the One Ecolab strategy, expansion in digital solutions, and strong U.S. market momentum. The company plans to enhance profitability through value-based pricing and operational efficiencies, targeting a 20% operating income margin in the next three years.

Segment-wise, Industrial sales grew 4%, Institutional and specialty sales 6%, and Pest Elimination 7%, while Healthcare and life Sciences rose 3% despite divestitures. Strong cash flow, strategic investments, and efficiency initiatives position Ecolab for continued success in 2025 and beyond.

Source: Investor Presentation

Growth Prospects

Ecolab grew its earnings per share by 10.9% per year from 2011 to 2019. However, it declined in 2020 due to the pandemic and in 2022 due to high inflation. We view these headwinds as temporary and expect 10% average annual growth of earnings per share over the next five years.

Source: Investor Presentation

One of the company’s most important growth catalysts is acquisitions. In late 2021, Ecolab acquired Purolite for $3.7 billion in cash. Purolite sells high-end ion exchange resins for the separation of solutions in over 30 countries. It generates annual sales of approximately $400 million.

Ecolab has proven successful at integrating other acquisitions, so we remain positive about the company’s ability to do so in the future. Acquisitions such as these and organic investment have fueled steady earnings growth for decades.

We feel that the company is well-positioned to continue growing. Over the next five years, we expect ECL to grow earnings per share by 10% per year.

Competitive Advantages & Recession Performance

Ecolab’s many competitive advantages include scale, a strong reputation among its customers, and innovation. Ecolab serves more than 1 million customer locations spread across more than 170 countries. The company is not afraid to spend significant resources on research and development of new products and services.

Management refers to R&D spending as its “innovation pipeline.” Ecolab often spends more than $1 billion on this pipeline. Due in large part to this R&D spending, the company has more than 9,000 patents.

Ecolab’s R&D investments and intellectual property help the company stay ahead of the competition. These investments have created an incredibly strong business that can hold up very well even during economic downturns.

For clear evidence of Ecolab’s competitive advantages, look no further than its performance during the Great Recession:

  • 2006 earnings-per-share of $1.43
  • 2007 earnings-per-share of $1.66 (16% increase)
  • 2008 earnings-per-share of $1.86 (12% increase)
  • 2009 earnings-per-share of $1.99 (7% increase)
  • 2010 earnings-per-share of $2.23 (12% increase)

Ecolab’s growth during the Great Recession was truly remarkable. Not only did the company generate positive earnings growth in each year of the recession, but it achieved double-digit earnings growth in three of those years.

Valuation & Expected Returns

Based on the current trading price of $269 and expected earnings-per-share of $7.55, Ecolab has a price-to-earnings ratio of 35.6. The stock has a ten-year average price-to-earnings ratio of 20. We have a target price-to-earnings ratio of 20. If shares of Ecolab were to return to our target valuation by 2030, this would reduce total returns by 10.7% per year.

The stock is in danger of experiencing a contraction of the valuation multiple, which would negatively impact total returns. Ecolab’s dividend will not likely represent a large portion of total returns. This is because the current dividend yield is just 0.9%. This is lower than the average dividend yield of the S&P 500 Index.

Ecolab’s dividend growth streak now totals 33 consecutive years.

A breakdown of potential five-year returns is as follows:

  • 10.0% earnings growth
  • 0.9% dividend yield
  • 10.7% valuation reversion

We expect Ecolab to offer a total annual return of 0.2% through 2030. Valuation headwinds are likely to wear down most of the company’s potential returns from its earnings and dividend growth prospects.

While Ecolab is an attractive dividend growth stock due to its high rate of dividend increases, it is not as appealing for income investors or value investors.

Final Thoughts

Ecolab is not likely to be an attractive stock for investors interested solely in high levels of income. It is a very strong stock for investors interested in a recession-resistant business and dividend growth.

Ecolab has an excellent record of profitability and growth and is one of the few companies with a dividend growth streak of at least 25 years. That said, today might not be an ideal time to acquire shares in the company due to the lack of meaningful projected returns over the medium term. Therefore, we rate Ecolab’s shares as a Sell.

If you are interested in finding high-quality dividend growth stocks suitable for long-term investment, the following Sure Dividend databases will be useful:

The major domestic stock market indices are another solid resource for finding investment ideas. Sure Dividend compiles the following stock market databases and updates them monthly:

Thanks for reading this article. Please send any feedback, corrections, or questions to [email protected].


Source link

2025 Monthly Dividend Stocks List | See All 75 Now


Updated on March 6th, 2025 by Bob Ciura
Spreadsheet data updated daily

Monthly dividend stocks are securities that pay a dividend every month instead of quarterly or annually.

This research report focuses on all 77 individual monthly paying securities. It includes the following resources.

Resource #1: The Monthly Dividend Stock Spreadsheet List


This list contains important metrics, including: dividend yields, payout ratios, dividend growth rates, 52-week highs and lows, betas, and more.

Note: We strive to maintain an accurate list of all monthly dividend payers. There’s no universal source we are aware of for monthly dividend stocks; we curate this list manually. If you know of any stocks that pay monthly dividends that are not on our list, please email [email protected].

Resource #2: The Monthly Dividend Stocks In Focus Series
The Monthly Dividend Stocks In Focus series is where we analyze all monthly paying dividend stocks. This resource links to stand-alone analysis on each of these securities.

Resource #3: The 10 Best Monthly Dividend Stocks
This research report analyzes the 10 best monthly dividend stocks as ranked by expected total return.

Resource #4: Other Monthly Dividend Stock Research
Monthly dividend stock performance
Why monthly dividends matter
The dangers of investing in monthly dividend stocks
Final thoughts and other income investing resources

The Monthly Dividend Stocks In Focus Series

You can see detailed analysis on the individual monthly dividend securities we cover by clicking the links below:

  1. Agree Realty (ADC)
  2. AGNC Investment (AGNC)
  3. Atrium Mortgage Investment Corporation (AMIVF)
  4. Apple Hospitality REIT, Inc. (APLE)
  5. ARMOUR Residential REIT (ARR)
  6. A&W Revenue Royalties Income Fund (AWRRF)
  7. Banco Bradesco S.A. (BBD)
  8. Diversified Royalty Corp. (BEVFF)
  9. Boston Pizza Royalties Income Fund (BPZZF)
  10. Bridgemarq Real Estate Services (BREUF)
  11. BSR Real Estate Investment Trust (BSRTF)
  12. Canadian Apartment Properties REIT (CDPYF)
  13. ChemTrade Logistics Income Fund (CGIFF)
  14. Choice Properties REIT (PPRQF)
  15. Cross Timbers Royalty Trust (CRT)
  16. CT Real Estate Investment Trust (CTRRF)
  17. SmartCentres Real Estate Investment Trust (CWYUF)
  18. Dream Industrial REIT (DREUF)
  19. Dream Office REIT (DRETF)
  20. Dynex Capital (DX)
  21. Ellington Residential Mortgage REIT (EARN)
  22. Ellington Financial (EFC)
  23. EPR Properties (EPR)
  24. Exchange Income Corporation (EIFZF)
  25. Extendicare Inc. (EXETF)
  26. Flagship Communities REIT (MHCUF)
  27. First National Financial Corporation (FNLIF)
  28. Freehold Royalties Ltd. (FRHLF)
  29. Firm Capital Property Trust (FRMUF)
  30. Fortitude Gold (FTCO)
  31. Gladstone Capital Corporation (GLAD)
  32. Gladstone Commercial Corporation (GOOD)
  33. Gladstone Investment Corporation (GAIN)
  34. Gladstone Land Corporation (LAND)
  35. Global Water Resources (GWRS)
  36. Granite Real Estate Investment Trust (GRP.U)
  37. H&R Real Estate Investment Trust (HRUFF)
  38. Horizon Technology Finance (HRZN)
  39. Itaú Unibanco (ITUB)
  40. The Keg Royalties Income Fund (KRIUF)
  41. LTC Properties (LTC)
  42. Sienna Senior Living (LWSCF)
  43. Main Street Capital (MAIN)
  44. Modiv Inc. (MDV)
  45. Mullen Group Ltd. (MLLGF)
  46. Northland Power Inc. (NPIFF)
  47. NorthWest Healthcare Properties REIT (NWHUF)
  48. Orchid Island Capital (ORC)
  49. Oxford Square Capital (OXSQ)
  50. Permian Basin Royalty Trust (PBT)
  51. Phillips Edison & Company (PECO)
  52. Pennant Park Floating Rate (PFLT)
  53. Peyto Exploration & Development Corp. (PEYUF)
  54. Pine Cliff Energy Ltd. (PIFYF)
  55. Primaris REIT (PMREF)
  56. Paramount Resources Ltd. (PRMRF)
  57. PermRock Royalty Trust (PRT)
  58. Prospect Capital Corporation (PSEC)
  59. Permianville Royalty Trust (PVL)
  60. Pizza Pizza Royalty Corp. (PZRIF)
  61. Realty Income (O)
  62. RioCan Real Estate Investment Trust (RIOCF)
  63. Richards Packaging Income Fund (RPKIF)
  64. Sabine Royalty Trust (SBR)
  65. Stellus Capital Investment Corp. (SCM)
  66. Savaria Corp. (SISXF)
  67. San Juan Basin Royalty Trust (SJT)
  68. SL Green Realty Corp. (SLG)
  69. Whitecap Resources Inc. (SPGYF)
  70. Slate Grocery REIT (SRRTF)
  71. Stag Industrial (STAG)
  72. Timbercreek Financial Corp. (TBCRF)
  73. Tamarack Valley Energy (TNEYF)
  74. U.S. Global Investors (GROW)
  75. Whitestone REIT (WSR)

The 10 Best Monthly Dividend Stocks

This research report examines the 10 monthly dividend stocks from our Sure Analysis Research Database with the highest 5-year forward expected total returns.

We currently cover nearly 80 monthly dividend stocks every quarter in the Sure Analysis Research Database.

Use the table below to quickly jump to analysis on any of the top 10 best monthly dividend stocks as ranked by expected total returns.

Table of Contents

You can instantly jump to any specific section of the article by using the links below:

Monthly Dividend Stock #10: Realty Income (O)

  • 5-Year Expected Total Return: 7.3%
  • Dividend Yield: 5.5%

Realty Income is a retail real estate focused REIT that has become famous for its successful dividend growth history and monthly dividend payments.

Realty Income owns retail properties that are not part of a wider retail development (such as a mall), but instead are standalone properties.

This means that the properties are viable for many different tenants, including government services, healthcare services, and entertainment.

Source: Investor Presentation

Realty Income reported third-quarter 2024 earnings, with EPS at $0.30, missing estimates by $0.06, but revenue of $1.27 billion, a 26% year-over-year increase, beat expectations by $10.01 million. Net income for common shareholders was $261.8 million.

The company generated $915.6 million in Adjusted Funds from Operations (AFFO), or $1.05 per share. Realty Income invested $740.1 million in new properties, achieving an initial average cash yield of 7.4%, while maintaining a portfolio occupancy of 98.7%.

Click here to download our most recent Sure Analysis report on Realty Income (preview of page 1 of 3 shown below):


Monthly Dividend Stock #9: Agree Realty (ADC)

  • 5-Year Expected Total Return: 8.0%
  • Dividend Yield: 4.1%

Agree Realty is an integrated real estate investment trust (REIT) focused on ownership, acquisition, development, and retail property management.

Agree has developed over 40 community shopping centers throughout the Midwestern and Southeastern United States.

At the end of December 2024, the company owned and operated 2,370 properties located in 50 states, containing approximately 48.8 million square feet of gross leasable space.

Source: Investor Presentation

On February 11th, 2025, Agree Realty Corp. reported fourth quarter and full year results for Fiscal Year (FY) 2024. The company reported its fourth-quarter and full-year 2024 financial results, highlighting continued investment and steady growth.

In Q4, the company invested $371 million in 127 retail net lease properties and launched eight development projects with $45 million in committed capital. Net income per share declined 5.7% to $0.41, while Core FFO and AFFO per share increased 3.5% and 4.7%, respectively.

The company declared a December dividend of $0.253 per share, up 2.4% year-over-year, and raised $651 million through equity offerings, maintaining a strong balance sheet with a net debt-to-EBITDA ratio of 3.3 times.

Click here to download our most recent Sure Analysis report on ADC (preview of page 1 of 3 shown below):

Monthly Dividend Stock #8: EPR Properties (EPR)

  • 5-Year Expected Total Return: 8.5%
  • Dividend Yield: 6.6%

EPR Properties is a specialty real estate investment trust, or REIT, that invests in properties in specific market segments that require industry knowledge to operate effectively.

It selects properties it believes have strong return potential in Entertainment, Recreation, and Education. The portfolio includes about $7 billion in investments across 340+ locations in 44 states, including over 200 tenants.

Source: Investor Presentation

EPR posted fourth quarter and full-year earnings on February 26th, 2025, and results were better than expected on both the top and bottom lines.

Funds-from-operations came to $1.23, which was a penny ahead of estimates. Revenue was up 3% to $177 million, beating estimates by $16 million.

Adjusted FFO per-share was down from $1.29 in Q3, but higher from $1.16 in the year-ago period. Revenue was also down from Q3, but higher from the year-ago period.

Property operating expenses were $15.2 million, higher from $14.6 million in Q3, and $14.8 million a year ago. Adjusted EBITDAre of $136 million was lower from $143 million in Q3, but higher from $129 million last year.

Click here to download our most recent Sure Analysis report on EPR (preview of page 1 of 3 shown below):

Monthly Dividend Stock #7: PennantPark Floating Rate Capital (PFLT)

  • 5-Year Expected Total Return: 8.5%
  • Dividend Yield: 11.1%

PennantPark Floating Rate Capital Ltd. is a business development company that seeks to make secondary direct, debt, equity, and loan investments.

The fund also aims to invest through floating rate loans in private or thinly traded or small market-cap, public middle market companies, equity securities, preferred stock, common stock, warrants or options received in connection with debt investments or through direct investments.

On November 26, 2024, PennantPark Floating Rate Capital reported strong results for the fourth fiscal quarter of 2024, with core net investment income of $0.32 per share. The portfolio grew 20% quarter-over-quarter, reaching $2 billion as the firm deployed $446 million across 10 new and 50 existing companies.

Investments carried an average yield of 11%, reflecting the continued strength of the middle market lending environment. After the quarter, PFLT remained active, investing an additional $330 million at a yield of 10.2%.

Click here to download our most recent Sure Analysis report on PFLT (preview of page 1 of 3 shown below):

Monthly Dividend Stock #6: LTC Properties (LTC)

  • 5-Year Expected Total Return: 6.3%
  • Dividend Yield: 8.7%

LTC Properties is a REIT that invests in senior housing and skilled nursing properties. Its portfolio consists of approximately 50% senior housing and 50% skilled nursing properties.

The REIT owns 194 investments in 26 states, with 31 operating partners.

Source: Investor Presentation

In late February, LTC reported (2/24/25) financial results for the fourth quarter of fiscal 2024. Funds from operations (FFO) per share dipped -8% over the prior year’s quarter, from $0.72 to $0.66, and missed the analysts’ consensus by $0.01.

The decrease in FFO per share resulted primarily from impairment losses. LTC improved its leverage ratio (Net Debt to EBITDA) from 4.7x to 4.3x thanks to various asset sales.

Click here to download our most recent Sure Analysis report on LTC (preview of page 1 of 3 shown below):

Monthly Dividend Stock #5: AGNC Investment Corp. (AGNC)

  • 5-Year Expected Total Return: 9.2%
  • Dividend Yield: 14.0%

American Capital Agency Corp is a mortgage real estate investment trust that invests primarily in agency mortgagebacked securities (or MBS) on a leveraged basis.

The firm’s asset portfolio is comprised of residential mortgage passthrough securities, collateralized mortgage obligations (or CMO), and nonagency MBS. Many of these are guaranteed by governmentsponsored enterprises.

AGNC Investment Corp. reported strong financial results for the third quarter ended September 30, 2024. The company achieved a comprehensive income of $0.63 per common share, driven by a net income of $0.39 and other comprehensive income of $0.24 from marked-to-market investments.

Net spread and dollar roll income contributed $0.43 per share. The tangible net book value increased by $0.42 per share to $8.82, reflecting a 5.0% growth from the previous quarter.

AGNC declared dividends of $0.36 per share, resulting in a 9.3% economic return on tangible common equity, which includes both dividends and the increase in net book value.

Click here to download our most recent Sure Analysis report on AGNC Investment Corp (AGNC) (preview of page 1 of 3 shown below):


Monthly Dividend Stock #4: STAG Industrial (STAG)

  • 5-Year Expected Total Return: 9.6%
  • Dividend Yield: 4.0%

STAG Industrial is an owner and operator of industrial real estate. It is focused on single-tenant industrial properties and has ~560 buildings across 41 states in the United States.

The focus of this REIT on single-tenant properties might create higher risk compared to multi-tenant properties, as the former are either fully occupied or completely vacant.

Source: Investor Presentation

In mid-February, STAG Industrial reported (2/12/25) financial results for the fourth quarter of fiscal 2024. Core FFO-per-share grew 5% over the prior year’s quarter, from $0.58 to $0.61, exceeding the analysts’ consensus by $0.01, thanks to hikes in rent rates.

Net operating income grew 9% over the prior year’s quarter even though the occupancy rate dipped sequentially from 97.1% to 96.5%. On the other hand, interest expense increased 25% year-on-year due to high interest rates.

STAG expects core FFO per share of $2.46-$2.50 for 2025.

Click here to download our most recent Sure Analysis report on STAG Industrial Inc. (STAG) (preview of page 1 of 3 shown below):


Monthly Dividend Stock #3: Horizon Technology Finance (HRZN)

  • 5-Year Expected Total Return: 15.7%
  • Dividend Yield: 15.2%

Horizon Technology Finance Corp. is a BDC that provides venture capital to small and mediumsized companies in the technology, life sciences, and healthcareIT sectors.

The company has generated attractive riskadjusted returns through directly originated senior secured loans and additional capital appreciation through warrants.

Source: Investor Presentation

On October 29th, 2024, Horizon released its Q3 results for the period ending September 30th, 2024. For the quarter, total investment income fell 15.5% year-over-year to $24.6.7 million, primarily due to lower interest income on investments from the debt investment portfolio.

More specifically, the company’s dollar-weighted annualized yield on average debt investments in Q3 of 2024 and Q3 of 2023 was 15.9% and 17.1%, respectively.

Net investment income per share (IIS) fell to $0.32, down from $0.53 compared to Q3-2023. Net asset value (NAV) per share landed at $9.06, down from $9.12 sequentially.

After paying its monthly distributions, Horizon’s undistributed spillover income as of June 30th, 2024 was $1.27 per share, indicating a considerable cash cushion.

Click here to download our most recent Sure Analysis report on HRZN (preview of page 1 of 3 shown below):

Monthly Dividend Stock #2: Itau Unibanco (ITUB)

  • 5-Year Expected Total Return: 16.5%
  • Dividend Yield: 9.1%

Itaú Unibanco Holding S.A. is headquartered in Sao Paulo, Brazil. The bank has operations across South America and other places like the United States, Portugal, Switzerland, China, Japan, etc.

On November 5th, 2024, Itaú Unibanco reported third-quarter results for 2024. The company reported recurring managerial result for the third quarter of 2024 was approximately $2.1 billion USD, reflecting a 6.0% increase from the previous quarter.

The recurring managerial return on equity stood at 22.7% on a consolidated basis and 23.8% for operations in Brazil.

Total assets grew by 2.6%, surpassing $590 billion USD, while the loan portfolio increased by 1.9% globally and 2.1% in Brazil for the quarter, with year-on-year growth rates of 9.9% and 10.0%, respectively.

Key drivers included personal, vehicle, and mortgage loans, which saw quarterly growth rates of 3.1%, 3.0%, and 3.9%, respectively.

Click here to download our most recent Sure Analysis report on ITUB (preview of page 1 of 3 shown below):

Monthly Dividend Stock #1: Ellington Credit Co. (EARN)

  • 5-Year Expected Total Return: 16.8%
  • Dividend Yield: 15.0%

Ellington Credit Co. acquires, invests in, and manages residential mortgage and real estate related assets. Ellington focuses primarily on residential mortgage-backed securities, specifically those backed by a U.S. Government agency or U.S. governmentsponsored enterprise.

Agency MBS are created and backed by government agencies or enterprises, while non-agency MBS are not guaranteed by the government.

Source: Investor Presentation

On November 12th, 2024, Ellington Residential reported its third quarter results for the period ending September 30th, 2024. The company generated net income of $5.4 million, or $0.21 per share.

Ellington achieved adjusted distributable earnings of $7.2 million in the quarter, leading to adjusted earnings of $0.28 per share, which covered the dividend paid in the period.

Net interest margin was 5.22% overall. At quarter end, Ellington had $25.7 million of cash and cash equivalents, and $96 million of other unencumbered assets.

Click here to download our most recent Sure Analysis report on EARN (preview of page 1 of 3 shown below):

Other Monthly Dividend Stock Resources

Each separate monthly dividend stock has its own unique characteristics. The resources below will give you a better understanding of monthly dividend stock investing.

The following research reports will help you generate more monthly dividend stock investment ideas.

Monthly Dividend Stock Performance
In February 2025, a basket of the monthly dividend stocks above generated negative returns of -18.4%. For comparison, the Russell 2000 ETF (IWM) generated negative returns of -8.3% for the month.

Notes: Data for performance is from Ycharts. Canadian company performance may be in the company’s home currency. 

Monthly dividend stocks under-performed the Russell 2000 last month. We will update our performance section monthly to track future monthly dividend stock returns.

In February 2025, the 3 best-performing monthly dividend stocks (including dividends) were:

  • Extendicare Inc. (EXETF), up 24.8%
  • San Juan Basin Royalty Trust (SJT) , up 18.9%
  • EPR Properties (EPR), up 16.4%

The 3 worst-performing monthly dividend stocks (including dividends) in the month were:

  • Mullen Group Ltd. (MLLGF), down 10.9%
  • Savaria Corp. (SISFX), down 13.7%
  • Exchange Income Corp. (EIFZF), down 15.4%

Why Monthly Dividends Matter
Monthly dividend payments are beneficial for one group of investors in particular; retirees who rely on dividend stocks for income.

With that said, monthly dividend stocks are better under all circumstances (everything else being equal), because they allow for returns to be compounded on a more frequent basis. More frequent compounding results in better total returns, particularly over long periods of time.

Consider the following performance comparison:

Monthly vs Quarterly Compounding Over 40 YearsMonthly vs Quarterly Compounding Over 40 Years

Over the long run, monthly compounding generates slightly higher returns over quarterly compounding. Every little bit helps.

With that said, it might not be practical to manually re-invest dividend payments on a monthly basis. It is more feasible to combine monthly dividend stocks with a dividend reinvestment plan to dollar cost average into your favorite dividend stocks.

The last benefit of monthly dividend stocks is that they allow investors to have – on average – more cash on hand to make opportunistic purchases. A monthly dividend payment is more likely to put cash in your account when you need it versus a quarterly dividend.

Case-in-point: Investors who bought a broad basket of stocks at the bottom of the 2008-2009 financial crisis are likely sitting on triple-digit total returns from those purchases today.

The Dangers of Investing In Monthly Dividend Stocks
Monthly dividend stocks have characteristics that make them appealing to do-it-yourself investors looking for a steady stream of income. Typically, these are retirees and people planning for retirement.

Investors should note many monthly dividend stocks are highly speculative. On average, monthly dividend stocks tend to have elevated payout ratios. An elevated payout ratio means there’s less margin for error to continue paying the dividend if business results suffer a temporary (or permanent) decline.

As a result, we have real concerns that many monthly dividend payers will not be able to continue paying rising dividends in the event of a recession.

Additionally, a high payout ratio means that a company is retaining little money to invest for future growth. This can lead management teams to aggressively leverage their balance sheet, fueling growth with debt. High debt and a high payout ratio is perhaps the most dangerous combination around for a potential future dividend reduction.

With that said, there are a handful of high-quality monthly dividend payers around. Chief among them is Realty Income (O). Realty Income has paid increasing dividends (on an annual basis) every year since 1994.

The Realty Income example shows that there are high-quality monthly dividend payers around, but they are the exception rather than the norm. We suggest investors do ample due diligence before buying into any monthly dividend payer.

Final Thoughts & Other Income Investing Resources

Financial freedom is achieved when your passive investment income exceeds your expenses. But the sequence and timing of your passive income investment payments can matter.

Monthly payments make matching portfolio income with expenses easier. Most personal expenses recur monthly whereas most dividend stocks pay quarterly. Investing in monthly dividend stocks matches the frequency of portfolio income payments with the normal frequency of personal expenses.

Additionally, many monthly dividend payers offer investors high yields. The combination of a monthly dividend payment and a high yield should be especially appealing to income investors.

But not all monthly dividend payers offer the safety that income investors need. A monthly dividend is better than a quarterly dividend, but not if that monthly dividend is reduced soon after you invest. The high payout ratios and shorter histories of most monthly dividend securities mean they tend to have elevated risk levels.

Because of this, we advise investors to look for high-quality monthly dividend payers with reasonable payout ratios, trading at fair or better prices.


Additionally, see the resources below for more compelling investment ideas for dividend growth stocks and/or high-yield investment securities.

Thanks for reading this article. Please send any feedback, corrections, or questions to [email protected].


Source link

Dividend Aristocrats In Focus: Target Corporation


Updated on March 4th, 2025 by Felix Martinez

Every year, we publish a review of each of the Dividend Aristocrats, a group of 69 companies in the S&P 500 Index with 25+ consecutive years of dividend increases. Thanks to their long histories of annual dividend increases and strong business models, we believe the Dividend Aristocrats are among the best dividend stocks to buy.

With that in mind, we created a list of all 69 Dividend Aristocrats. You can download your copy of the Dividend Aristocrats list (along with important metrics like dividend yields and price-to-earnings ratios) by clicking on the link below:


Disclaimer: Sure Dividend is not affiliated with S&P Global in any way. S&P Global owns and maintains The Dividend Aristocrats Index. The information in this article and downloadable spreadsheet is based on Sure Dividend’s own review, summary, and analysis of the S&P 500 Dividend Aristocrats ETF (NOBL) and other sources, and is meant to help individual investors better understand this ETF and the index upon which it is based. None of the information in this article or spreadsheet is official data from S&P Global. Consult S&P Global for official information.

Next on our list of Dividend Aristocrats is Target Corporation (TGT).

Target has a long history of dividend growth. The company has grown its dividend for 57 consecutive years. Target is a Dividend King, an even more exclusive list of companies that have increased dividends for at least 50 consecutive years.

Target has been one of the best-performing retail stocks over the last five years, thanks to its execution of numerous growth initiatives.

Business Overview

Target is a discount retail giant with a market capitalization of $80 billion. Today, it operates approximately 1,956 stores in the U.S. and an e-commerce business. It has a diverse product lineup and annual sales of more than $107 billion.

The company has implemented many growth initiatives in recent years. As a result, Target has returned to its long-term growth trajectory in the last five years.

Target posted fourth quarter and full-year earnings on March 5th, 2024, with strong results. The company reported net sales down 0.8% due to one fewer sales week compared to 2023. On a comparable 52-week basis, net sales grew 1%, and earnings per share increased nearly 3%. Fourth-quarter comparable sales rose 1.5%, driven by strong traffic and an 8.7% increase in digital sales. GAAP and adjusted EPS for the quarter were $2.41, while full-year EPS reached $8.86, aligning with initial projections. Key growth categories included Apparel, Toys, and Electronics.

Operationally, Target achieved over $2 billion in cost savings over two years. Full-year comparable sales were flat at 0.1%, with strength in Beauty, Apparel, and Essentials. Traffic increased 1.4% across stores and digital channels. However, higher supply chain and promotional costs led to a decline in operating income, with the fourth-quarter margin falling to 4.7% from 5.8% in 2023.

For 2025, Target expects around 1% sales growth and a modest increase in operating margins. However, factors like tariff uncertainties and shifting consumer confidence may pressure short-term profits. The company remains focused on digital expansion, supply chain improvements, and shareholder returns, including dividend increases and stock buybacks, with $8.7 billion still available under its repurchase program.

Source: Investor Presentation

Growth Prospects

Target has grown its earnings per share by 8% per year on average over the last decade. The retailer stagnated during 2012-2017 due to its failed attempt to expand into Canada, but thanks to some growth initiatives, it has returned to strong growth mode since 2017.

The biggest reason for this excellent growth is that Target has invested heavily in growing new sales channels, which have paid off. First, Target has invested heavily in e-commerce. The rise in e-commerce initially caught many retail companies, including Target, off-guard. Target has revamped its online offerings and has seen rapid growth.

Target has also rolled out its same-day fulfillment service. Lastly, the company continues redeveloping stores and building smaller stores with much less square footage in places that cannot provide the necessary space to build a large store. These stores are located in areas that see high traffic, such as densely populated large cities and college campuses.

Taken together, these measures have significantly affected Target’s growth. We expect Target to grow its earnings per share by 7% per year over the next five years.

Source: Investor Presentation

Competitive Advantages & Recession Performance

Target operates in a difficult industry. Retail is highly competitive and thus it is characterized by razor-thin profit margins. Retail brands often take a back seat to price and convenience for consumers.

This is why Target has invested so heavily in store redevelopment. That has enabled the company to retain its brand strength, even in a fiercely competitive industry. Most importantly, the retailer has massive distribution and scale capabilities allow it to keep prices low.

In addition, Target operates in a defensive retail niche. Discount retail tends to hold up relatively well during economic downturns, when consumers typically shift from higher-priced retailers.

Target’s earnings-per-share during the Great Recession are as follows:

  • 2007 earnings-per-share of $3.33
  • 2008 earnings-per-share of $2.86 (14% decline)
  • 2009 earnings-per-share of $3.30 (15% increase)
  • 2010 earnings-per-share of $3.88 (17% increase)
  • 2011 earnings-per-share of $4.28 (10% increase)

Target proved remarkably resilient during the Great Recession. It posted a 14% decline in 2008 but followed this with three consecutive years of double-digit earnings growth.

Target once again performed very well in 2020, a year in which the U.S. economy encountered a fierce recession due to the pandemic. And yet, Target continues to raise its dividend reliably each year.

Valuation & Expected Returns

Based on the current share price of $117, Target has a price-to-earnings ratio of 12.5. Our fair value multiple is 17. If shares were to revert to their average price-to-earnings ratio, TGT stock would see annual returns increase by 3.5% over the next five years due to a falling P/E multiple.

At the same time, Target is offering a 3.7% dividend yield. Adding expected annual earnings per share growth of 7%, total returns come out to 14.2% per year over the next five years. This is a fairly attractive expected return for such a recession-resistant business model.

With annualized expected returns above 14%, we rate TGT stock a buy.

Final Thoughts

Target has faced some major downturns over the last decade. It failed to expand into Canada and struggled dealing with the rise of e-commerce shopping along with the rest of retail, but the company appears to have returned to sustained growth.

Overall, we feel that Target’s current valuation is slightly elevated, but the company’s strong EPS growth justifies a higher valuation. We rate the stock as a buy.

If you are interested in finding more high-quality dividend growth stocks suitable for long-term investment, the following Sure Dividend databases will be useful:

The major domestic stock market indices are another solid resource for finding investment ideas. Sure Dividend compiles the following stock market databases and updates them monthly:

Thanks for reading this article. Please send any feedback, corrections, or questions to [email protected].


Source link

Dividend Aristocrats In Focus: Genuine Parts Company


Updated on March 3rd, 2025 by Felix Martinez

The Dividend Aristocrats are among the highest-quality dividend growth stocks an investor can buy. They have increased their dividends for 25+ consecutive years.

Becoming a Dividend Aristocrat is no small feat. Beyond certain market capitalization and trading volume requirements, Dividend Aristocrats must have raised their dividends each year for at least 25 years, and be included in the S&P 500 Index.

This presents a high hurdle that relatively few companies can clear. For example, there are currently 69 Dividend Aristocrats out of the 500 companies that comprise the S&P 500 Index.

We created a complete list of all 69 Dividend Aristocrats, along with important financial metrics like dividend yields and price-to-earnings ratios. You can download an Excel spreadsheet of all 69 Dividend Aristocrats by clicking the link below:


Disclaimer: Sure Dividend is not affiliated with S&P Global in any way. S&P Global owns and maintains The Dividend Aristocrats Index. The information in this article and downloadable spreadsheet is based on Sure Dividend’s own review, summary, and analysis of the S&P 500 Dividend Aristocrats ETF (NOBL) and other sources, and is meant to help individual investors better understand this ETF and the index upon which it is based. None of the information in this article or spreadsheet is official data from S&P Global. Consult S&P Global for official information.

An even smaller group of stocks have raised their dividends for 50+ years in a row. These are known as the Dividend Kings.

Genuine Parts (GPC) has increased its dividend for 69 consecutive years, giving it one of the longest dividend growth streaks in the market. You can see all 54 Dividend Kings here.

There is nothing overly exciting about Genuine Parts’ business model. Still, its steady annual dividend increases prove that a “boring” business can be just what income investors need for long-term dividend growth.

Business Overview

Genuine Parts traces its roots back to 1928, when Carlyle Fraser purchased Motor Parts Depot for $40,000 and renamed it Genuine Parts Company. The original Genuine Parts store had annual sales of just $75,000 and only 6 employees.

It has grown into a sprawling conglomerate that sells automotive and industrial parts, electrical materials, and general business products. Its global reach includes North America, Australia, New Zealand, and Europe and is comprised of more than 3,000 locations.

Source: Investor Presentation 

The industrial parts group sells industrial replacement parts to MRO (maintenance, repair, and operations) and OEM (original equipment manufacturer) customers. Customers are derived from a wide range of segments, including food and beverage, metals and mining, oil and gas, and health care.

Genuine Parts posted fourth quarter and full-year earnings on February 18th, 2025. The company reported steady growth in 2024, with fourth-quarter sales rising 3.3% to $5.8 billion and full-year sales reaching $23.5 billion. Adjusted diluted EPS was $1.61 for Q4 and $8.16 for the year. The company generated $1.3 billion in operating cash flow and returned $705 million to shareholders through dividends and buybacks.

Global automotive sales grew 6.1%, while industrial sales declined 1.2%. GPC continued its restructuring efforts, achieving significant cost savings. It also increased its dividend for the 69th consecutive year, raising the annual payout to $4.12 per share.

For 2025, GPC forecasts 2%–4% revenue growth, adjusted EPS of $7.75–$8.25, and up to $1.0 billion in free cash flow. The company remains focused on efficiency, cost control, and shareholder value.

Growth Prospects

Genuine Parts should benefit from structural trends, as the environment for auto replacement parts is highly positive. Consumers are holding onto their cars longer and increasingly making minor repairs to keep cars on the road longer, rather than buying new cars.

As average costs of vehicle repair increase as the car ages, this directly benefits Genuine Parts.

According to Genuine Parts, vehicles aged six years or older now represent over ~70% of cars on the road. This bodes very well for Genuine Parts.

In addition, the automotive aftermarket products and services market is significant. Genuine Parts has a sizable portion of the $200 billion (and growing) automotive aftermarket business.

Source: Investor Presentation

One way the company has historically captured market share in this space has been through acquisitions. It has made several acquisitions throughout its history.

For example, Genuine Parts acquired Alliance Automotive Group for $2 billion. Alliance is a European vehicle parts, tools, and workshop equipment distributor. More recently, in 2022, Genuine Parts completed its $1.3 billion all-cash purchase of Kaman Distribution Group, a leading power transmission, automation, and fluid power company.

Finally, expense reductions will aid earnings growth. The company noted it is undergoing a corporate restructuring to lower headcount and improve efficiency. These changes should result in better operating margins over time.

We expect 9% annual EPS growth over the next five years for Genuine Parts.

Competitive Advantages & Recession Performance

The biggest challenge facing the retail industry right now, is the threat of e-commerce competition. However, automotive parts retailers like NAPA are not exposed to this risk.

Automotive repairs are often complex, challenging tasks. NAPA is a leading brand, thanks partly to its reputation for quality products and service. Customers value being able to ask questions to qualified staff, which gives Genuine Parts a competitive advantage.

Genuine Parts has a leadership position across its businesses. All four of its operating segments represent the #1 or #2 brand in their respective categories, leading to a strong brand and steady customer demand.

Genuine Parts’ earnings-per-share during the Great Recession are below:

  • 2007 earnings-per-share of $2.98
  • 2008 earnings-per-share of $2.92 (2.0% decline)
  • 2009 earnings-per-share of $2.50 (14% decline)
  • 2010 earnings-per-share of $3.00 (20% increase)

Earnings-per-share declined significantly in 2009, which should come as no surprise. Consumers tend to tighten their belts when the economy enters a downturn.

That said, Genuine Parts remained highly profitable throughout the recession, and returned to growth in 2010 and beyond. The company remained highly profitable in 2020, despite the economic damage caused by the coronavirus pandemic.

There will always be a certain level of demand for automotive parts, which gives Genuine Parts’ earnings a high floor.

Valuation & Expected Returns

Based on the most recent closing price of ~$124 and expected 2025 earnings-per-share of $7.95, Genuine Parts has a price-to-earnings ratio of 15.6. Our fair value estimate for Genuine Parts is a price-to-earnings ratio of 15.

As a result, Genuine Parts is slightly overvalued at present. Multiple expansion could decrease annual returns by 0.7% per year over the next five years.

Genuine Parts’ future earnings growth and dividends will add to future returns. We expect Genuine Parts to grow its earnings-per-share by 9% annually over the next five years.

The stock also has a 3.3% current dividend yield. Genuine Parts has a highly sustainable dividend. The company has paid a yearly dividend since it went public in 1948.

Adding it all up, Genuine Parts’ total annual returns could consist of the following:

  • 9% earnings growth
  • 3.3% dividend yield
  • 0.7% valuation multiple compression

Genuine Parts is expected to generate total annual returns of 11.6% over the next five years. This is a strong rate of return, making the stock a buy.

Final Thoughts

Genuine Parts does not get much coverage in the financial media. It is far from the high-flying tech startups that typically receive more attention. However, Genuine Parts is a very appealing stock for investors looking for stable profitability and reliable dividend growth.

Due to favorable industry dynamics, the company has a long runway of growth ahead. It should continue to raise its dividend each year, as it has for the past 69 years.

Given its history of dividend growth, Genuine Parts is suitable for investors desiring income and steady dividend increases each year. With an 11.6% expected rate of return, GPC stock is a buy.

If you are interested in finding more high-quality dividend growth stocks suitable for long-term investment, the following Sure Dividend databases will be useful:

The major domestic stock market indices are another solid resource for finding investment ideas. Sure Dividend compiles the following stock market databases and updates them monthly:

Thanks for reading this article. Please send any feedback, corrections, or questions to [email protected].


Source link

2025 High Dividend Stocks List


Article updated on March 5th, 2025 by Bob Ciura

Spreadsheet data updated daily

High dividend stocks are stocks with a dividend yield well in excess of the market average dividend yield of ~1.3%.

The resources in this report focus on truly high yielding securities, often with dividend yields multiples higher than the market average.

Resource #1: The High Dividend Stocks List Spreadsheet


Note: The spreadsheet uses the Wilshire 5000 as the universe of securities from which to select, plus a few additional securities we screen for with 5%+ dividend yields.

The free high dividend stocks list spreadsheet has our full list of ~140 individual securities (stocks, REITs, MLPs, etc.) with 5%+ dividend yields.

The high dividend stocks spreadsheet has important metrics to help you find compelling ultra high yield income investing ideas. These metrics include:

  • Market cap
  • Payout ratio
  • Dividend yield
  • Trailing P/E ratio
  • Annualized 5-year dividend growth rate

Resource #2: The 7 Best High Yield Stocks Now
This resource analyzes the 7 best high-yield stocks in detail. The criteria we use to rank high dividend securities in this resource are:

  • Is in the 870+ income security Sure Analysis Research Database
  • Rank based on dividend yield, from highest to lowest
  • Dividend Risk Scores of C or better
  • Based in the U.S.

Additionally, a maximum of three stocks are allowed for any single sector to ensure diversification.

Resource #3: The High Dividend 50 Series
The High Dividend 50 Series is where we analyze the 50 highest-yielding securities in the Sure Analysis Research Database. The series consists of 50 stand-alone analysis reports on these securities.

Resource #4: More High-Yield Investing Research
– How to calculate your income per month based on dividend yield
– The risks of high-yield investing
– Other high dividend research

The 7 Best High Yield Stocks Now

This resource analyzes the 7 best high yielding securities in the Sure Analysis Research Database as ranked by the following criteria:

  • Rank based on dividend yield, from highest to lowest
  • Dividend Risk Scores of C or better
  • Based in the U.S.

Note: Ranking data is from the current edition of the Sure Analysis spreadsheet.

Additionally, a maximum of three stocks are allowed for any single market sector to ensure diversification.

It’s difficult to define ‘best’. Here, we are using ‘best’ in terms of highest yields with reasonable and better dividend safety.

A tremendous amount of research goes into finding these 7 high yield securities. We analyze more than 850 income securities every quarter in the Sure Analysis Research Database. This is real analysis done by our analyst team, not a quick computer screen.

“So I think it was just looking at different companies and I always thought if you looked at 10 companies, you’d find one that’s interesting, if you’d look at 20, you’d find two, or if you look at 100 you’ll find 10. The person that turns over the most rocks wins the game. I’ve also found this to be true in my personal investing.”
– Investing legend Peter Lynch

Click here to download a PDF report for just one of the 850+ income securities we cover in Sure Analysis to get an idea of the level of work that goes into finding compelling income investments for our audience.

The 7 best high yield securities are listed in order by dividend yield below, from lowest to highest.

High Dividend Stock #7: Enterprise Products Partners LP (EPD)

  • Dividend Yield: 6.4%
  • Dividend Risk Score: B

Enterprise Products Partners was founded in 1968. It is structured as a Master Limited Partnership, or MLP, and operates as an oil and gas storage and transportation company.

Enterprise Products has a large asset base which consists of nearly 50,000 miles of natural gas, natural gas liquids, crude oil, and refined products pipelines.

It also has storage capacity of more than 250 million barrels. These assets collect fees based on volumes of materials transported and stored.

Source: Investor Presentation

Enterprise Products Partners reported strong fourth-quarter 2024 earnings, delivering $1.6 billion in net income, or $0.74 per common unit, representing a 3% increase over the prior year.

Adjusted cash flow from operations rose 4% to $2.3 billion, with the company declaring a quarterly distribution of $0.535 per unit, a 4% year-over-year increase.

Enterprise also continued its capital return strategy, repurchasing 2.1 million common units during the quarter and 7.6 million units for the full year, bringing total buybacks under its program to $1.1 billion.

For the full year, the company posted $9.9 billion in EBITDA, moving 12.9 million barrels of oil equivalent per day.

Click here to download our most recent Sure Analysis report on EPD (preview of page 1 of 3 shown below):

High Dividend Stock #6: Polaris Inc. (PII)

  • Dividend Yield: 6.6%
  • Dividend Risk Score: B

Polaris designs, engineers, and manufactures snowmobiles, all-terrain vehicles (ATVs) and motorcycles. In addition, related accessories and replacement parts are sold with these vehicles through dealers located throughout the U.S.

The company operates under 30+ brands including Polaris, Ranger, RZR, Sportsman, Indian Motorcycle, Slingshot and Transamerican Auto Parts. The global powersports maker, serving over 100 countries, generated $7.2 billion in sales in 2024.

Source: Investor Presentation

On January 28th, 2025, Polaris announced fourth quarter and full year results. For the quarter, revenue declined 23.6% to $1.75 billion, but this was $70 million higher than excepted. Adjusted earnings-per-share of $0.92 compared very unfavorably to $1.98 in the prior year, but topped estimates by $0.02.

For the year, revenue fell 19.7% to $7.12 billion while adjusted earnings-per-share of $3.25 was down from $9.16 in 2023.

For the quarter, Marine sales declined 4%, On-Road was lower by 21%, and Off-Road, the largest component of the company, decreased 25%.

As with previous quarters, decreases in all three businesses were mostly due to lower volumes. Off-Road was also negatively impacted planned reductions in shipments. Parts, Garments, and Accessories were weaker in the Off-Road and On-Road segments.

Click here to download our most recent Sure Analysis report on PII (preview of page 1 of 3 shown below):

High Dividend Stock #5: MPLX LP (MPLX)

  • Dividend Yield: 7.2%
  • Dividend Risk Score: C

MPLX LP is a Master Limited Partnership that was formed by the Marathon Petroleum Corporation (MPC) in 2012. In 2019, MPLX acquired Andeavor Logistics LP.

The business operates in two segments:

  • Logistics and Storage, which relates to crude oil and refined petroleum products
  • Gathering and Processing, which relates to natural gas and natural gas liquids (NGLs)

In early February, MPLX reported (2/4/25) financial results for the fourth quarter of fiscal 2024. Adjusted EBITDA and distributable cash flow (DCF) per share grew 9% and 7%, respectively, primarily thanks to higher tariff rates and increased volumes of liquids and gas.

MPLX maintained a healthy consolidated debt to adjusted EBITDA ratio of 3.1x and a solid distribution coverage ratio of 1.5x.

Click here to download our most recent Sure Analysis report on MPLX (preview of page 1 of 3 shown below):

High Dividend Stock #4: Altria Group (MO)

  • Dividend Yield: 7.2%
  • Dividend Risk Score: B

Altria is a tobacco stock that sells cigarettes, chewing tobacco, cigars, e-cigarettes, and more under a variety of brands, including Marlboro, Skoal, and Copenhagen, among others.

With a current dividend yield of nearly 8%, Altria is an ideal retirement investment stock.

This is a period of transition for Altria. The decline in the U.S. smoking rate continues. In response, Altria has invested heavily in new products that appeal to changing consumer preferences, as the smoke-free category continues to grow.

Source: Investor Presentation

The company also has a 35% investment stake in e-cigarette maker JUUL, and a 45% stake in the Canadian cannabis producer Cronos Group (CRON).

Altria Group reported solid financial results for the fourth quarter and full year of 2024. For the fourth quarter, revenue of $5.1 billion beat analyst estimates by $50 million, and increased 1.6% year-over-year. Adjusted EPS of $1.29 beat by a penny.

For the full year, Altria generated adjusted diluted EPS growth of 3.4% and returned over $10.2 billion to shareholders through dividends and share repurchases.

For 2025, Altria expects adjusted diluted EPS in a range of $5.22 to $5.37. This represents an adjusted diluted EPS growth rate of 2% to 5% for 2025.

Click here to download our most recent Sure Analysis report on Altria (preview of page 1 of 3 shown below):

High Dividend Stock #3: Universal Health Realty Income Trust (UHT)

  • Dividend Yield: 7.3%
  • Dividend Risk Score: B

Universal Health Realty Income Trust operates as a real estate investment trust (REIT), specializing in the healthcare sector. The trust owns healthcare and human service-related facilities.

Its property portfolio includes acute care hospitals, medical office buildings, rehabilitation hospitals, behavioral healthcare facilities, sub-acute care facilities and childcare centers. Universal Health’s portfolio consists of 69 properties in 20 states.

On October 24, 2024, UHT reported its third quarter results. Funds from Operations (FFO) saw a slight improvement, rising to $11.3 million, or $0.82 per diluted share, from $11.2 million, or $0.81 per diluted share, in the third quarter of 2023. This increase in FFO was mainly due to the rise in net income during the period.

The company maintained a strong liquidity position with significant cash reserves and continued strategic investments to enhance its property portfolio.

Click here to download our most recent Sure Analysis report on UHT (preview of page 1 of 3 shown below):

High Dividend Stock #2: Whirlpool Corp. (WHR)

  • Dividend Yield: 7.7%
  • Dividend Risk Score: B

Whirlpool Corporation, founded in 1955 and headquartered in Benton Harbor, MI, is a leading home appliance company with top brands Whirlpool, KitchenAid, and Maytag.

Roughly half of the company’s sales are in North America, but Whirlpool does business around the world under twelve principal brand names. The company, which employs about 44,000 people, generated nearly $17 billion in sales in 2024.

On January 29th, 2025, Whirpool reported fourth quarter 2024 results. Sales for the quarter totaled $4.14 billion, down 18.7% from fourth quarter 2023. Ongoing earnings per diluted share was $4.57 for the quarter, 19% higher than the previous year’s $3.85 per share.

Whirlpool issued its 2025 guidance, seeing ongoing earnings-per-share coming in at approximately $10.00 on revenue of $15.8 billion. Additionally, Whirlpool expects cash provided by operating activities to total roughly $1 billion, with $500 to $600 million in free cash flow.

Click here to download our most recent Sure Analysis report on WHR (preview of page 1 of 3 shown below):


High Dividend Stock #1: Western Union (WU)

  • Dividend Yield: 9.2%
  • Dividend Risk Score: C

The Western Union Company is the world leader in the business of domestic and international money transfers. The company has a network of approximately 550,000 agents globally and operates in more than 200 countries.

About 90% of agents are outside of the US. Western Union operates two business segments, Consumer-to-Consumer (C2C) and Other (bill payments in the US and Argentina).

Western Union reported mixed Q4 2024 results on February 4th, 2025. Revenue increased 1% and diluted GAAP earnings per share increased to $1.14 in the quarter, compared to $0.35 in the prior year on higher revenue and a $0.75 tax benefit on reorganizing the international operations.

Revenue rose, despite challenges in Iraq on higher Banded Digital transactions and Consumer Services volumes.

CMT revenue fell 4% year-over-year even with 3% higher transaction volumes. Branded Digital Money Transfer CMT revenues increased 7% as transactions rose 13%. Digital revenue is now 25% of total CMT revenue and 32% of transactions.

Consumer Services revenue rose 56% on new products and expansion of retail foreign exchange offerings. The firm launched a media network business, expanded retail foreign exchange, and grew retail money orders.

Click here to download our most recent Sure Analysis report on WU (preview of page 1 of 3 shown below):

The High Dividend 50 Series

The High Dividend 50 Series is analysis on the 50 highest-yielding Sure Analysis Research Database stocks, excluding royalty trusts, BDCs, REITs, and MLPs.

Click on a company’s name to view the high dividend 50 series article for that company. A link to the specific Sure Analysis Research Database report page for each security is included as well.

More High-Yield Investing Resources

How To Calculate Your Monthly Income Based On Dividend Yield

A common question for income investors is “how much money can I expect to receive per month from my investment?”

To find your monthly income, follow these steps:

  1. Find your investment’s dividend yield
    Note: Dividend yield can be calculated as dividends per share divided by share price
  2. Multiply it by the current value of your holding
    Note: If you haven’t yet invested, multiply dividend yield by the amount you plan to invest
  3. Divide this number by 12 to find monthly income

To find the monthly income from your entire portfolio, repeat the above calculation for each of your holdings and add them together.

You can also use this formula backwards to find the dividend yield you need from your investments to make a certain amount of monthly dividend income.

The example below assumes you want to know what dividend yield you need on a $240,000 investment to generate $1,000/month in dividend income.

  1. Multiply $1,000 by 12 to find annual income target of $12,000
  2. Divide $12,000 by your investment amount of $240,000 to find your target yield of 5.0%

In practice most dividend stocks pay dividends quarterly, so you would actually receive 3x the monthly amount quarterly instead of receiving a payment every month. However, some stocks do actually pay monthly dividends.

You can see our monthly dividend stocks list here.

The Risks Of High-Yield Investing

Investing in high-yield stocks is a great way to generate income. But it is not without risks.

First, stock prices fluctuate. Investors need to understand their risk tolerance before investing in high dividend stocks. Share price fluctuations means that your investment can (and almost certainly will) decline in value, at least temporarily (and possibly permanently) do to market volatility.

Second, businesses grow and decline. Investing in a stock gives you fractional ownership in the underlying business. Some businesses grow over time. These businesses are likely to pay higher dividends over time.

The Dividend Champions are an excellent example of this; each has paid rising dividends for 25+ consecutive years.

What’s dangerous is when a business declines. Dividends are paid out of a company’s cash flows. If the business sees its cash flows decline, or worse is losing money, it may reduce or eliminate its dividend.

Business decline is a real risk with high yield investing. Business declines often coincide with and or accelerate during recessions.

A company’s payout ratio gives a good gauge of how much ‘room’ a company has to pay its dividend. The payout ratio is calculated as dividends divided by income.

The lower the payout ratio, the better, because dividends have more earnings coverage.

A company with a payout ratio over 100% is paying out more in dividends than it is making in profits, a long-term unsustainable situation.

For example, a company with a payout ratio of 50% is making double in income what it is paying out in dividends, so it has ‘room’ for earnings to decline significantly without reducing its dividend.

Third, management teams can change their dividend policies. Even if a company isn’t declining, the company’s management team may change priorities and reduce or eliminate its dividend.

In practice, this typically occurs if a company has a high level of debt and wants to focus on debt reduction. But it could in theory happen to any dividend paying stock.

The risks of high yield investing can be reduced (but not eliminated) by investing in higher quality businesses in a diversified portfolio of 20 or more stocks.

This reduces both business decline risk (by investing in high quality businesses) and the shock to your portfolio if any one stock does reduce or eliminate its dividend (through diversification).

Other High Dividend Research

The free spreadsheet of 5%+ dividend yield stocks in this article gives you more than 140 high yield income securities to review. You can download it below:


Investors should continue to monitor each stock to make sure their fundamentals and growth remain on track, particularly among stocks with extremely high dividend yields.

See the resources below to generate additional compelling investment ideas for dividend growth stocks and/or high-yield investment securities.

Thanks for reading this article. Please send any feedback, corrections, or questions to [email protected].


Source link

Top 20 Highest Yielding Monthly Dividend Stocks Now


Updated on March 5th, 2025 by Bob Ciura

Monthly dividend stocks have instant appeal for many income investors. Stocks that pay their dividends each month offer more frequent payouts than traditional quarterly or semi-annual dividend payers.

For this reason, we created a full list of ~80 monthly dividend stocks.

You can download our full Excel spreadsheet of all monthly dividend stocks (along with metrics that matter like dividend yield and payout ratio) by clicking on the link below:


In addition, stocks that have high dividend yields are also attractive for income investors.

With the average S&P 500 yield hovering around 1.3%, investors can generate much more income with high-yield stocks. Screening for monthly dividend stocks that also have high dividend yields makes for an appealing combination.

This article will list the 20 highest-yielding monthly dividend stocks.

Table Of Contents

The following 20 monthly dividend stocks have high dividend yields above 5%. Stocks are listed by their dividend yields, from lowest to highest.

The list excludes oil and gas royalty trust, which have extreme fluctuations in their dividend payouts from one quarter to the next due to the underlying volatility of commodity prices.

The list also only includes U.S.-based companies.

You can instantly jump to an individual section of the article by utilizing the links below:

High-Yield Monthly Dividend Stock #20: LTC Properties (LTC)

LTC Properties is a REIT that invests in senior housing and skilled nursing properties. Its portfolio consists of approximately 50% senior housing and 50% skilled nursing properties.

The REIT owns 194 investments in 26 states, with 31 operating partners.

Source: Investor Presentation

In late February, LTC reported (2/24/25) financial results for the fourth quarter of fiscal 2024. Funds from operations (FFO) per share dipped -8% over the prior year’s quarter, from $0.72 to $0.66, and missed the analysts’ consensus by $0.01.

The decrease in FFO per share resulted primarily from impairment losses. LTC improved its leverage ratio (Net Debt to EBITDA) from 4.7x to 4.3x thanks to various asset sales.

Click here to download our most recent Sure Analysis report on LTC (preview of page 1 of 3 shown below):


High-Yield Monthly Dividend Stock #19: EPR Properties (EPR)

EPR Properties is a specialty real estate investment trust, or REIT, that invests in properties in specific market segments that require industry knowledge to operate effectively.

It selects properties it believes have strong return potential in Entertainment, Recreation, and Education. The portfolio includes about $7 billion in investments across 340+ locations in 44 states, including over 200 tenants.

Source: Investor Presentation

EPR posted fourth quarter and full-year earnings on February 26th, 2025, and results were better than expected on both the top and bottom lines.

Funds-from-operations came to $1.23, which was a penny ahead of estimates. Revenue was up 3% to $177 million, beating estimates by $16 million.

Adjusted FFO per-share was down from $1.29 in Q3, but higher from $1.16 in the year-ago period. Revenue was also down from Q3, but higher from the year-ago period.

Property operating expenses were $15.2 million, higher from $14.6 million in Q3, and $14.8 million a year ago. Adjusted EBITDAre of $136 million was lower from $143 million in Q3, but higher from $129 million last year.

Click here to download our most recent Sure Analysis report on EPR (preview of page 1 of 3 shown below):


High-Yield Monthly Dividend Stock #19: Apple Hospitality REIT (APLE)

Apple Hospitality REIT is a hotel REIT that owns a portfolio of hotels with tens of thousands of rooms located across dozens of states.

It franchises its properties out to leading brands, including Marriottbranded hotels, Hilton-branded hotels, and Hyatt-branded hotels.

Source: Investor Presentation

Since it first began reporting FFO/share in its annual reports (2011), Apple initially generated very impressive annualized FFO/share growth thanks to its growing scale (due in large part to a merger in 2015), effective and efficient business model, and strong economic tailwinds in the United States during that period.

Typically, during a recessionary period, hotel REITs experience significant losses of income. Therefore, Apple is likely not very recession resistant.

However, its concentration in strong brand names, excellent locations, strong balance sheet, franchising model, and emphasis on value should enable it to outperform its peers in a recession.

Click here to download our most recent Sure Analysis report on APLE (preview of page 1 of 3 shown below):

High-Yield Monthly Dividend Stock #18: Gladstone Capital (GLAD)

Gladstone Capital is a business development company, or BDC, that primarily invests in small and medium businesses. These investments are made via a variety of equity (10% of portfolio) and debt instruments (90% of portfolio), generally with very high yields.

Loan size is typically in the $7 million to $30 million range and has terms up to seven years.

Gladstone posted first quarter earnings on February 12th, 2025, and results were weaker than expected. Earnings-per-share came to 50 cents, well short of the estimate for 65 cents.

Total investment income, which is akin to revenue, was down $1.8 million, or 7.4%, year-over-year. Compared to the September quarter, total investment income fell by $2.1 million.

The net increase in net assets resulting from operations was $27 million, or $1.21 per share. This was lower than the $31.8 million, or $1.46 per share, gain in the September quarter.

Gladstone noted $152 million in new fundings for the quarter, including six new portfolio companies. Exits and prepayments were $165 million, so net new funding was -$13 million. Total debt investments rose by $45 million during the quarter.

Click here to download our most recent Sure Analysis report on GLAD (preview of page 1 of 3 shown below):

High-Yield Monthly Dividend Stock #17: Gladstone Investment Corporation (GAIN)

Gladstone Investment is a business development company (BDC) that focuses on US-based small- and medium-sized companies.

Industries which Gladstone Investment targets include aerospace & defense, oil & gas, machinery, electronics, and media & communications.

Gladstone Investment reported its third quarter (Q3 2024 ended December 31) earnings results on February 13. The company generated total investment income – Gladstone Investment’s revenue equivalent – of $21.4 million during the quarter, which represents a decline of 7% compared to the prior year’s quarter.

This was a weaker performance compared to the previous quarter, when the growth rate was positive.

Gladstone Investment’s adjusted net investment income-per-share totaled $0.23 during the fiscal third quarter. That was up slightly from the previous quarter’s level.

Gladstone Investment‘s net asset value per share totaled $13.30 on a per-share basis at the end of the quarter.

Click here to download our most recent Sure Analysis report on GAIN (preview of page 1 of 3 shown below):

High-Yield Monthly Dividend Stock #16: Gladstone Commercial (GOOD)

Gladstone Commercial Corporation is a real estate investment trust, or REIT, that specializes in single-tenant and anchored multi-tenant net leased industrial and office properties across the U.S.

The trust targets primary and secondary markets that possess favorable economic growth trends, growing populations, strong employment, and robust growth trends.

The trust’s stated goal is to pay shareholders monthly distributions, which it has done for more than 17 consecutive years. Gladstone owns over 100 properties in 24 states that are leased to about 100 unique tenants.

Gladstone posted fourth quarter and full-year earnings on February 18th, 2025, and results were somewhat weak. Funds-from-operations per share came to 35 cents, which met expectations. Revenue was $37.4 million, which missed estimates by $0.66 million. The slight move up in revenue was driven by higher straight-line rents.

Same-store rents were up 5% year-over-year, which was supported by increased straight-line rent rates and recovery revenue. Operating expenses were down to $25 million from $28.1 million a year ago, partially due to reduced impairment charges.

Click here to download our most recent Sure Analysis report on GOOD (preview of page 1 of 3 shown below):

High-Yield Monthly Dividend Stock #15: Modiv Industrial (MDV)

Modiv Industrial acquires, owns, and actively manages single-tenant net-lease industrial, retail, and office properties in the United States, focusing on strategically essential and mission-critical properties with predominantly investment-grade tenants.

As of its most recent filings, the company’s portfolio comprised 43 properties that occupied 4.5 million square feet of aggregate leasable area.

On March 4th, 2025, Modiv reported its Q4 and full-year results for the period ending December 31st, 2024. For the quarter, rental income came in at $11.7 million, down 4.8% year-over-year.

This was mainly due to the elimination of some non-NNN tenant reimbursements related to the August 2023 portfolio disposition of 13 properties.

Management fee income also fell from $99 thousand to $66 thousand. Thus, total income was $11.7 million, down 5.3% from $12.4 million last year.

AFFO was $4.1 million, or $0.37 per diluted share, down from AFFO of $4.5 million, or $0.40 per diluted share last year.

For the year, AFFO per share was $1.34. For FY2025, we expect AFFO per share of $1.38 based on the company’s current leasing profile.

Click here to download our most recent Sure Analysis report on MDV (preview of page 1 of 3 shown below):

High-Yield Monthly Dividend Stock #14: Itau Unibanco (ITUB)

Itaú Unibanco Holding S.A. is headquartered in Sao Paulo, Brazil. The bank has operations across South America and other places like the United States, Portugal, Switzerland, China, Japan, etc.

On November 5th, 2024, Itaú Unibanco reported third-quarter results for 2024. The company reported recurring managerial result for the third quarter of 2024 was approximately $2.1 billion USD, reflecting a 6.0% increase from the previous quarter.

The recurring managerial return on equity stood at 22.7% on a consolidated basis and 23.8% for operations in Brazil. Total assets grew by 2.6%, surpassing $590 billion USD, while the loan portfolio increased by 1.9% globally and 2.1% in Brazil for the quarter, with year-on-year growth rates of 9.9% and 10.0%, respectively.

Key drivers included personal, vehicle, and mortgage loans, which saw quarterly growth rates of 3.1%, 3.0%, and 3.9%, respectively.

Click here to download our most recent Sure Analysis report on ITUB (preview of page 1 of 3 shown below):

High-Yield Monthly Dividend Stock #13: Fortitude Gold (FTCO)

Fortitude Gold is a junior gold producer with operations in Nevada, U.S.A, one of the world’s premier mining friendly jurisdictions. The company targets high-grade gold open pit heap leach operations averaging one gram per tonne of gold or greater.

Its property portfolio currently consists of 100% ownership in six high-grade gold properties. All six properties are within an approximate 30-mile radius of one another within the prolific Walker Lane Mineral Belt.

Source: Investor Presentation

On November 5th, 2024, Fortitude Gold released its Q3 results for the period ending September 30st, 2024. For the quarter, revenues came in at $10.2 million, 52% lower compared to last year.

The decline in revenues was primarily due to a 62% drop in gold sales volume and a 54% decrease in silver sales volume. However, these reductions were partially offset by a 26% increase in gold prices and a 23% rise in silver prices.

Click here to download our most recent Sure Analysis report on FTCO (preview of page 1 of 3 shown below):

High-Yield Monthly Dividend Stock #11: Stellus Capital (SCM)

Stellus Capital Management provides capital solutions to companies with $5 million to $50 million of EBITDA and does so with a variety of instruments, the majority of which are debt.

Stellus provides first lien, second lien, mezzanine, convertible debt, and equity investments to a diverse group of customers, generally at high yields, in the US and Canada.

Source: Investor Presentation

Stellus posted third quarter earnings on November 7th, 2024, and results were quite weak on both the top and bottom lines. Net investment income, which is similar to earnings-per-share, came to 40 cents.

This was four cents light of estimates, or about 9%. Total investment income was $26.5 million, down 2.5% year-over-year, and missing estimates by $1.34 million.

Gross operating expenses were $16.2 million, which was essentially flat year-over-year. Base management fees totaled $3.9 million for this year’s Q3 and the same period a year ago.

Click here to download our most recent Sure Analysis report on Stellus (preview of page 1 of 3 shown below):

High-Yield Monthly Dividend Stock #10: Ellington Financial (EFC)

Ellington Financial Inc. acquires and manages mortgage, consumer, corporate, and other related financial assets in the United States.

The company acquires and manages residential mortgage–backed securities (RMBS) backed by prime jumbo, Alt–A, manufactured housing, and subprime residential mortgage loans.

Source: Investor Presentation

Additionally, it manages RMBS, for which the U.S. government guarantees the principal and interest payments. It also provides collateralized loan obligations, mortgage–related and non–mortgage–related derivatives, equity investments in mortgage originators and other strategic investments.

On November 6th, 2024, Ellington Financial reported its Q3 results for the period ending September 30th, 2024. Adjusted (previously referred to as “core”) EPS came in at $0.40, seven cents higher versus Q2-2024.

The rise was driven in part by a sizeable contribution from Ellington’s proprietary reverse mortgage strategy, offset by a higher share count. Ellington’s book value per share fell from $13.92 to $13.66 during the last three months.

Click here to download our most recent Sure Analysis report on Ellington Financial (EFC) (preview of page 1 of 3 shown below):

High-Yield Monthly Dividend Stock #9: PennantPark Floating Rate Capital (PFLT)

PennantPark Floating Rate Capital Ltd. is a business development company that seeks to make secondary direct, debt, equity, and loan investments.

The fund also aims to invest through floating rate loans in private or thinly traded or small market-cap, public middle market companies, equity securities, preferred stock, common stock, warrants or options received in connection with debt investments or through direct investments.

On November 26, 2024, PennantPark Floating Rate Capital reported strong results for the fourth fiscal quarter of 2024, with core net investment income of $0.32 per share. The portfolio grew 20% quarter-over-quarter, reaching $2 billion as the firm deployed $446 million across 10 new and 50 existing companies.

Investments carried an average yield of 11%, reflecting the continued strength of the middle market lending environment. After the quarter, PFLT remained active, investing an additional $330 million at a yield of 10.2%.

Click here to download our most recent Sure Analysis report on PFLT (preview of page 1 of 3 shown below):

High-Yield Monthly Dividend Stock #8: Prospect Capital (PSEC)

Prospect Capital Corporation is a Business Development Company, or BDC, that provides private debt and private equity to middlemarket companies in the U.S.

The company focuses on direct lending to owneroperated companies, as well as sponsorbacked transactions. Prospect invests primarily in first and second lien senior loans and mezzanine debt, with occasional equity investments. 

Source: Investor Presentation

Prospect posted first quarter earnings on November 8th, 2024, and results were weak. However, the big news was a 25% dividend cut. Prospect reduced its payout to 54 cents per share annually, sending the stock reeling.

Net investment income was 21 cents per share in Q1, and revenue was $196 million. That was down 17% year-over-year.

The company is in the midst of rotating its strategy to emphasize first lien senior secured lending instead of real estate investments and collateralized loan obligations, or CLOs.

Click here to download our most recent Sure Analysis report on PSEC (preview of page 1 of 3 shown below):

High-Yield Monthly Dividend Stock #7: Horizon Technology (HRZN)

Horizon Technology Finance Corp. is a BDC that provides venture capital to small and mediumsized companies in the technology, life sciences, and healthcareIT sectors.

The company has generated attractive riskadjusted returns through directly originated senior secured loans and additional capital appreciation through warrants.

Source: Investor Presentation

On October 29th, 2024, Horizon released its Q3 results for the period ending September 30th, 2024. For the quarter, total investment income fell 15.5% year-over-year to $24.6.7 million, primarily due to lower interest income on investments from the debt investment portfolio.

More specifically, the company’s dollar-weighted annualized yield on average debt investments in Q3 of 2024 and Q3 of 2023 was 15.9% and 17.1%, respectively.

Net investment income per share (IIS) fell to $0.32, down from $0.53 compared to Q3-2023. Net asset value (NAV) per share landed at $9.06, down from $9.12 sequentially.

After paying its monthly distributions, Horizon’s undistributed spillover income as of June 30th, 2024 was $1.27 per share, indicating a considerable cash cushion.

Click here to download our most recent Sure Analysis report on HRZN (preview of page 1 of 3 shown below):

High-Yield Monthly Dividend Stock #6: AGNC Investment Corporation (AGNC)

American Capital Agency Corp is a mortgage real estate investment trust that invests primarily in agency mortgagebacked securities (or MBS) on a leveraged basis.

The firm’s asset portfolio is comprised of residential mortgage passthrough securities, collateralized mortgage obligations (or CMO), and nonagency MBS. Many of these are guaranteed by governmentsponsored enterprises.

Source: Investor Presentation

AGNC Investment Corp. reported strong financial results for the third quarter ended September 30, 2024. The company achieved a comprehensive income of $0.63 per common share, driven by a net income of $0.39 and other comprehensive income of $0.24 from marked-to-market investments.

Net spread and dollar roll income contributed $0.43 per share. The tangible net book value increased by $0.42 per share to $8.82, reflecting a 5.0% growth from the previous quarter.

AGNC declared dividends of $0.36 per share, resulting in a 9.3% economic return on tangible common equity, which includes both dividends and the increase in net book value.

Click here to download our most recent Sure Analysis report on AGNC Investment Corp (AGNC) (preview of page 1 of 3 shown below):

High-Yield Monthly Dividend Stock #5: Dynex Capital (DX)

Dynex Capital invests in mortgagebacked securities (MBS) on a leveraged basis in the United States. It invests in agency and nonagency MBS consisting of residential MBS, commercial MBS (CMBS), and CMBS interestonly securities.

Source: Investor Presentation

Dynex Capital released its fourth-quarter 2024 financial results, with book value ending the quarter at $12.70 per share and an economic return of 7.4% for the year.

Leverage increased slightly to 7.9x as the company deployed capital into higher-yielding agency RMBS, particularly 30-year 4.5%, 5%, and 5.5% coupons.

The shift from treasury futures to interest rate swaps was a key strategy, enhancing portfolio returns by 200 to 300 basis points and improving net interest spread.

Click here to download our most recent Sure Analysis report on DX (preview of page 1 of 3 shown below):

High-Yield Monthly Dividend Stock #4: Oxford Square Capital (OXSQ)

Oxford Square Capital Corp. is a BDC specializing in financing early and middlestage businesses through loans and CLOs.

The company holds an equally split portfolio of FirstLien, SecondLien, and CLO equity assets spread across multiple industries, with the highest exposure in software and business services.

Source: Investor Presentation

On November 5th, 2024, Oxford Square reported its Q3 results for the period ending September 30th, 2024. For the quarter, the company generated about $10.3 million of total investment income, down from $11.4 million in the previous quarter.

This was due to lower interest income from its debt investments and lower income from its securitization vehicles.

Further, the weighted average yield of the company’s debt investments was 13.7% at current cost, down from 13.9% in the previous quarter.

Still, the weighted average cash distribution yield of the company’s cash income producing CLO equity investments at current rose notably from 13.7% to 14.5%.

Click here to download our most recent Sure Analysis report on OXSQ (preview of page 1 of 3 shown below):

High-Yield Monthly Dividend Stock #3: Ellington Credit Co. (EARN)

Ellington Credit Co. acquires, invests in, and manages residential mortgage and real estate related assets. Ellington focuses primarily on residential mortgage-backed securities, specifically those backed by a U.S. Government agency or U.S. governmentsponsored enterprise.

Agency MBS are created and backed by government agencies or enterprises, while non-agency MBS are not guaranteed by the government.

Source: Investor Presentation

On November 12th, 2024, Ellington Residential reported its third quarter results for the period ending September 30th, 2024. The company generated net income of $5.4 million, or $0.21 per share.

Ellington achieved adjusted distributable earnings of $7.2 million in the quarter, leading to adjusted earnings of $0.28 per share, which covered the dividend paid in the period.

Net interest margin was 5.22% overall. At quarter end, Ellington had $25.7 million of cash and cash equivalents, and $96 million of other unencumbered assets.

Click here to download our most recent Sure Analysis report on EARN (preview of page 1 of 3 shown below):

High-Yield Monthly Dividend Stock #2: ARMOUR Residential REIT (ARR)

ARMOUR Residential invests in residential mortgage-backed securities that include U.S. Government-sponsored entities (GSE) such as Fannie Mae and Freddie Mac.

It also includes Ginnie Mae, the Government National Mortgage Administration’s issued or guaranteed securities backed by fixed-rate, hybrid adjustable-rate, and adjustable-rate home loans.

Unsecured notes and bonds issued by the GSE and the US Treasury, money market instruments, and non-GSE or government agency-backed securities are examples of other types of investments.

Source: Investor presentation

On October 23, 2024, ARMOUR Residential REIT announced its unaudited third-quarter 2024 financial results, reporting a GAAP net income available to common stockholders of $62.9 million, or $1.21 per common share. The company generated a net interest income of $1.8 million and distributable earnings of $52.0 million, equivalent to $1.00 per common share.

ARMOUR achieved an average interest income of 4.89% on interest-earning assets and an interest cost of 5.51% on average interest-bearing liabilities. The economic net interest spread stood at 2.00%, calculated from an economic interest income of 4.44% minus an economic interest expense of 2.44%.

During the quarter, ARMOUR raised $129.4 million by issuing 6,413,735 shares of common stock through an at-the-market offering program and paid common stock dividends of $0.72 per share for Q3.

Click here to download our most recent Sure Analysis report on ARMOUR Residential REIT Inc (ARR) (preview of page 1 of 3 shown below):


High-Yield Monthly Dividend Stock #1: Orchid Island Capital (ORC)

Orchid Island Capital is a mortgage REIT that is externally managed by Bimini Advisors LLC and focuses on investing in residential mortgage-backed securities (RMBS), including pass-through and structured agency RMBSs.

These financial instruments generate cash flow based on residential loans such as mortgages, subprime, and home-equity loans.

Source: Investor Presentation

The company reported a net income of $17.3 million, or $0.24 per common share, significantly improving from a net loss of $80.1 million in the same quarter last year. This net income comprised $0.3 million in net interest income and $4.3 million in total expenses.

Additionally, Orchid recorded net realized and unrealized gains of $21.2 million, or $0.29 per common share, from Residential Mortgage-Backed Securities (RMBS) and derivative instruments, including interest rate swaps.

Click here to download our most recent Sure Analysis report on Orchid Island Capital, Inc. (ORC) (preview of page 1 of 3 shown below):

Final Thoughts

Monthly dividend stocks could be more appealing to income investors than quarterly or semi-annual dividend stocks. This is because monthly dividend stocks make 12 dividend payments per year, instead of the usual 4 or 2.

Furthermore, monthly dividend stocks with high yields above 5% are even more attractive for income investors.

The 20 stocks on this list have not been vetted for dividend safety, meaning each investor should understand the unique risk factors of each company.

That said, these 20 dividend stocks make monthly payments to shareholders, and all have high dividend yields.

Further Reading

If you are interested in finding high-quality dividend growth stocks and/or other high-yield securities and income securities, the following Sure Dividend resources will be useful:

Monthly Dividend Stock Individual Security Research

Other Sure Dividend Resources

Thanks for reading this article. Please send any feedback, corrections, or questions to [email protected].


Source link

Dividend Aristocrats In Focus: Archer Daniels Midland


Updated on March 3rd, 2025 by Felix Martinez

At Sure Dividend, we believe that the best stocks to buy and hold to generate long-term wealth have several qualities in common. First, they are strong businesses that lead their respective industries, with the ability to generate consistent profits year after year—even during recessions.

Not only that, they also have shareholder-friendly management teams that are dedicated to raising their dividends each year. We advocate investing in the Dividend Aristocrats, a group of 69 companies in the S&P 500 Index, with at least 25 consecutive years of dividend increases.

You can download the full list of all 69 Dividend Aristocrats, along with several important financial metrics such as price-to-earnings ratios and dividend yields, by clicking on the link below:

Disclaimer: Sure Dividend is not affiliated with S&P Global in any way. S&P Global owns and maintains The Dividend Aristocrats Index. The information in this article and downloadable spreadsheet is based on Sure Dividend’s own review, summary, and analysis of the S&P 500 Dividend Aristocrats ETF (NOBL) and other sources, and is meant to help individual investors better understand this ETF and the index upon which it is based. None of the information in this article or spreadsheet is official data from S&P Global. Consult S&P Global for official information.

Each year, we review all the Dividend Aristocrats. Next up is Archer Daniels Midland (ADM).

Archer Daniels Midland has increased its dividend each year for 52 years in a row and has paid uninterrupted quarterly dividends to shareholders for 90 years. The company’s dividend is also relatively safe thanks to sound business fundamentals.

Business Overview

Archer Daniels Midland was founded in 1902 when George A. Archer and John W. Daniels began a linseed-crushing business. In 1923, Archer-Daniels Linseed Company acquired Midland Linseed Products Company, which created Archer Daniels Midland.

Today, it is an agricultural industry giant with annual revenue above $86 billion. The company produces a wide range of products and services designed to meet the growing demand for food due to rising populations.

Archer-Daniels-Midland’s businesses include processing cereal grains, oilseeds, and agricultural storage and transportation. The Ag Services and Oilseeds segment is Archer Daniels Midland’s largest.

Source: Investor Presentation

Archer-Daniels-Midland reported its fourth-quarter Fiscal Year (FY) 2024 results on February 4th, 2025. The company reported full-year earnings per share (EPS) of $3.65 and adjusted EPS of $4.74, both lower than the previous year. Net earnings totaled $1.8 billion, while adjusted net earnings reached $2.3 billion. The company generated $2.8 billion in cash flow from operations. In response to market challenges, ADM announced cost-saving initiatives targeting $500–$750 million and increased its quarterly dividend by 2%.

Fourth-quarter earnings before income taxes were $667 million, down 9% year-over-year. GAAP EPS increased 10% to $1.17, while adjusted EPS declined 16% to $1.14. Full-year earnings before taxes fell 47% to $2.3 billion, and total segment operating profit dropped 28% to $4.2 billion. The Ag Services & Oilseeds segment saw a 40% decline in operating profit due to lower crush margins and biofuel policy uncertainties, while Carbohydrate Solutions remained stable. The Nutrition segment fell 10%, with Human Nutrition down 22%.

ADM expects 2025 adjusted EPS between $4.00 and $4.75, reflecting continued market pressures. The company prioritizes operational improvements, portfolio simplification, and strategic capital allocation to drive long-term growth.

Growth Prospects

ADM faced growth challenges in 2024 due to tough comparisons following a strong prior period. Performance varied across its segments.

The Ag Services & Oilseeds segment saw a 40% drop in operating profit for the full year, driven by lower crush margins and biofuel policy uncertainties.

Carbohydrate Solutions remained stable, showing resilience despite market pressures.

The Nutrition segment declined 10% for the full year, with Human Nutrition down 22%, reflecting weaker demand.

Over time, ADM has reshaped its portfolio with acquisitions, joint ventures, and strategic divestitures.

Source: Investor Presentation

For example, the acquisition of Ziegler Group and the establishment of a nutrition flavor research and customer center are expected to improve growth prospects.

This positive outlook leads us to anticipate a feasible growth rate of approximately 3.0% for the next five years.

Competitive Advantages & Recession Performance

Archer Daniels Midland has built significant competitive advantages over the years. It is the largest processor of corn in the world, which leads to economies of scale and efficiencies in production and distribution.

It is an industry giant with ~440 crop procurement locations, ~300 food and feed processing facilities, and 64 innovation centers.

At its innovation centers, the company conducts research and development to respond more effectively to changes in customer demand and improve processing efficiency. Archer Daniels Midland’s unparalleled global transportation network serves as a huge competitive advantage.

The company’s global distribution system provides high margins and barriers to entry, allowing Archer Daniels Midland to remain highly profitable even during industry downturns.

Profits held up, even during the Great Recession. Earnings-per-share during the Great Recession are below:

  • 2007 earnings-per-share of $2.38
  • 2008 earnings-per-share of $2.84 (19% increase)
  • 2009 earnings-per-share of $3.06 (7.7% increase)
  • 2010 earnings-per-share of $3.06

Archer Daniels Midland’s earnings-per-share increased in 2008 and 2009, during the Great Recession. Very few companies can boast such a performance in one of the worst economic downturns in U.S. history.

Archer Daniels Midland’s remarkable durability in recessions could be due to the fact that grains still need to be processed and transported, regardless of the economic climate.

There will always be a certain level of demand for Archer Daniels Midland’s products. From a dividend perspective, the payout looks quite safe.

Valuation & Expected Returns

Based on the expected 2025 EPS of $4.21, ADM shares trade for a price-to-earnings ratio of 11.2. ArcherDanielsMidland has been valued at a price-to-earnings multiple of ~15 over the last decade.

Our fair value P/E is 14, meaning the stock is undervalued.

An increasing valuation multiple could generate 6% annual returns for shareholders over the next five years. Future returns will also be derived from earnings growth and dividends.

We expect Archer Daniels Midland to grow its future earnings by ~3% per year through 2030, and the stock has a current dividend yield of 4.3%.

In this case, total expected returns are 13.3% per year over the next five years, a solid risk-adjusted rate of return for Archer Daniels Midland stock.

Final Thoughts

Archer Daniels Midland is coming off a few years of strong earnings growth. While earnings are expected to decline in 2024, we see the potential for a return to long-term growth.

The company has a long history of navigating challenging periods. It has continued to generate profits and reward shareholders with rising dividends.

The stock appears to be undervalued, and has a 4.3% dividend yield, plus annual dividend increases. As a result, Archer Daniels Midland seems to be a buy for dividend growth investors.

If you are interested in finding more high-quality dividend growth stocks suitable for long-term investment, the following Sure Dividend databases will be useful:

The major domestic stock market indices are another solid resource for finding investment ideas. Sure Dividend compiles the following stock market databases and updates them monthly:

Thanks for reading this article. Please send any feedback, corrections, or questions to [email protected].


Source link

Copyright © 2023 | Powered by WordPress | Coin Market Theme by A WP Life