Written by Steven Dooley, Head of Market Insights, and Shier Lee Lim, Lead FX and Macro Strategist
USD index hits three-year lows
The US dollar, as measured by the USD index, broke below key three-year lows overnight as this week’s lower US inflation reading and last night’s rising unemployment claims caused markets to speculate the US Federal Reserve might be more willing to cut interest rates.
Importantly, the Fed’s likely moves to cut rates stand in contrast to the European Central Bank, which might pause rate cuts after a rapid move lower in official rates from 4.50% in April 2024 to 2.15% now. The EUR/USD surged to four-year highs.
The euro’s gains saw the US dollar weaker in other markets. The NZD/USD hit seven-month highs while USD/SGD fell to new 11-year lows.
Aussie back at highs on inflation expectations
The Aussie benefited from the greenback’s weakness with the AUD/USD closing at the highest level since November.
The Aussie was helped by a jump in inflation expectations. Consumer inflation expectations in Australia jumped from 4.1% in May to 5% in June, according to the Melbourne Institute—the highest level since July 2023.
The rising inflation expectations differ from the March-quarter headline CPI, released in April, which came in at 2.4% year-over-year, aligning with the Reserve Bank of Australia’s target midpoint.
Markets are currently pricing in a 25bps rate cut at the RBA’s July meeting.
Looking lower, the next key support level for the pair sits at the 21-day EMA of 0.6469, followed by 200-day EMA of 0.6423.
Japanese yen gains on USD weakness
Before reinstating higher tariffs on multiple economies, due on 9 July, US President Donald Trump announced he will send letters to trading partners in the next week or two, setting unilateral duty rates.
The news pressured the US dollar, causing it to trade softer.
Bloomberg noted that Trump often sets two-week deadlines that shift or go unmet, leaving uncertainty around whether he will follow through on this plan.
While Trump said he’s open to extending the deadline to allow more time for negotiations, he doesn’t see the need for it.
In APAC FX, the Japanese yen is gaining as investors seek safe-haven assets amid trade uncertainty and rising geopolitical tensions.
The Japanese yen hit fresh weekly highs overnight, with the 50-day EMA acting as key resistance, followed by the 200-day EMA at 148.70.
The yen’s climbed from one-month lows versus both the Australian and Singapore dollars.
USD breaks support
Table: seven-day rolling currency trends and trading ranges
*The FX rates published are provided by Convera’s Market Insights team for research purposes only. The rates have a unique source and may not align to any live exchange rates quoted on other sites. They are not an indication of actual buy/sell rates, or a financial offer.
The U.S. dollar slid to its lowest level since March 2022 on Thursday, putting the benchmark dollar index on track to post its worst first half since that year.
The dollar’s steep decline has led some market watchers to speculate that the greenback is losing its role as the global reserve currency and backbone of global finance.
However, analysts see evidence that dollar demand remains strong, and argue true global “de-dollarization” would require an unlikely shrinking of government or private balance sheets.
The U.S. dollar slumped to its lowest level since 2022 on Thursday, putting the greenback on track to have its worst start to a year in decades.
The U.S. dollar index (DXY) slid as low as 98.6 Thursday morning, its lowest reading since March 2022, and more than 9% below where it started the year. The index has only shed more than 9% of its value during the first half of the year two other times since 1985, and thelast was in 2002.
The dollar has slumped this year as investors have questioned both the U.S. economy’s outlook and America’s role within the global financial system. President Donald Trump’s unpredictable tariff policies and apparent desire to abdicate U.S. leadership of the post-war global economic order has sparked what Wall Street has dubbed the “Sell America” trade.
Evidence of a global distaste for U.S. assets has shown up in the stock, bond, and foreign exchange markets. U.S. stocks severely underperformed equities in most developed markets in the first months of Trump’s second term as trade policy threatened to slow U.S. growth.
Treasurys and the dollar both tumbled in the days after Trump unveiled his “Liberation Day” tariffs, “a very unusual pattern,” former Treasury Secretary Janet Yellen said at the time. The dynamic, Yellen said, suggested international investors were shunning dollar-based assets and questioning Treasury debt’s role as the bedrock of global finance. Others speculated that China was dumping its Treasurys in retaliation for Trump’s tariffs.
BofA Says World Actually ‘Dollarizing Rapidly’
The dollar’s bad start to the year has prompted some to wonder if the world is “de-dollarizing,” a concern that Bank of America analysts in a note on Wednesday said “miss[ed] the dollar forest for the dollar trees.” On the contrary, they say, “the world is dollarizing rapidly,” as evidenced by the growth of nonbank financial intermediaries (NBFIs), including investment banks, mortgage lenders, insurance companies, and private equity firms.
NBFI-controlled assets more than doubled between 2009 ($28 trillion) and 2022 ($63 trillion), according to BofA. “We see this rapid growth as reflecting strong demand for dollars,” the analysts wrote. “Part of this demand likely derives from the increased value of other dollar assets like equities and housing.” The U.S. equity market has ballooned to $60 trillion today from $11 trillion in 2008, the BofA report said, while the housing stock has nearly doubled in the last decade to $50 trillion.
True de-dollarization, according to BofA, would be difficult to accomplish. It would require the federal government to tax more than it spends—the opposite of what congressional Republicans are proposing in the tax bill being considered on Capitol Hill. Alternatively, de-dollarization could follow from bank, NBFI, and corporate balance sheets shrinking. But, if that were to happen, as in the aftermath of the 2008 financial crisis, we’d likely see the government increase its own spending, and thus the dollar supply, to stimulate the economy.
Stablecoins Could Boost Dollar Demand
The U.S. government’s embrace of cryptocurrencies could also be a long-term “dollarizing” force. The Senate on Wednesday voted to advance the GENIUS Act, putting the bill, which establishes a legal framework for stablecoins, one step closer to becoming law. The bill’s co-sponsor, Sen. Bill Hagerty (R-Tennessee), said on Wednesday the act would “cement the dollar’s status as the world’s reserve currency.”
BofA analysts agree that the mainstream adoption of Treasury-backed stablecoins, which they expect will eventually offer interest in some form, is likely to boost the demand for U.S. government debt and, thus, augment dollar demand. Wider stablecoin adoption, in turn, could allow the U.S. Treasury to lower its interest expenses by issuing more short-term Treasurys, which have lower coupon rates than long-term debt.
Editor’s Note: About 40 years ago, I created the quantitative system that many of you know today as Stock Grader. In fact, I’ve been called one of the first “quants” on Wall Street. Of course, the technology is better these days, so I’ve souped it up immensely since then. But the fact is it still does what I designed it to do way back when.
What I haven’t done, though, is design quant systems for other analysts. Stock Grader just works for my style of growth investing… and I’m in the business of helping folks like you use my style of investing to get rich.
But as you’ll read in the piece below, our corporate partners at TradeSmith have made it their business to help other analysts – and investors – utilize all kinds of powerful, thoroughly-tested strategies that suit their styles. In fact, as TradeSmith CEO Keith Kaplan will share, he and his team worked with master trader Jeff Clark to turn his proven, decades-old chart-reading discipline into a cutting-edge, easy-to-use scanner.
The end result? A system that can surface Jeff’s favorite “coiled spring” trade setups in seconds, not hours.
Jeff debuted his new system at yesterday’s Countdown to Chaos event. He also revealed 10 of his favorite trade setups pulled straight from this new tool. If you missed it, I strongly encourage you to watch the replay now.
Now today, TradeSmith CEO Keith Kaplan wants to take you behind the scenes a bit to show you how his team of engineers developed that software.
**************************
For decades, master trader Jeff Clark has turned chaos, crashes, and panics into big profits for his readers.
But when those readers ask him how, in 2008, he was able to recommend 42 winning short-term trades out of 52, for an average return of 31%…
Or in 2022, when he recommended 12 trades that made 100%+…
Or just a month ago, during the Liberation Day crash and rebound when Jeff went 19 for 25, with 15 double-digit winners and 3 triple-digit gains…
It’s hard for Jeff to pin down exactly how he does it.
Because for Jeff, making money when volatility strikes is just second nature… And, frankly, he’s a bit old-school.
Jeff is used to scanning charts one by one, in a weekly ritual where he filters down thousands of potential opportunities to just a few… purely with his eyes and a handful of trusty technical indicators.
That’s the kind of discipline that’s built by becoming a trader in the pre-internet days. And to this day, Jeff’s a pretty traditional, low-tech guy.
He calls his approach “more art than science.”
But when Jeff joined TradeSmith, and we showed him that we could actually automate this ritual into an easy-to-use scan…
And that we could easily share this scan with his readers, providing 10 high-odds opportunities every single day…
We realized we could turn his moneymaking art into a science.
Now with his help and our technical firepower, we’ve developed a system that spots a unique, powerful trading signal that Jeff’s been following for years.
For anyone who has been following along in TradeSmith Daily, you probably know that we recently released a presentation all about this strategy, and how it’s now available to subscribers of Jeff’s work.
You also might know that during that presentation, we shared 10 different setups that recently hit our scanners. All of them could present 100%+ profit opportunities in the coming weeks, if you act on them ASAP.
But while you’re here, I’d like to show you how we integrated Jeff’s monster signal into our software… and share a few of these “coiled spring” ideas for you to check out right now.
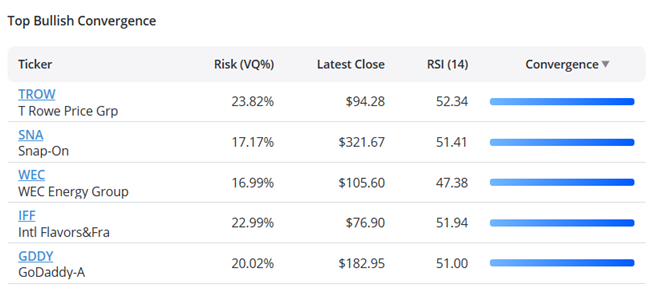
Three Stocks Showing Jeff’s Top Bullish Convergence Right Now
TradeSmith Finance users who subscribe to Jeff Clark got a new widget on their dashboard last week:
These are what we call Bullish Convergence setups. On these setups, three time-weighted moving averages are coiled together like a tightly compressed spring.
Imagine pushing a big spring together with your hands, with lots of pressure. Then, imagine the pressure becomes so great, the spring starts to bend upward…
And then goes flying into the sky.
It’s the same thing with these stocks. With the right pressure conditions, these stocks are primed to fly.
We went back to see what happens when these “coiled spring” setups occur. And what we found was remarkable.
When we backtested 10 years of data, Jeff’s signal produced winning trades 72% of the time.
As you may already know, Jeff does most of his trading in the options market. Seven winners for every three losers can make for an incredible options trading strategy. Because options leverage your returns, that level of consistency can make you some serious money.
Let’s look at some fresh examples to show what we’re looking for here.
Here’s a chart of T Rowe Price (TROW), which at this very moment has the highest coiled-spring energy of any stock we track:
You can see on the right-hand side of the chart the kind of setup I’m talking about. These three moving averages show that TROW is consolidating after a big move lower this year, and the stock itself making a higher low. This setup is a strong buy signal.
Here’s another example in Snap-On (SNA)…
Here again, we see the three time-weighted averages converging… and the stock forming a higher low.
And here’s one more example in GoDaddy (GDDY):
Again, we see that same signal and that same higher low on the chart.
With a win rate of 72% on this strategy, odds are very good that at least one of these stocks will be higher by the time the signal plays out.
But that’s not the only strategy we created…
When Coiled Springs Break the Other Way
We also found something unusual when we were testing these three time-weighted moving averages.
When the moving averages do the opposite of a coiled spring and diverge, you have a very strong trend at hand.
It’s like stretching a spring apart instead of pushing it together. The forces of physics want the spring to coil back.
When this happens in an overextended, uptrending stock, the results for the stock to retrace are quite consistent…
69% of the time we tested this signal, the stock was lower, with the exit signal hitting when the stock crosses back below the shortest-term moving average or 21 days later.
Here are the top Bearish Divergence signals from earlier this week…
Let’s zoom in on that first name, Intuit (INTU):
Intuit has been a huge winner this year, with the stock up from around $620 a share in January to $771 per share, at the time of this writing.
The time-weighted averages are all very far apart from each other – diverging strongly to the upside.
You might look at this and think this is a stock in a strong uptrend, and one you wouldn’t want to fade. But when the stock has shot up this fast, our data suggests you want to bet on a reversal.
Here’s another example in Seagate (STX):
STX has recovered nicely from the post-Liberation Day low, with the stock surging from $70 to nearly $127 in just 2 months.
But this system says the move is too much, too fast. More likely than not, STX will be lower in the next 21 days.
Remember, these are the kinds of setups that Jeff Clark would spend hours seeking out on his own, chart by chart.
And now, thanks to the power of TradeSmith’s software, he doesn’t have to… and not only that, but you can see the best of the best opportunities for yourself right in TradeSmith Finance.
Big disclaimer though.
If you’re going to follow these trades, I still highly recommend following along with Jeff’s recommendations. Jeff knows how to pick the best options trades in order to balance the risk and reward in your favor, and make the most of these moves.
Over the last year, these setups altogether have delivered an average winning gain of about 5.8%. That’s not huge on its own, but when amplified with the smart leverage options provide… it’s ripe for huge short-term returns.
As I mentioned, Jeff identified 10 coiled-spring setups for viewers of yesterday’s webinar, The Countdown to Chaos Event. We’ve made a replay available – but be sure to watch it now. By tomorrow, the setups could be gone.
S&P 500 companies have authorized a record $750 billion in stock buybacks so far this year.
Executives spent nearly $300 billion of that on repurchases in the first quarter when trade uncertainty plunged stocks into correction territory.
The tech companies that have accounted for the bulk of buybacks so far this year have committed to dramatically increase their AI investments, a potential headwind for buybacks later this year.
The S&P 500 has authorized record stock buybacks so far this year in what could be a lifeline for the stock market in turbulent times.
As of June 5, directors of S&P 500 companies had given management permission to spend a cumulative $750 billion on share repurchases, a big jump from the $600 billion authorized by the same time in 2023 and 2024, according to recent research from LPL Financial. Approximately 80% of this year’s total buyback authorization is concentrated in three sectors: communication services ($210 billion), financials ($200 billion), and information technology ($196 billion).
Record authorizations gave executives plenty of dry powder to use when the S&P 500 slid into correction territory in March. S&P 500 companies spent $283 billion on buybacks in the first quarter, a 24% increase from the fourth quarter and 27% above the same period last year. Tech giants were the most active buyers; Apple (AAPL), Meta (META), Alphabet (GOOGL) and Nvidia (NVDA) spent a cumulative $73 billion last quarter.
Buybacks, by supplementing demand from individual and institutional investors, have the potential to support stock prices during drawdowns like those seen earlier this year. There’s also evidence to suggest they lower trading costs for everyday investors. A 2021 U.S. Chamber of Commerce study found that the liquidity and price discovery benefits provided by corporate buybacks had saved retail investors between $2.1 billion and $4.2 billion since 2004.
But a buyback authorization doesn’t guarantee shares will be repurchased. Market conditions, valuations, and management teams’ priorities together determine whether buybacks happen. Stock prices have rebounded from their mid-April lows, putting the S&P 500’s P/E ratio about where it was at this time last year when threats to inflation and growth paled in comparison to today’s. That, plus lingering uncertainty about the economic impacts of tariffs, could temper corporate America’s appetite for buybacks.
Plus, the companies that have spent the most on buybacks in recent years are also the ones dramatically increasing their business investments. Microsoft (MSFT), Amazon (AMZN), Alphabet, and Meta plan to spend more than $300 billion on AI infrastructure and other capital expenditures this year, a 35% increase from 2024.
Amazon is an illustrative example of the way business expenses and investments can preclude repurchases. The company’s board approved a $10 billion buyback program in early 2022. Amazon spent about $4 billion of that shortly thereafter but hasn’t purchased any shares since. Over the same period, capex spending has soared from about $63 billion to an estimated $104 billion.
PPI inflation comes in soft… can Bitcoin break triple-top resistance?… waiting on “altcoin season” … be careful about heading bearish warnings… keep your eye on private credit
This morning, we learned that the Producer Price Index (PPI), which measures wholesale prices, rose just 0.1% in May, coming in below forecasts.
Core PPI, which strips out volatile food and energy prices, increased a mild 0.1% last month, also below expectations.
Let’s jump to legendary investor Louis Navellier for the takeaway. From this morning’s Flash Alert in Growth Investor:
Well, the mythical inflation bogeyman has not materialized, folks…
This is great news. The Federal Reserve has been anticipating higher inflation once the tariffs kick in, yet it continues to come in well below expectations…
The bottom line is the Fed is going to have to say something at its meeting next week. And while I don’t expect them to cut key interest rates, they’re going to have to give us some guidance.
They keep imagining an inflation bogeyman that hasn’t materialized.
Louis’ reference to “next week” is the Federal Reserve’s June FOMC meeting that concludes on Wednesday.
As he noted, no one is anticipating a rate cut, but with inflation failing to materialize, we’ll be looking for Fed Chair Powell’s rationale for waiting.
We’ll also be eager to review the new Dot Plot that will include the Fed members’ updated forecasts on inflation and the fed funds target rate as we look ahead to the coming months.
Can Bitcoin break through resistance to reach $150,000?
As I write Thursday, the crypto trades just above $107,000 – that’s about 4% below its all-time high of just under $112,000, set last month.
Bitcoin has pushed above $110,000 three times since Tuesday, only to fall back, creating a “triple top” of resistance.
Are we about to see a resistance break, followed by a new all-time high? Or will $110,000 prove too strong, resulting in a meaningful pullback where Bitcoin will have to regroup and lick its wounds for a few weeks?
While it’s anyone’s guess what happens over the next few days, our crypto expert Luke Lango believes a handful of bullish factors mean Bitcoin will be materially higher by Labor Day.
Let’s go to his latest issue of Crypto Investor Network:
What we’re looking at here is a textbook case of macro bark shaking out weak hands while fundamentals remain steadfastly bullish.
In fact, we’re still targeting $150,000 on Bitcoin by late summer and an altcoin surge higher over the next few months.
Luke points toward a few tailwinds to fuel a bullish push.
First, the U.S. Labor Department reversed a Biden-era ruling that warned 401(k) plan issuers against using cryptos in workplace retirement portfolios. The move is part of a broader push from the White House to introduce cryptos into 401(k) portfolios.
But the more impactful move from the government comes via new legislation. Here’s Luke:
A new – and better – crypto bill is now making its way through Washington, D.C.
The newly released Digital Asset Market Clarity Act, known as the CLARITY Act, promises to bring transparency on rules and lower legal risks for platforms like Coinbase and Robinhood.
The bill outlines which agency (SEC or CFTC) has jurisdiction, how firms should register – potentially as an alternative trading system (ATS) or as a digital commodity exchange, broker or dealer – and when a token should be considered a security or a commodity.
The bill also gives the CFTC authority over crypto spot markets.
Congress’s continued work on crypto regulation is a welcome step. For years, the industry has faced a hostile and uncertain regulatory environment, pushing many innovators to seek clearer rules abroad.
A well-crafted legislative framework could finally resolve the awkwardness of traditional securities laws being applied to decentralized crypto networks. And that’s likely to clear the way for higher prices.
But if Bitcoin at $150K gets you excited, hang on for Luke’s fall forecast:
Inflation expectations are cooling. Rate cuts are back on the table. And we’re still tracking a post-halving pattern that points to $150K Bitcoin by late summer and $200K by fall.
Bitcoin at $200K would mean an 87% gain from here.
Keep on the lookout for “altcoin season”
In crypto markets, “altcoin season” refers to a period when alternative cryptocurrencies – anything that’s not Bitcoin – start to outperform Bitcoin.
Normally, the granddaddy crypto dominates the market and sets the tone, pulling most investor attention and capital. But eventually, when Bitcoin’s rally slows or consolidates after a strong move up, risk appetite shifts.
Investors begin rotating into smaller, more volatile assets (like Ethereum, Solana, or meme coins), hunting for bigger returns. When this happens, the returns from leading altcoins can be enormous, putting “87%” to shame.
To be clear, we’re not there yet.
We can see this by looking at the CMC Altcoin Season Index. This shows us the performance of the top 100 altcoins relative to Bitcoin over the past 90 days. If 75% of the top 100 coins outperform Bitcoin in the last 90 days, it’s Altcoin Season.
As I write, we’re only at 31. However, we’re moving in the right direction. On April 25, the index clocked in at just 12.
We’ll keep an eye on this and will alert you as the index heats up. After all, love them or hate them, few things can make you as much money – in as short a period – as altcoins when they get hot.
Here’s Luke’s bottom line:
[Even though altcoins remain subdued right now], that’s how things started in every previous cycle. Altcoins lagged, seemed dead. Then they erupted.
The catch-up trade is real, and it happens fast. We still believe we’re in the early innings of that move.
The burden of “timing” for bears
Yesterday, CNBC reported that JPMorgan’s CEO Jamie Dimon suggested the economy is headed for a slowdown, saying, “I think there’s a chance real numbers will deteriorate soon.”
This is certainly a possibility, and it’s one we track regularly in the Digest.
However, we must take this warning with a grain of salt since Dimon appears to be growing into a permabear.
In 2020, he warned of “a bad recession.” In December 2022, he doubled down, saying that we could face a “mild or hard recession.”
Since that second warning – December 6, 2022 – the S&P has surged 51%.
Then, on February 27, 2024, Dimon was back at it, downplaying the overall positive investor sentiment and market gains. He said, “markets change their mind pretty quickly,” followed by:
Remember, in 1972 you felt great, too. And before any crash, you felt great, and then things change.
Since that comment, the S&P has climbed 19%.
This underscores something we’d be wise to remember today…
Bearish forecasts are only as useful as the accuracy of their timing.
After all, what benefit is there in being right about a bearish forecast if it comes to fruition on the other side of a monster rally you missed?
Even if the market crashes 30% tomorrow, your portfolio would still be higher for having ignored Dimon’s warning back in 2022 before the market’s 51% ascent.
This is why my cautious Digests in recent years always urged readers to abide by their stop losses and be mindful of position sizing, but with those safeguards in place, stick with bullish momentum.
Let’s recall the wise words of the legendary Peter Lynch:
Far more money has been lost by investors preparing for corrections or trying to anticipate corrections than has been lost in the corrections themselves.
This is why we urge investors to learn how to trade volatile markets rather than trying to time a bear.
On that note, if you missed him yesterday, master trader Jeff Clark held a live presentation detailing exactly how he’s trading, and profiting from, volatility today.
Jeff – like Dimon – believes we’re in for some market pain. But Jeff sees opportunity in this, confident that there are big trading profits to be had, whether markets are falling or soaring.
To illustrate this bi-directional opportunity, here are the trades Jeff recommended at his live trading blog, Delta Direct, going back to the end of March.
Notice how he’s making money in both long and short trades – as well as how quickly Jeff is in and out of the market.
Circling back to Dimon, there was one part of this latest interview that caught our eye…
His warning on private credit.
Be careful about jumping into private credit today – and consider skimming some profits if you’re already in it and up nicely
While private credit has historically offered attractive yields, several factors (and Dimon) suggest that now may not be the best time for new investments. You might even want to take some money off the table.
To make sure we’re all on the same page, private credit involves non-bank lending to companies, typically through direct loans or private debt funds. Unlike public credit markets, these loans are not traded on exchanges, offering investors higher yields in exchange for reduced liquidity.
Currently, private credit yields are at a four-year high. The upper middle-market loans are offering yields around 10.15%.
That might sound attractive, but there’s a catch: The spread, or extra compensation you get for holding these less liquid, private loans instead of similar public ones, has collapsed.
Today, the yield premium over comparable public credit is only around 226 basis points (or 2.26%). That spread is narrow by historical standards. In other words, you’re not getting paid as much of a premium for assuming the added risk.
In fact, that 226 basis-point spread is almost twice as tight as the average we’ve seen since 2021.
Remember the old market truism: The more you pay today, all else equal, the lower your returns will be tomorrow.
Here’s Dimon from yesterday:
Do I think that now is a good time to buy credit if I was a fund manager?
No. I wouldn’t be buying credit today at these prices and these spreads.
Circling back to Louis, he’s warned investors to be careful of excessive leverage in private credit
Here’s Louis from one of his past Growth Investor Flash Alerts:
What has happened in America is that we’ve become like China. We have an official bank lending system, then we have an unofficial lending system, controlled by the private credit industry.
Now, private credit is exploding everywhere. This is what you can buy at Morgan Stanley and almost every broker/dealer and financial advisor.
And you can – right now – get an 11% yield, and you’ll get your money back in two years. But the question is “how are they getting an 11% yield?”
What’s happening is it looks like they’re starting to leverage.
It’s time to be especially cautious about this leverage.
Let’s go to Bloomberg:
The companies that get private credit loans are looking increasingly wobbly and banks are among those that could eventually be on the hook for losses.
Many companies getting direct loans from private lenders are struggling to produce cash, by at least one key measure: At the end of 2024, more than 40% of borrowers had negative free cash flow from their businesses, the International Monetary Fund warned in a report this past week. That’s up from closer to 25% at the end of 2021.
Borrowers that aren’t generating enough cash flow are at greater risk of defaulting, a particular concern as trade wars lead to fears of economic stagnation.
Turning to your portfolio, a handful of companies that have exposure here are Apollo Global Management (APO), Ares Management Corporation (ARES), Blackstone Inc. (BX) (Disclaimer: I own BX), and Blue Owl Capital Inc. (OWL).
To be clear, we’re not predicting an imminent collapse. But prices are toppy, spreads are shrinking, and caution is warranted.
AMD (AMD) unveiled its next-generation MI400 chips at its “Advancing AI” event Thursday. The chip isn’t expected to launch until 2026, but it already has some high-profile customers, including OpenAI.
OpenAI CEO Sam Altman joined AMD CEO Lisa Su onstage Thursday to highlight the ChatGPT developer’s partnership with AMD on AI infrastructure and announce that it will make use of the MI400 series.
“When you first started telling me about the specs, I was like, there’s no way, that just sounds totally crazy,” Altman said. “It’s gonna be an amazing thing.”
AMD said it counts Meta (META), xAI, Oracle (ORCL), Microsoft (MSFT), Astera Labs (ALAB), and Marvell Technology (MRVL) among its partners as well.
AMD showcased its AI server rack architecture at the event, which will combine MI400 chips into one larger system known as Helios. The company compared it to rival Nvidia’s (NVDA) Vera Rubin, also expected in 2026.
The event also brought the launch of AMD’s Instinct MI350 Series GPUs, which it claims offers four times more computing power than its previous generation.
Shares of AMD slid about 2% Thursday, leaving the stock down just under 2% for 2025 so far.
President Donald Trump posted that “changes are coming” to his “aggressive policy on immigration,” noting that farmers and the hospitality industry have lost “very good, long time workers.”
The White House press office didn’t immediately respond to questions about potential policy changes.
Some companies have said the administration’s deportation efforts have contributed to a decline in their customers’ spending, particularly among Hispanic consumers.
The White House may adjust immigration policies in response to employer concerns in some industries, according to President Donald Trump.
“Our great Farmers and people in the Hotel and Leisure business have been stating that our very aggressive policy on immigration is taking very good, long time workers away from them, with those jobs being almost impossible to replace,” Trump wrote early Thursday on Truth Social.
“This is not good,” Trump’s post concluded. “We must protect our Farmers, but get the CRIMINALS OUT OF THE USA. Changes are coming!”
The White House didn’t respond to Investopedia’s questions about employers’ concerns and potential policy changes in time for publication. Trump told reporters at the White House Thursday that he would soon issue an order to address employers’ concerns, Bloomberg reported.
“We look forward to working with the President on solutions that ensure continuity in the food supply in the short term, and we call on Congress to follow the President’s lead to develop a permanent solution that fixes outdated and broken farmworker programs,” American Farm Bureau Federation President Zippy Duvall said in a statement.
]“As an industry, we are committed to strict compliance with labor laws and immigration regulations, including those focused on recruitment, background checks and employment verification,” said Ralph Posner, spokesperson for the American Hotel & Lodging Association. “Along with our members, we continue to communicate with Congress and the administration about the importance of building a strong hospitality and tourism workforce.”
Leisure and hospitality businesses, including ventures run by the Trump family, employ nearly 17 million people, according to April data from the Bureau of Labor Statistics. Immigrants make up roughly one-third of the hospitality industry workforce, according to the American Hotel & Lodging Association. The farm and agriculture industry also relies on foreign-born workers, often from Mexico and Central America “with many lacking authorization to work legally in the United States,” the Department of Agriculture said.
Besides impacting businesses’ labor supply, the administration’s high-profile deportation campaign is cutting into customers’ spending and corporate revenues.
Companies have seen a pullback, in particular, from Hispanic customers, who are generally in better shape financially than other consumers, but are shopping in-stores less due, in part, to concerns about immigration enforcement.
“Families are being wise,” Eric Rodriquez, from the civil rights group UnidosUS, told Investopedia in May. “If they are going to lose a breadwinner tomorrow, they need the resources to do something about that.
This article has been updated since it was first published to incorporate more context and data, as well as the statements from the AHLA spokesperson and the Farm Bureau.
Climate has always been an important consideration in deciding where to buy a home, but never more so than now. If you’re planning to buy in the near future, you not only need to consider what the local climate is like today but how it could change in the next 10, 20, or even 30 years.
Because of the growing risks posed by climate change—including floods, wildfires, and extreme heat—buying in the wrong place could make it harder to get a good mortgage, purchase insurance at affordable rates, or even resell the home someday. It could also put your family’s life in jeopardy. Here is what you need to know.
Key Takeaways
Climate change is having an impact on home values, insurance costs, and the ability to get a mortgage.
Major problems include flooding, fire, excessive heat, and poor air quality.
Most parts of the U.S. are seeing the effects of climate change, but some have been particularly hard hit.
Flooding and Rising Insurance Costs
Flooding has become an increasingly common risk due to such factors as rising sea levels along the coasts and more intense rainstorms inland. Unfortunately, homeowners’ insurance rarely covers flood damage. For that potentially costly hazard, you need to buy a separate flood insurance policy, most of which are backed by the federal government’s National Flood Insurance Program.
Many mortgage lenders require homeowners to purchase flood insurance if the property they’re looking to buy is in a flood zone judged risky by the Federal Emergency Management Agency (FEMA).
By FEMA’s definition, “Any place with a 1% chance or higher chance of experiencing a flood each year is considered to have a high risk. Those areas have at least a one-in-four chance of flooding during a 30-year mortgage.”
FEMA issues new flood maps periodically based on changing risk levels and improvements in the technology and mathematical models it uses. In 2024, it released updated flood maps for many areas, which added thousands of homes to the high-risk category. In South Florida, for example, nearly 140,000 structures moved from a low- or moderate-risk classification to a high-risk one.
Tip
You can view the flood maps for any areas you’re considering online at the FEMA Flood Map Service Center.
Outside of FEMA-designated zones
But you don’t have to live in an official high-risk area to experience flooding. As FEMA notes, “Floods occur naturally and can happen almost anywhere. They may not even be near a body of water, although river and coastal flooding are two of the most common types. Heavy rains, poor drainage, and even nearby construction projects can put you at risk.” According to FEMA, “statistics show that people who live outside high-risk areas file more than 25% of flood claims nationwide.”
For that reason, homeowners who aren’t required by their lender to buy flood insurance may want to do so anyway. Premiums will vary according to the risks that your specific property is believed to pose and should not vary from one company or agent to another. According to FEMA data, single-family homeowners were paying $786 a year, on average, in late 2023, although that average included many policyholders who enjoyed a discounted rate due to a previous pricing model; new policyholders were paying an average of $1,290.
However, those averages give little hint of the much higher rates some policyholders have to pay. As the Miami Herald reported in 2023, residents of one ZIP code in Miami/Dade County were paying average premiums of $7,097, based on the new pricing model.
What’s more, insurers are allowed by law to raise premiums up to 18% a year. So a policy that is barely affordable now could be out of reach in a few years’ time.
You can get a current price quote on the National Flood Insurance Program website by entering the address of the home and some details about its size and construction.
90%
Percentage of all natural disasters in the U.S. that involve flooding.
Fire Risk and Drought-Prone Areas
Unlike flooding, damage caused by fire is covered under a typical homeowners policy, up to whatever limits you opted for when you bought it. That’s the good news. The bad news is that policyholders are far more likely today to find themselves having to file a fire-related claim.
Since the early 1980s, the U.S. has seen a relatively consistent average of about 70,000 wildfires each year, according to the U.S. Environmental Protection Agency (EPA). What has changed dramatically during that time is the magnitude of those fires, in terms of the acreage they consume and the number of homes they damage or destroy. In fact, the EPA says that “of the 10 years with the largest acreage burned, all have occurred since 2004. … This period coincides with many of the warmest years on record nationwide.”
While more than 80% of wildfires are caused by human actions, according to the National Park Service, drought, driven by climate change, is often a major factor in their wide and rapid spread.
Fires can happen anywhere and for many different causes, of course, but wildfires tend to be concentrated in certain parts of the U.S. In 2024, for example, wildfires destroyed 2,406 residences in the U.S., with the vast majority of them in either the American Southwest (1,010), Southern California (552), or Northern California (462).
A 2025 white paper from Moody’s predicted that the disastrous Southern California wildfires earlier that year were likely to raise insurance rates, compel insurers to write fewer policies, and spur a decline in property values. In addition, it suggested that anyone looking to buy in the area could find it harder to obtain a mortgage after lenders figured their likely insurance premiums into their debt-to-income ratio.
Minimizing risk
As if all that weren’t enough, wildfires also increase flood risk by destroying the vegetation that could otherwise absorb rainwater.
Would-be homeowners who are house hunting in a fire-prone area should be on the alert for features that will at least minimize their risk. That includes noncombustible or fire-resistant roofs and exterior walls and a “defensible space” around the home consisting of gravel, brick, or concrete and minimal flammable vegetation. It’s also worth investigating the extent to which the local community has implemented measures to prevent or minimize the damage from wildfires.
Some states are also beginning to offer incentives to homeowners who take steps to make their homes more resilient.
Heatwaves, Air Quality, and Livability
Besides floods and fires, climate change can impair your quality of life in other ways, depending on where you decide to buy a home.
Extreme heat is one increasingly important consideration. While many parts of the country have experienced higher temperatures and more days of them in recent years, certain states have been particularly hard hit. A 2022 report from First Street Technology designated what it calls an “Extreme Heat Belt,” comprising 1,023 U.S. counties where residents can expect to experience temperatures above 125°F by 2053. The organization says that the belt “stretches from the Northern Texas and Louisiana borders to Illinois, Indiana, and even into Wisconsin.”
High temperatures are not only dangerous for human and animal health, but can be costly in terms of energy costs and force people to stay indoors when they’d rather be outside.
Air quality can be another concern. Despite decades of national efforts to reduce pollution, the proliferation of wildfires, extreme heat, drought in many regions have led to an increase in ozone and particulate matter in the air, according to First Street Technology. It says the problem is most severe in the American West and singles out parts of California and the cities of Portland and Seattle as being at the greatest risk.
Anyone who chooses to live in area with poor air quality can reduce their risks somewhat by selecting a community that has implemented measures to address the problem, such as investing in a modern public transit system and expanding green spaces, such as parks.
Coastal Erosion and Sea-Level Rise
Home buyers interested in a waterfront or coastal property face a number of climate-related hazards. Sea-level rise is a major one.
For coastal properties in particular, hurricanes and storm surges, which have been increasing in intensity as a result of climate change, are a serious concern, as is coastal erosion.
Addressing these problems—through physical structures like sea walls or “green infrastructure,” such as planting vegetation or creating new wetlands—is expensive and not always successful. So some properties may be beyond saving and their owners may have no choice but to relocate in a number of years.
The Bottom Line
Climate change is an unfortunate fact and one that home buyers ignore at their peril. If you’re looking to buy in the near future, you’ll want to consider both the risks you could face today and how they might become worse in the future. For most of us, a home is a major investment and often a long-term commitment. You’ll enjoy your new home all the more knowing that you’ve done as much as you can to keep your family and your finances out of harm’s way.
While the suburbs have long been a place where families can stretch out into bigger, more affordable homes compared to urban areas, many middle-class buyers now find themselves priced out of buying in the suburbs.
What’s driving these trends? Factors such as tight housing inventory, an overall rise in real estate prices in recent years, and shifting demand patterns have caused many suburban markets to heat up across the country. When comparing price-per-square foot, the suburbs are more expensive in 53% of the 100 largest metro areas in the U.S., and 65% of these suburban areas are more expensive on an overall basis, due in part to larger homes in the suburbs versus cities, according to Realtor.com listing data.
However, that doesn’t mean you’re out of luck if you’re looking for a suburban home. Here, we’ll examine what’s driving this affordability challenge and how you can better navigate it.
Key Takeaways
Suburban housing prices have climbed steeply due to factors like pandemic-era migration and limited housing supply.
Many buyers seek the extra space and family-friendly features of suburbs, but higher prices and higher mortgage rates now make that difficult for middle-class buyers.
While options still exist, finding an affordable suburban home often involves making significant trade-offs, like in home size, location, or condition.
The Suburbs Became the New Hot Market
A big reason behind this affordability issue is that the pandemic helped advance what was already a shifting trend, such as with many Millennials starting families. During the early days of Covid, many city dwellers found themselves working remotely in cramped apartments, so they decided to spread out into the suburbs. That trend has continued as more buyers seek advantages often associated with the suburbs, such as good schools and family-friendly spaces.
While the exact trends have varied by market, many metro areas have been seeing faster price growth in the suburbs. For example, many suburbs in the Atlanta, Austin, and Denver real estate markets have seen larger increases than the city limits.
Low Inventory and Construction Bottlenecks
The demand for suburban housing isn’t the only thing driving up prices. The nationwide trend of low housing inventory across different types of markets is also a contributing factor. This inventory issue is multi-dimensional.
For one, the number of listings for sale is often low, such as due to homeowners hanging onto low-interest-rate mortgages that they obtained by moving or refinancing during the early days of the pandemic.
Another issue is that new construction has been slow, which also limits inventory. Issues like high material costs amidst inflation and tariffs, labor shortages, and other challenges like zoning approvals have led to a limited supply of new homes.
Note
Many builders focus on higher-margin homes that might not be right for those looking for a starter home, which limits the supply for middle-class families shopping in the suburbs.
Affordability Squeezed by Mortgage Rates and Cost of Living
While previously low mortgage rates have kept many homeowners in place, those looking to move now face an additional challenge of significantly higher mortgage rates. Instead of the sub-3% rates in parts of 2020 and 2021, homebuyers now face mortgage rates of nearly 7% for a 30-year mortgage.
Those higher rates, combined with rising prices and continued inflation, create an affordability crunch. Although wages have gone up, income growth has not kept pace with housing inflation.
Plus, many desirable areas have seen big increases in additional housing costs that you might not consider when first looking for homes. For example, insurance costs have been rising almost everywhere in the U.S., with one-third of U.S. ZIP codes seeing a 30% increase in home insurance prices from 2021-2024.
What Buyers Can Do Now
All of these factors are making it difficult for young families or other first-time buyers to afford a home. If you don’t already own a home, then you’re not necessarily benefiting from the rise in housing prices, making it difficult to save up enough for a down payment and afford monthly mortgage payments. However, there are some steps you can take to overcome these cost challenges, such as:
Moving further out, especially if you work remotely and don’t need access to an urban job market, or if you’re willing to do a much longer commute.
Looking for homebuying assistance programs, such as those that help cover down payments for first-time buyers.
Buying fixer-uppers, where you’re willing to put in sweat equity to get the house up to the level you’re looking for.
Renting longer or indefinitely — buying isn’t the right choice for everyone, and sometimes renting is cheaper, considering all the extra costs of homeownership. You can find online calculators to see if you’d likely come out ahead renting versus buying.
Co-buying with family or friends, although be aware of the complexity this can add.
Getting pre-approved and working with experienced agents and mortgage brokers, as part of the right team, can help you clearly understand what you qualify for and what’s realistic. However, keep in mind that these professionals have an incentive to sell to you, so you also might want external advice, such as from a financial advisor.
The Bottom Line: The Suburban Dream Isn’t Dead—But It’s Changing
Although affordability has become more challenging in the suburbs, that doesn’t mean moving out of the city is impossible. However, buyers might have to shift their expectations, such as buying in different areas than they assumed or choosing a smaller home than they’d ideally like. If you’re strategic in your search, do your homework, and keep an open mind, buying a home in the suburbs is still possible.
The states with the cheapest 30-year refinance rates Wednesday were New York, California, Connecticut, Washington, Virginia, Colorado, Florida, and Texas. These low-rate states registered refi averages between 6.90% and 7.04%.
Meanwhile, the states with Wednesday’s most expensive 30-year refinance rates were Alaska, Hawaii, Montana, North Dakota, West Virginia, Wyoming, and Kentucky. These high-rate states registered refi averages between 7.16% and 7.19%.
Mortgage refinance rates vary by the state where they originate. Different lenders operate in different regions, and rates can be influenced by state-level variations in credit score, average loan size, and regulations. Lenders also have varying risk management strategies that influence the rates they offer.
Since rates vary widely across lenders, it’s always smart to shop around for your best mortgage option and compare rates regularly, no matter the type of home loan you seek.
National Mortgage Refinance Rate Averages
Rates for 30-year refinance mortgages have fallen for three days straight, completely reversing last week’s surge. Sliding another 5 basis points, the Wednesday average is 7.09%—an improvement vs. the 7.32% May peak that was a 10-month high.
Back in March, however, rates plunged to a 6.71% average—their cheapest 2025 mark. And last September, 30-year refinance rates sank to a two-year low of 6.01%.
The rates we publish won’t compare directly with teaser rates you see advertised online since those rates are cherry-picked as the most attractive vs. the averages you see here. Teaser rates may involve paying points in advance or may be based on a hypothetical borrower with an ultra-high credit score or for a smaller-than-typical loan. The rate you ultimately secure will be based on factors like your credit score, income, and more, so it can vary from the averages you see here.
Calculate monthly payments for different loan scenarios with our Mortgage Calculator.
What Causes Mortgage Rates to Rise or Fall?
Mortgage rates are determined by a complex interaction of macroeconomic and industry factors, such as:
The level and direction of the bond market, especially 10-year Treasury yields
The Federal Reserve’s current monetary policy, especially as it relates to bond buying and funding government-backed mortgages
Competition between mortgage lenders and across loan types
Because any number of these can cause fluctuations simultaneously, it’s generally difficult to attribute any change to any one factor.
Macroeconomic factors kept the mortgage market relatively low for much of 2021. In particular, the Federal Reserve had been buying billions of dollars of bonds in response to the pandemic’s economic pressures. This bond-buying policy is a major influencer of mortgage rates.
But starting in November 2021, the Fed began tapering its bond purchases downward, making sizable monthly reductions until reaching net zero in March 2022.
Between that time and July 2023, the Fed aggressively raised the federal funds rate to fight decades-high inflation. While the fed funds rate can influence mortgage rates, it doesn’t directly do so. In fact, the fed funds rate and mortgage rates can move in opposite directions.
But given the historic speed and magnitude of the Fed’s 2022 and 2023 rate increases—raising the benchmark rate 5.25 percentage points over 16 months—even the indirect influence of the fed funds rate has resulted in a dramatic upward impact on mortgage rates over the last two years.
The Fed maintained the federal funds rate at its peak level for almost 14 months, beginning in July 2023. But in September, the central bank announced a first rate cut of 0.50 percentage points, and then followed that with quarter-point reductions on November and December.
For its third meeting of the new year, however, the Fed opted to hold rates steady—and it’s possible the central bank may not make another rate cut for months. With a total of eight rate-setting meetings scheduled per year, that means we could see multiple rate-hold announcements in 2025.