Markets Fall as Tariff Fears Deepen


Assessing the “fairness” of tariffs … Bitcoin keeps falling; the level to watch … why the Strategic Bitcoin Reserve didn’t help … a spat among the Mag 7s

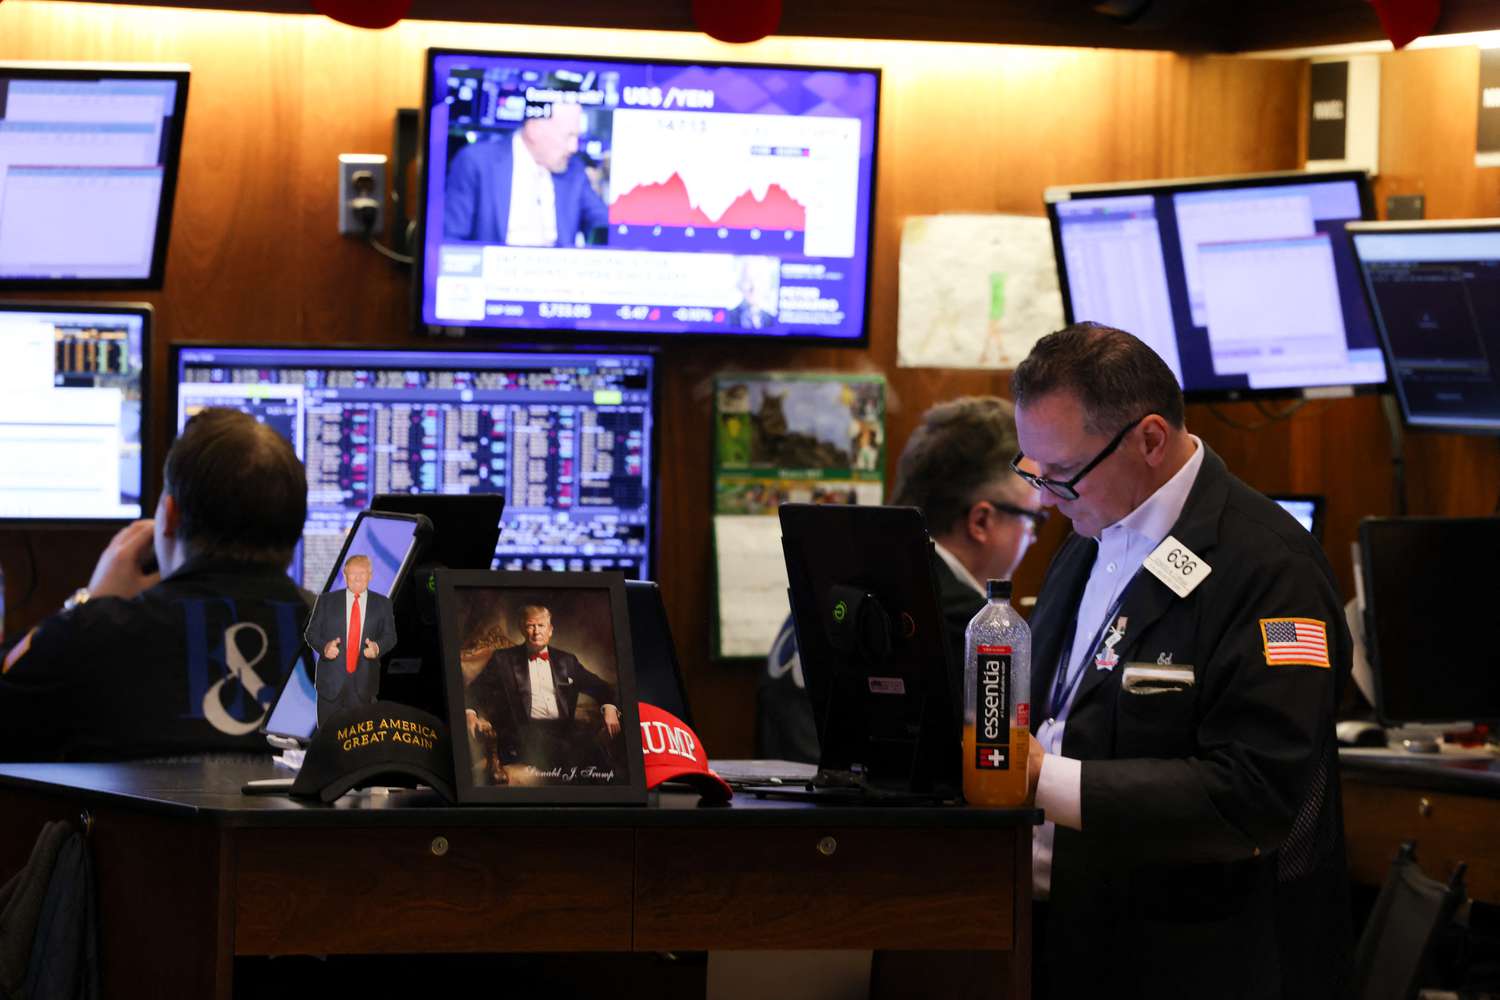
As I write Monday mid-afternoon, the markets are a sea of red. The Nasdaq leads the way, down more than 4%.

Behind the crash is the fear of a recession triggered by President Trump’s tariff policy.

Here’s The Wall Street Journal:

President Trump over the weekend refused to rule out the U.S. entering a recession this year, telling Fox News there will be a “period of transition, because what we’re doing is very big.”

Now, though Commerce Secretary Howard Lutnick said, “There’s going to be no recession in America,” investors don’t feel reassured.

Tariffs are at the heart of Trump’s economic plans…and the market’s bewilderment

For an illustration, let’s go to Trump last Friday:

Canada has been ripping us off for years on tariffs for lumber and for dairy products. 250% — nobody ever talks about that — 250% tariff — which is taking advantage of our farmers.

So that’s not going to happen anymore.

Trump went on to say that he may soon implement reciprocal tariffs on Canadian lumber and dairy products.

Back to Trump:

They’ll be met with the exact same tariff unless they drop it, and that’s what reciprocal means.

And we may do it as early as [last Friday], or we’ll wait till Monday or Tuesday, but that’s what we’re going to do. We’re going to charge the same thing. It’s not fair.

This brings up something we should wrestle with…

What “fair” means

If tariffs are placed on Canadian lumber and dairy, it will make those imports more expensive.

U.S. producers can take advantage by selling their goods at higher prices (though still lower than Canadian prices) without as much competition from cheaper Canadian products.

This is great for U.S. dairy and lumber manufacturers – not so great for the U.S. consumers who are now paying higher prices.

Is that fair?

Remember, the U.S. consumer is responsible for about 70% of our GDP. Meanwhile, my back-of-the-napkin calculation of the size of the U.S. dairy and lumber industries clocks in at less than 4% of our GDP.

Perhaps the better question isn’t “what is fair?” but rather “to whom do we want to be fair?”

The economic risk of “cutting off our nose to spite our face”

A leading political/economic theory holds that beneath Trump’s bluster, he’s using tariffs purely as a negotiating tool to force other countries to bring down their levies on U.S. exports.

If this is the case, great. Let’s use them selectively, briefly and then be done with it.

But as we noted in Friday’s Digest, the longer that Trump uses, or even threatens to use tariffs, the greater the risk of stagflation.

Trump’s on-again-off-again tariffs makes it difficult for corporate planners, so they’re pushing off capital investments and hiring decisions. This slows the economy and the velocity of money, threatening low/no-growth (i.e., the “stagnant” part of stagflation).

Trump appears unmoved by C-suite managers asking for clarity. Here’s CNBC from this morning:

President Donald Trump has dismissed the growing chorus of CEOs, investors and policymakers who are pleading with the White House for greater clarity about his sweeping tariff agenda.

“They always say that. ‘We want clarity,’” Trump said in a Fox News interview that aired Sunday.

“They have plenty of clarity.” 

As to the “inflation” part of stagflation, consumers appear to be increasingly worried about the impact of tariffs on prices.

Here’s the Federal Reserve Bank of Richmond last week:

In February 2025, households’ inflation expectations over the next 12 months rose for the third straight month. They now sit at 4.3 percent, which is the highest mark since November 2023…

Worryingly, longer-run inflation expectations rose to 3.5 percent in February, the highest mark in nearly 30 years (April 1995).

Inflation fears risk fueling the attitude of “buy it now before the price rises!” which, unfortunately, serves as a self-perpetuating feedback loop, creating the exact higher prices that are feared.

Meanwhile, there’s a lurking question…

What if Trump’s tariffs don’t prompt the desired foreign tariff reductions, but instead, stoke indignant tariff increases? (Which, so far, has been the case.)

Then we enter a game of economic “chicken” between Trump and foreign leaders with the respective economies as potential collateral damage.

Trump claims tariffs are already having the desired result, spurring new manufacturing jobs. From Trump:

We created almost 9,000 new jobs in the auto production field. And the reason for that is largely they think things are happening so they’re already geared up.

While this is great for the individuals who land those 9,000 new jobs, if the cost of that job creation is higher auto prices for the tens of millions of American consumers – and a recession – is that fair?

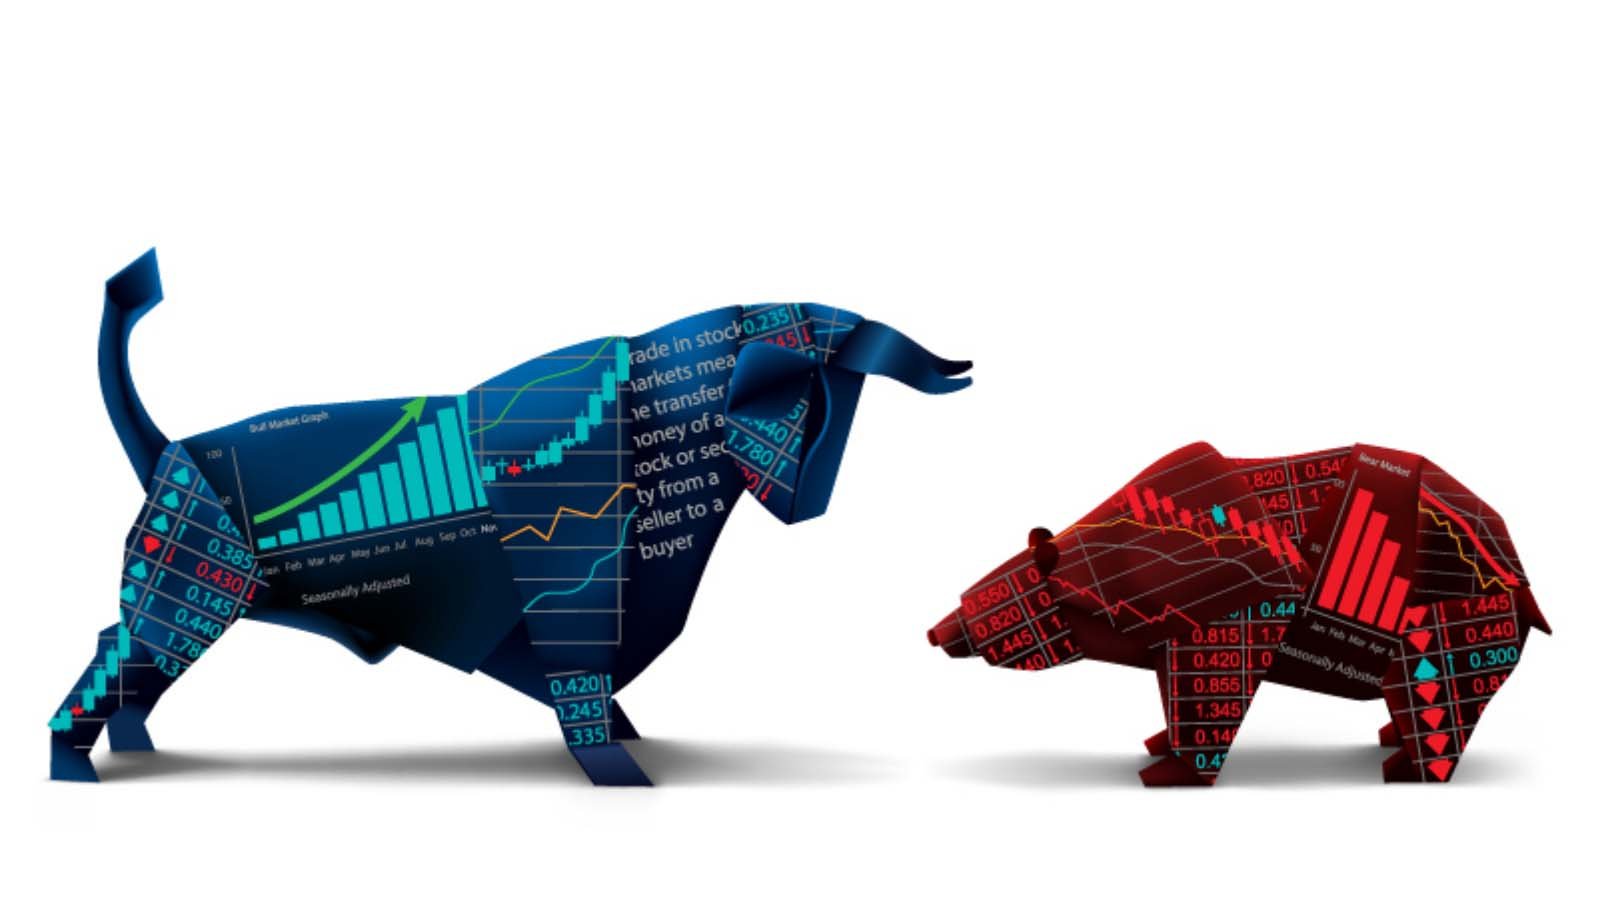
Bottom line: We’d love to see a more balanced trade deficit, but not if the cost is a recession and a bear market.

On that last note, as noted at the top of today’s Digest, the market is deep in the red as I write Monday near lunch. For investors hoping that Trump might see this and course correct, this appears unlikely.

Among his comments in recent days, Trump had the following to say about stocks:

Look, what I have to do is build a strong country. You can’t really watch the stock market.

If you look at China, they have a 100-year perspective. We go by quarters. And you can’t go by that.

Despite this, the chances of a bullish mean reversion rally are growing. We’re going to dive into that in tomorrow’s Digest.

But in the meantime, stick with your investment plan. That means abiding by your pre-appointed stop-losses…yet also looking for great buying opportunities that are on sale as other investors panic.

Crypto investors are feeling deflated

Last Friday, President Trump signed an executive order to create a Strategic Bitcoin Reserve. Funding this reserve will be Bitcoin seized in criminal and civil forfeiture cases.

The executive order also establishes a U.S. Digital Asset Stockpile which will hold other confiscated cryptocurrencies. In a post on Truth Social, President Trump wrote that this stockpile will include ether, XRP, Solana’s SOL token, and Cardano’s ADA token.

So, why isn’t the market more bullish?

Because many in the crypto community wanted a more ringing endorsement from the government.

Here’s TD Cowen’s Jaret Seiberg:

We view this as a compromise.

The government is not spending taxpayer dollars to acquire new digital assets. It is simply not selling the ones that it seizes …

We are dubious that government will be acquiring additional bitcoin for the reserve despite the President’s instructions as we believe it will be politically tough to show how purchases are budget neutral and do not impose incremental costs of taxpayers.

To clarify, Trump’s order keeps open the possibility of the government buying Bitcoin. However, according to a factsheet from the White House, such purchases must be “budget-neutral” and “impose no incremental costs on American taxpayers.”

With the market now recognizing that the U.S. government isn’t about to go on a Bitcoin shopping spree, this leaves Bitcoin lacking a new bullish catalyst.

This gives bears room to drive Bitcoin lower, which they’re doing. As I write, the crypto is struggling to hold $80,000.

Chart of Bitcoin struggling to hold $80K

Source: TradingView

From a technical perspective, we’re nearing a “must hold” level

Last week, when Bitcoin traded below $85,000, our crypto expert Luke Lango wrote the following to his Crypto Trader subscribers:

Right now, Bitcoin is caught between two major technical levels:

  • It’s holding its 50-week moving average—historically, the final line of defense in past boom cycles.
  • It has lost its 25-week moving average—a warning sign seen before previous tops.

If Bitcoin reclaims $85,000, the bull market could surge back with a vengeance.

If Bitcoin breaks below $75,000, it could signal the start of a new crypto winter.

Since then, Bitcoin briefly retook $85,000, but as just noted, it’s now threatening to lose $80,000.

For now, Luke recommends just watching. This is neither the time to bail or buy. As he writes to his subscribers, “we’ll let the market tell us what’s next.”

To join Luke in Crypto Trader for timely updates as well as the specific altcoins he’ll recommend if/when bullish spirits return, click here.

Finally, there’s some trash talk breaking out between the AI big dogs

In February, Microsoft announced it created a new state of matter (as Big Tech races toward creating quantum computing).

Amazon isn’t having it.

From Quartz:

Amazon’s head of quantum technologies, Simone Severini, told chief executive Andy Jassy that the company’s scientific paper “doesn’t actually demonstrate” its claims — only that the new chip “could potentially enable future experiments,” Business Insider reported, citing a copy of Severini’s email obtained by the publication.

Severini also reportedly told Jassy that Microsoft has had “several retracted papers due to scientific misconduct” in quantum computing, and that the company has previously had to withdraw some of its research.

To be fair, Amazon isn’t an impartial bystander. It’s also pursuing quantum computing leadership.

Here’s legendary investor Louis Navellier with more details:

Amazon made its own splash with the Ocelot quantum chip on February 27.

This experimental model uses five “cat qubits,” a newer qubit technology that stores quantum information inside a microwave cavity, rather than on superconducting circuit as a transmon qubit does.

Its feline name comes from the famous Schrödinger cat, a thought experiment suggesting a cat in a box can be both dead and alive until someone looks inside. Cat qubits store information in a similarly confusing quantum state.

I must emphasize that cat qubits are still experimental… and they’re not guaranteed to work at larger scales.

But their potential is enormous.

If this all reads like Greek, don’t worry. We’re not about to dive into the details of quantum physics. But there is a budding investment opportunity emerging in quantum computing that’s important to highlight.

As we’ve been covering in the Digest over the last few days, this Thursday at 1 PM Eastern, Louis is holding an exclusive briefing: The Next 50X NVIDIA Call.

He’s going to dive into why quantum computing is an AI gamechanger on a scale we haven’t seen yet – both from a technological and wealth-building perspective.

He’ll also tell you more about his top quantum pick; it’s a small-cap stock protected by 102 patents with close ties to NVIDIA.

Now, we should quickly answer an obvious question – with NVIDIA being mentioned, why not just invest in it to ride quantum computing?

Well, Louis is doing that. But not just that.

Here he is explaining:

Chipmakers like Nvidia Corp. (NVDA) know that quantum computing is an existential threat to [chipmakers’] dominance. Traditional electricity-based chips have trouble with complex tasks like 3D modeling and encryption. Quantum chips might solve these problems in the blink of an eye.

That’s why firms like Nvidia are quietly funneling billions of dollars into quantum computing startups. They realize they can’t afford to miss out on the world’s next greatest technology.

On Thursday, Louis will dive into all these details, as well as prep you for NVIDIA’s first ever “Quantum Day,” or “Q Day,” as Louis calls it.

Q-Day comes one week from Thursday on March 20. Here’s Louis with the significance:

At that event, Nvidia is poised to ignite the next phase of the quantum investing cycle.

I expect them to announce a new breakthrough technology that could light a fire under the shares of one of its “Q” partners… a stock 1,000 times smaller than Nvidia.

To tell you all about it, I’m hosting an urgent video briefing on Thursday, March 13, at 1 p.m. ET… exactly one week before Nvidia’s announcement… because I want to get you ahead of the crowd.

To join Louis, click here to register.

We’ll keep you updated on all these stories here in the Digest.

Have a good evening,

Jeff Remsburg


Source link

Aussie lower as Nasdaq hits correction territory – United States


Written by Steven Dooley, Head of Market Insights, and Shier Lee Lim, Lead FX and Macro Strategist

Tech stocks crumble on US slowdown fears

Global markets continued to lose ground overnight led by the ongoing fall in US technology stocks.

The tech-focused Nasdaq index lost a massive 4.0% overnight with the benchmark now down 13.1% from last month’s highs. A fall of more than 10% from recent highs is a widely-used definition of a correction.

The US’s Dow Jones fell 2.1% overnight while the S&P 500 lost 2.7%.

In FX markets, most risk-sensitive currencies like the Aussie, kiwi and GBP fell.

The AUD/USD lost 0.5% with the market continuing to trade within the range between 0.6200 and 0.6400.

The NZD/USD lost 0.3% but the kiwi’s relative outperformance versus the Aussie saw the NZD/AUD climb towards the year’s highs.

The Singapore dollar and Chinese yuan were also weaker. The USD/SGD gained 0.2% while USD/CNH climbed 0.3%. 

Chart showing US slowdown scenario reflected in Fed priciing

UK retail resilience fading as GBP rally nears ceiling

The euro and British pound remain the stronger performers in FX markets however both the GBP/USD and EUR/USD have produced short-term reversals near the four-month highs overnight.

Early today, the UK BRC sales monitor will be revealed. According to official figures, sales grew by a strong 2.5% year-over-year on the BRC like-for-like measure in January, with a respectable volume increase.

Accordingly, the last two BRC measurements have been much higher than the average for 2010–19 of 0.4% year over year.

Chart showing GBP/USD and is 50- 100- and 200- weekly moving averages

Malaysia’s stable jobs may boost ringgit

Today, Malaysia’s unemployment rate will be revealed.

In January, we anticipate that the seasonally adjusted unemployment rate will be steady at 3.2%, supported by ongoing resilience, especially in the services sector.

The ringgit’s superior performance in Asia is supported by Malaysia’s better trade balance and perhaps larger tourist surplus.

USD/MYR faces key resistance levels of 50-day 4.4396 and 200-day 4.4719 next where MYR buyers may look to take advantage.

Chart showing Malaysia's unemployment rate

Euro extends outperformance

Table: seven-day rolling currency trends and trading ranges  

Table: seven-day rolling currency trends and trading ranges

Key global risk events

Calendar: 10 – 15 March  

Key global risk events calendar: 10 - 15 March

All times AEDT

Have a question? [email protected]

*The FX rates published are provided by Convera’s Market Insights team for research purposes only. The rates have a unique source and may not align to any live exchange rates quoted on other sites. They are not an indication of actual buy/sell rates, or a financial offer.


Source link

Just How Bad is the Stock Market’s Current Sell-Off?


U.S. stocks had their worst day of an already bad year on Monday as investors raced into safe-haven assets amid growing recession fears. 

The S&P 500 fell 2.7% on Monday, its biggest one-day drop since December. The index has notched only two worse days in the current bull market, which began in late 2022: December 18, 2024, when the Federal Reserve scaled back its rate cut forecast, and August 5, 2024, when the unwinding of a popular leveraged trade briefly sank U.S. equities. 

The last six days have been particularly punishing. The S&P 500 fell nearly 1.8% last Monday when President Trump confirmed a 25% tariff on Canadian and Mexican imports would go into effect the following day. In the five days since, stocks have fallen another 4% despite Trump again partially delaying those tariffs. The S&P 500’s 5.7% decline between last Monday and today stands as the index’s worst 6-day stretch since September 2022. 

Stocks were rattled Monday by comments the President made over the weekend. Trump, in an interview with Fox News aired on Sunday, declined to say whether he expects the U.S. to enter a recession this year. Instead, he said the economy would experience “a period of transition” as his tariffs take effect. The comments echoed his address to Congress last week, in which he said there would “be a little disturbance, but we’re OK with that.”

Is the S&P 500 In Store For a Correction?

It’s been 340 trading days since the S&P 500 last corrected, an abnormally long time. According to research from LPL Financial, since 1929, the average time between S&P 500 corrections has been about 173 days.

Monday’s sell-off brought the S&P 500 closer to a correction than any other pullback in the last year. Stocks fell about 8.4% from peak to trough during their August slump, and they retreated about 4% during their December pullback. With Monday’s losses, the S&P 500 has fallen 8.6% off its all-time high from three weeks ago.

The recent slump, however, has been a much swifter decline than the last correction, which played out over three months, from July 31 to October 27, 2023. The S&P 500 fell 10.3% in that time. It was, however, a short-lived correction; the index rebounded on October 30, the next trading day, and resumed its bull run. 


Source link

Why NVIDIA’s “Q Day” Next Thursday Will Turn This Market Around


Editor’s Note: If you’re a regular Market 360 reader, you probably know I usually share my latest MarketBuzz YouTube video from the previous weekend on Mondays. But in light of today’s turbulent market activity, we’re doing something different today. Instead, I’m going to share the transcript of a Special Market Podcast that I sent to my premium readers earlier this afternoon.

Now, usually, my podcasts are reserved for my paid-up subscribers only. But given today’s selloff, I’m making an exception…


Source link

Dogecoin’s Value Struggles as Holders with $1M+ in DOGE Hedge Against Further Losses with Another Crypto


​Large-scale holders of more than $1 million in Dogecoin (DOGE) are proactively minimizing more losses as its price keeps struggling. These astute investors are looking to Rexas Finance (RXS), a fast-rising cryptocurrency with creative technology and explosive development potential, more and more to hedge against possible downturns. These high-net-worth individuals are setting themselves up to offset DOGE losses by diversifying their portfolios with Rexas Finance and seizing the exciting opportunities of Rexas Finance.

Dogecoin’s Value Struggles and Market Trends

Although Dogecoin’s price changes in the wider crypto market, it remains below the $0.5 mark. Recent losses have drawn attention to a lack of a positive trend, as whale activity provides little support. Unlike in past bull runs, the DOGE price has fallen short of recovering important resistance levels.

At $0.25 right now, the DOGE price has declined 0.43%. Over 24 hours, this has dropped Technical indicators show declining trends; on-chain data shows less activity. The sentiment remains conflicted since some investors bet on Elon Musk’s impact. DOGE’s success still suffers from the lack of main catalysts.

Rexas Finance (RXS): The Token Dogecoin Whales Are Headed To

Rexas Finance’s inventive ecology is its fundamental strength. Rexas Finance develops a flawless blockchain purchase, sale, and trading path by tokenizing actual assets for investors. Among the several advantages this model offers are more openness, reduced transaction costs, and easier access to worldwide markets. Rexas Finance distinguishes itself from other projects by emphasizing the bridge between blockchain technologies and traditional real-world assets. Rexas enables anyone to buy, sell, and exchange real estate worth $379.7 trillion, gold valued at $121.2 trillion, and art with annual sales of $65 billion, empowering everyone to do so with ease and security. The initiative lets people own fractional shares of valuable assets, generating investment opportunities once only accessible to the wealthy. Early investors have seen a whopping 6.67x return on investment (ROI) while the cryptocurrency’s value has skyrocketed. The project’s community-driven approach and artistic aspects have attracted institutional and personal investors, creating demand and bolstering Rexas Finance’s future price projections. The basic Rexas Token Builder allows anyone without technical knowledge to tokenize assets on the platform. Rexas Launchpad users can also enable people to donate money for their tokens. Supporting many criteria, such as ERC-20, ERC-721, and ERC-1155, Rexas Finance guarantees flexibility and overall fit.

Rexas Finance is well-positioned to benefit from the $486 trillion global financial asset market, which encompasses real estate, commodities, and financial assets. Its ETH-based token properties provide even more appeal and help to position Rexas Finance for a possible 12000% surge following launch.Unlike ordinary investors, institutional players seeking exposure to blockchain-based real-world asset investments also find Rexas Finance interesting. Tokenizing physical assets presents a special opportunity to provide liquidity to usually non-liquid marketplaces. This method is changing investing methods by letting smaller investors access high-value assets and giving institutional investors a varied approach to capital allocation. Adding to the excitement, the Rexas Finance team has officially announced that the highly anticipated Rexas Finance token will launch on exchanges on June 19th, 2025. With this confirmed launch date, investors and enthusiasts are eagerly counting down the days until Rexas Finance  makes its public debut with a listing price of $0.25 Joining the Rexas Finance presale offers an excellent opportunity to lock in tokens before prices rise. Visit the official Rexas Finance website to guarantee a safe purchase and avoid fraud. Link your wallet to the platform, then purchase Rexas Finance tokens with compatible cryptocurrencies like Ethereum or USDT. Once your purchase is finished, securely save your tokens in your wallet and monitor the presale phases to stay aware of price changes and advancements.

Conclusion

Given Dogecoin’s continuous price challenges and lack of main catalysts, investors with large holdings are looking at strategic alternatives. Rexas Finance is a good hedge since it exposes investors to actual asset tokenization and offers great development possibilities. As Rexas Finance continues to gain popularity, early investors may find amazing gains, making it an interesting option in today’s changing crypto scene.

For more information about Rexas Finance (RXS) visit the links below:

Website: https://rexas.com

Win $1 Million Giveaway: https://bit.ly/Rexas1M

Whitepaper: https://rexas.com/rexas-whitepaper.pdf

Twitter/X: https://x.com/rexasfinance

Telegram: https://t.me/rexasfinance

Disclaimer: The views and opinions presented in this article do not necessarily reflect the views of CoinCheckup. The content of this article should not be considered as investment advice. Always do your own research before deciding to buy, sell or transfer any crypto assets. Past returns do not always guarantee future profits.


Source link

2025 List Of All Russell 2000 Companies


Updated on March 10th, 2025 by Bob Ciura
Spreadsheet data updated daily

The Russell 2000 Index is arguably the world’s best-known benchmark for small-cap U.S. stocks.

Small-cap stocks have historically outperformed their larger counterparts. Accordingly, the Russell 2000 Index can be an intriguing place to look for new investment opportunities.

You can download your free Excel list of Russell 2000 stocks, along with relevant financial metrics like dividend yields and P/E ratios, by clicking on the link below:


Table Of Contents

Russell Index Overview & Construction

The Russell 2000 Index is a subset of the Russell 3000 Index.

FTSE Russell maintains the Russell 3000 Index, which is comprised of the 4000 largest publicly traded U.S. companies. Note the confusing naming structure; the Russell 3000 actually has 4000 securities in it.

The index is reconstructed annually and updated quarterly with new IPOs (Initial Public Offerings).

The Russell 3000 Index is broken down into the following subgroups (which despite its name includes 4000 securities):

  • Russell 1000: The 1000 largest Russell 3000 Index companies
  • Russell 2000: Companies ranked 1,001 – 3,000 in size
  • Russell Microcap Index: Companies ranked 2,001 – 4000 in size (overlaps with the Russell 2000)

How To Use The Russell 2000 Stocks List To Find Investment Ideas

Having an Excel document that contains financial information on each Russell 2000 stock can be tremendously useful.

This document becomes far more powerful when combined with a knowledge of how to manipulate data within Microsoft Excel.

With that in mind, this article will provide a tutorial on how to implement two actionable investing screens from the Russell 2000 Stocks List.

The first screen that we’ll implement is for stocks trading at price-to-earnings ratios below 15. These are small-cap stocks trading at attractive valuations and should avoid the valuation risk that accompanies investing in overpriced securities.

Screen 1: Small-Cap Value Stocks With Price-To-Earnings Ratios Below 15

Step 1: Download the Russell 2000 Stocks List near the beginning of this article.

Step 2: Highlight all columns.

Step 3: Go to the “Data” tab, then click “Filter.” See the image below for a walk through of steps 2 and 3.

Step 4: Go to the P/E ratio column, click the filter arrow, go to numbers filter, click between, and set to between 0 and 15. See the image below for a guide to this step.

Screen PE RatioScreen PE Ratio

The remaining stocks in this spreadsheet are Russell 2000 stocks with price-to-earnings ratios below 15 and positive earnings.

In the next screen we’ll show you how to implement an investing screen for Russell 2000 stocks that have high-dividend yields and reasonable payout ratios.

Screen 2: High-Yield, Reasonable Payout Ratio Small-Cap Stocks

Step 1: Download the Russell 2000 Stocks List at the link above, and set the columns to “Filter” (see steps 2 and 3 of screen 1).

Step 2: Go to the Dividend Yield column, click the filter arrow, go to numbers filter, click “greater than or equal to,” and add in 0.05.

Step 3: Go to the Payout Ratio column, click the filter arrow, go to numbers filter, and select “between,” and set to between 0 and 0.60. See the image below for a walk through of steps 2 and 3.

Yield And Payout ScreenYield And Payout Screen

The remaining stocks in this spreadsheet have dividend yields of 5% or more and payout ratios below 60%.

This screen reveals small-cap dividend stocks with reasonable payout ratios for further research.

You now have a solid understanding of how to use the Russell 2000 stocks list to find investment ideas.

The remainder of this article will briefly describe the merits of investing in the Russell 2000 Index before explaining other resources that you can use to find investment ideas.

Why Invest In Stocks From The Russell 2000 Index

As mentioned previously, the Russell 2000 Index contains the domestic U.S. stocks that rank 1,001 through 3,000 by descending market capitalization.

The Russell 2000 is an excellent benchmark for small-cap stocks. The average market capitalization within the Russell 2000 is currently ~$3 billion.

Why does this matter? There are a number of advantages to investing in small-cap stocks, which we explore in the following video:

Small-cap stocks have historically outperformed large-cap stocks for two reasons.

Firstly, small-cap stocks tend to grow more quickly than their larger counterparts. There is simply less competition and more room to grow when your market capitalization is, say, $1 billion when compared to mega-cap stocks with market caps above $200 billion.

Secondly, many small-cap securities are outside the investment universes of some larger institutional investment managers. This creates less demand for shares, which reduces their prices and creates better buying opportunities.

For this reason, there are typically more mispriced investment opportunities in a small-cap index like the Russell 2000 than a large-cap stock index like the S&P 500.

Investors with a value orientation should keep this in mind when searching for their next purchase opportunity.

Russell 2000 Monthly Performance

The Russell 2000 ETF (IWM) generated negative total returns of -8.3% in February 2025. IWM under-performed the S&P 500 ETF (SPY), which generated negative total returns of -1.3% last month.

While the evidence points towards small-cap stocks outperforming over the long run, that has not been the case over the last decade when comparing IWM to SPY.

Over past 10 years, the S&P 500 ETF generated annualized total returns of 12.70% per year, versus 6.87% annual total returns for the Russell 2000 ETF.

This is a counter-intuitive finding, as many investors would expect small-cap stocks to outperform large-caps in a bull market.

We believe the extremely strong performance of large technology companies over the last decade is at least partially responsible for the superior performance of the large-cap S&P 500 relative to small caps over that time frame.

Final Thoughts & Further Reading

The Russell 2000 Index List is an excellent place to look for small-cap investment opportunities. However, it is not the only place where excellent investments can be found.

If you’re looking for exposure to stable large-cap stocks with solid dividend growth prospects, the following databases will prove more useful than the Russell 2000 Index List:

Thanks for reading this article. Please send any feedback, corrections, or questions to [email protected].


Source link

Beyond the Ups and Downs: Building Wealth in a Volatile Stock Market


Editor’s note: “Beyond the Ups and Downs: Building Wealth in a Volatile Stock Market” was previously published in February 2025 with the title, “How to Find Success in Today’s Volatile Stock Market.” It has since been updated to include the most relevant information available.

Another day, another crazy roller-coaster ride for the stock market…

This has been the trend since Halloween. 

That is, in November, the S&P 500 rose 5.73%, achieving one of its best months in a year on optimism about potential deregulation and tax cuts under the Trump administration.

Then, as investors began to fear that the U.S. Federal Reserve wouldn’t cut interest rates anymore, stocks crashed 2.5% in December. It turned out to be one of their worst months in a year. 

As we moved into 2025, stocks rebounded throughout January and early February thanks to renewed economic optimism… 

But they’ve since crashed over the past few weeks as uncertainty about tariffs, federal spending cuts, and an economic slowdown weighs heavy on Wall Street. Indeed, since Feb. 10, the S&P has slid more than 6%. 

Stocks have swung violently higher and lower many times over the past several months, all for the S&P 500 and the Nasdaq to be basically flat.

Is this intense volatility Wall Street’s ‘new normal’?

It may be… 

A Bumpy Ride Higher?

Don’t get me wrong; I still think stocks are going higher in 2025. 

Despite renewed concerns about inflation and a consumer spending slowdown, the economy still appears to be on stable footing. It should benefit from deregulation and maybe even tax cuts over the next few months. Plus, the AI Boom remains alive and well, which should continue to create growth through the economy. 

Additionally, the fourth-quarter earnings season has come to an end; and broadly speaking, it was a strong one. 

As FactSet reported, “nine of the eleven sectors are reporting year-over-year earnings growth for Q4. Six of these nine sectors are reporting double-digit growth: Financials, Communication Services, Consumer Discretionary, Information Technology, Health Care, and Utilities.”

Meanwhile, the blended earnings growth rate is nearly 17%, which marks the index’s highest profit growth rate since 2021.

And trends are expected to stay strong for the foreseeable future. That is, next quarter, earnings are projected to rise about 8%, then another 9% in Q2. They are expected to rise almost 15% in the third quarter and about 13% in the fourth.

In other words, corporate earnings should keep rising for the rest of the year. Stock prices should follow suit. 

However… I don’t think it’ll be a smooth ride higher…  

Largely because of U.S. President Donald Trump.


Source link

The Top 5 Canadian Bank Stocks, Ranked In Order


Updated on March 10th, 2025 by Bob Ciura

The largest Canadian bank stocks have proven over the past decade that they not only endure recessions, but that they can grow at high rates coming out of a recession as well.

Canadian bank stocks also pay higher dividends than many U.S. bank stocks, making them potentially more appealing for income investors.

Valuations have also remained quite low recently, boosting their respective total return profiles as a result.

In this article, we’ll take a look at the “Big 5” Canadian banks – Canadian Imperial Bank of Commerce (CM), Royal Bank of Canada (RY), The Bank of Nova Scotia (BNS), Bank of Montreal (BMO) and Toronto-Dominion Bank (TD) – and rank them in order of highest expected returns.

Note: Canada imposes a 15% dividend withholding tax on U.S. investors. In many cases, investing in Canadian stocks through a U.S. retirement account waives the dividend withholding tax from Canada, but check with your tax preparer or accountant for more on this issue.

The top 5 big banks in Canada are very shareholder-friendly, with attractive cash returns. With this in mind, we created a full list of financial stocks.

You can download the entire list of ~210 financial sector stocks (along with important financial metrics like dividend yields and price-to-earnings ratios) by clicking the link below:


More information can be found in the Sure Analysis Research Database, which ranks stocks based on their dividend yield, earnings-per-share growth potential, and changes in the valuation multiple.

The stocks are listed in order below, with #1 being the most attractive for investors today.

Read on to see which Canadian bank is ranked highest in our Sure Analysis Research Database.

Table Of Contents

You can use the following table of contents to instantly jump to a specific stock:

The top 5 Canadian bank stocks are ranked based on total expected returns over the next five years, from lowest to highest.

Canadian Bank Stock #5: Canadian Imperial Bank of Commerce (CM)

  • 5-year expected returns: 8.4%

Canadian Imperial Bank of Commerce is a global financial institution that provides banking and other financial services to individuals, small businesses, corporations, and institutional clients. CIBC was founded in 1961 and is headquartered in Toronto, Canada.

In addition to trading on the New York Stock Exchange, CM stock trades on the Toronto Stock Exchange, as do the other stocks in this article.

You can download a full list of all TSX 60 stocks below:


CIBC reported its fiscal Q4 and full-year 2024 earnings results on 12/05/24. For the quarter, the bank’s revenue climbed 13% year over year (“YOY”) to C$6.6 billion. Provision for credit losses (“PCL”) was C$419 million, down 23% from a year ago.

Naturally, the loan loss ratio was 0.30%, down from 0.35% a year ago. And net income came in C$1.9 billion (up 27%). Adjusted net income came in 24% higher at C$1.9 billion.

Ultimately, adjusted earnings per share (“EPS”) rose 22% to C$1.91. The adjusted return on equity was 13.4%, down from 14.0% a year ago.

The bank’s capital position remains solid with a Common Equity Tier 1 ratio of 13.3%, same as a year ago. CIBC raised its quarterly dividend by 7.8% to C$0.97 per share, equating an annual payout of $3.88 per share.

Click here to download our most recent Sure Analysis report on CM (preview of page 1 of 3 shown below):

Canadian Bank Stock #4: Bank of Montreal (BMO)

  • 5-year expected annual returns: 8.0%

Bank of Montreal was formed in 1817, becoming Canada’s first bank. The past two centuries have seen Bank of Montreal grow into a global powerhouse of financial services and today, it has about 2,000 branches (including Bank of the West branches) in North America.

It generates about 45% of earnings from the U.S. (including Bank of the West) and the rest primarily from Canada. Bank of Montreal generates about 64% of its adjusted revenue from Canada and about 36% from the U.S.

Bank of Montreal reported its fiscal Q4 and full-year 2024 financial results on 12/05/24. For the quarter, compared to a year ago, revenue rose 7.7% to C$9.0 billion, while net income climbed 35% to C$2.3 billion and diluted earnings per share (“EPS”) rose 34% to C$2.94.

This jump in earnings was primarily due to the reversal of a fiscal 2022 legal provision related to a lawsuit associated with a predecessor bank.

Adjusted net income fell 31% to C$1.5 billion and adjusted diluted EPS fell 35% to C$1.90. Higher adjusted provision for credit losses (“PCL”) of C$1.5 billion (versus C$446 million a year ago) weighed on earnings.

Click here to download our most recent Sure Analysis report on BMO (preview of page 1 of 3 shown below):

Canadian Bank Stock #3: Royal Bank of Canada (RY)

  • 5-year expected returns: 8.6%

The Royal Bank of Canada is the largest bank in Canada by market capitalization, and by total assets. RBC offers banking and financial services to customers primarily in Canada and the U.S.

The financial institution operates in four core business units: Personal & Commercial Banking (39% of FY2023 revenue), Wealth Management (31%), Insurance (10%), and Capital Markets (20%). Its revenue mix is roughly 59% Canada, 25% the U.S., and 16% international.

On 12/04/24, RBC reported solid fiscal Q4 and full-year 2024 earnings results. Compared to the prior year’s quarter, the bank reported revenue growth of 19% to C$15.1 billion. Management put aside a reserve of C$840 million in the form of provision for credit losses (“PCL”) that dragged down net income. The PCL was 17% higher than a year ago.

Additionally, non-interest expense rose 12% to $9.0 billion. Net income rose 7.2% year over year (“YOY”) to C$4.2 billion; on a per share basis, it rose 5.4% to C$2.91.

Adjusted net income was 18% higher at C$4.4 billion, and its adjusted diluted earnings-per-share (“EPS”) was C$3.07 (up 16%). The bank’s capital position was still solid with a Common Equity Tier 1 ratio at 13.2%, down from 14.5% a year ago.

The bank raised its quarterly dividend by 4.2% to C$1.48 per share, equating to an annualized payout of C$5.92 per share.

Click here to download our most recent Sure Analysis report on RY (preview of page 1 of 3 shown below):

Canadian Bank Stock #2: Toronto-Dominion Bank (TD)

  • 5-year expected annual returns: 10.1%

Toronto-Dominion Bank traces its lineage back to 1855 when the Bank of Toronto was founded. It is now a major bank with C$1.9 trillion in assets. The bank produces about C$14 billion in annual net income each year.

TD reported fiscal Q4 and full-year 2024 earnings results on December 5th, 2024. For the quarter, TD reported revenue growth of 18% year-over-year to C$15.5 billion. Provision for credit losses (“PCL”) rose 26% to C$1.1 billion.

However, net income still climbed 27% to C$3.6 billion. The adjusted metrics likely provide a better picture of TD’s normal earnings power.

The adjusted revenue climbed 12% to C$14.9 billion, and the adjusted net income fell 8% to C$3.2 billion, leading to adjusted diluted earnings per share (“EPS”) of C$1.72, down 5.5% year over year. Its PCL ratio as a percentage of average net loans and acceptances was 0.47%, up 8 basis points from a year ago.

The adjusted return on equity (“ROE”) was 13.4%, up from 10.5% a year ago. The bank’s capital position remained solid with a common equity tier 1 ratio of 13.1%, down from 14.4% a year ago.

Click here to download our most recent Sure Analysis report on TD (preview of page 1 of 3 shown below):

Canadian Bank Stock #1: Bank of Nova Scotia (BNS)

  • 5-year expected annual returns: 12.2%

Bank of Nova Scotia (often called Scotiabank) is the fourth-largest financial institution in Canada behind the Royal Bank of Canada, the Toronto-Dominion Bank and Bank of Montreal.

Scotiabank reports in four core business segments – Canadian Banking, International Banking, Global Wealth Management, and Global Banking & Markets.

Scotiabank reported fiscal Q4 and full-year 2024 results on 12/03/24. For the quarter, revenue rose 3.1% to C$8.5 billion, while non-interest expenses fell 4.2% to C$5.3 billion. Provision for credit losses (“PCL”) declined by 18% year over year (“YOY”) to C$1.0 billion, weighing less on earnings compared to a year ago.

As a result, net income rose 25% to C$1.7 billion and diluted earnings per share (“EPS”) rose 23% to C$1.22. The bank’s PCL as a percentage of average net loans & acceptances was 0.54%, down from 0.65% a year ago, whereas the PCL on impaired loans as a percentage of average net loans & acceptances was 0.55%, up from 0.42% a year ago.

The fiscal year saw revenue rising 4.5% to C$33.7 billion. Non-interest expenses increased by 3.0% to C$19.7 billion, while PCL rose 18% to C$4.1 billion.

The PCL as a percentage of average net loans & acceptances was 0.53%, up from 0.44% a year ago, whereas the PCL on impaired loans as a percentage of average net loans & acceptances was 0.46%, up from 0.32% a year ago.

Click here to download our most recent Sure Analysis report on BNS (preview of page 1 of 3 shown below):

Final Thoughts

Canadian bank stocks do not get nearly as much coverage as the major U.S. banks. However, income and value investors should pay attention to the big 5 Canadian bank stocks.

Royal Bank of Canada, TD Bank, Bank of Nova Scotia, Bank of Montreal, and Canadian Imperial Bank of Commerce are all highly profitable banks.

And, all 5 have reasonable valuations with dividend yields that are well above the U.S. bank stocks.

The following articles contain stocks with very long dividend or corporate histories, ripe for selection for dividend growth investors:

Thanks for reading this article. Please send any feedback, corrections, or questions to [email protected].


Source link

Weekly Stock Grader Analysis: Upgrades & Downgrades on Top Blue-Chip Stocks


Are your holdings on the move? See my updated ratings for 159 stocks.

Weekly Stock Grader Analysis: Upgrades & Downgrades on Top Blue-Chip Stocks

Source: iQoncept/Shutterstock.com

During these busy times, it pays to stay on top of the latest profit opportunities. And today’s blog post should be a great place to start. After taking a close look at the latest data on institutional buying pressure and each company’s fundamental health, I decided to revise my Stock Grader recommendations for 159 big blue chips. Chances are that you have at least one of these stocks in your portfolio, so you may want to give this list a skim and act accordingly.


Article printed from InvestorPlace Media, https://investorplace.com/market360/2025/03/20250310-blue-chip-upgrades-downgrades/.

©2025 InvestorPlace Media, LLC


Source link

Consolidation after a momentous week – United States


Written by the Market Insights Team

Bank of Canada on the spotlight

Kevin Ford –FX & Macro Strategist

Last Friday provided fresh insights into the state of the labor markets in both the U.S. and Canada as of the end of February.

In the U.S., while the jobs report was close to expectations (151K jobs created versus the 160K forecast), the market was positioned on the softer side. A few cracks in the labor market added to the U.S. growth scare, prompting another day of sell-off in American stocks, which have significantly underperformed European and global equities year to date. Unemployment inched up to 4.1% from 4% in the previous month, and January’s payroll data was revised downward. Also notably, federal government employment declined by 10K in February. As highlighted in the previous Daily Market Update, there has been speculation that payroll data might eventually reflect the impact of DOGE’s federal employee layoffs. These effects are more likely to appear in the March payroll figures, due next month.

In Canada, the labor market report was notably weaker than expected. Employment increased by just 1.1K jobs in February, significantly below the anticipated 20K gain. This underperformance came as a surprise, given the strong momentum seen in previous months when 211K positions were added between November and January. On a positive note, unemployment edged down to 6.6% from 6.7% in the prior month, offering a modest silver lining amid the disappointing data.

For both the U.S. and Canada, next month’s job reports will likely shed light on the markets’ responses to tariff threats, ongoing uncertainty, and their implementation throughout February and March.

Now, after the disappointing job report in Canada, the aggregate data released in February along with tariffs uncertainty, the probability of a 25-bps cut by the Bank of Canada this coming Wednesday has increased to 87%. Also, this Wednesday the market will be expecting US February CPI data, where the core rate is expected to remain sticky at 0.3% MoM.

FX markets might see some consolidation, after a very volatile week focused on EUR and GBP upside movements and US dollar softness.

Chart: USD/CAD driven by Fed-BoC March meeting expectations

No Trump put to hope for?

Boris Kovacevic – Global Macro Strategist

The US dollar experienced its largest weekly decline since 2022, driven by a combination of tariff uncertainty, weaker economic data, and rising optimism in European markets following Germany’s historic debt announcement.

On Friday, the US labor market showed signs of softening, with nonfarm payrolls increasing by 151k, falling short of the 160k consensus estimate. While the deviation was not drastic, it added to broader concerns of an economic slowdown. At the same time, President Trump’s decision to postpone tariffs on Canada and Mexico failed to reassure investors, as markets continue to prioritize stability over short-term adjustments.

Investor sentiment toward the US economy has also been tempered by growing recognition that Trump’s second term may not deliver the economic boom some had anticipated. Both the President and Treasury Secretary Bessent emphasized the need for structural reforms, acknowledging that markets and the economy could face turbulence as the administration undertakes an overhaul of government policies. Government spending and employment have become bloated, according to Bessent, and a drawdown in both is needed. Investors will need to come to terms with the fact that there might be no “Trump put” in the end.

US equities ended the week lower, reflecting these concerns, though Federal Reserve Chair Jerome Powell provided a temporary boost on Friday. Powell reassured markets that the economy remains on solid footing and that he is not overly concerned about current conditions. However, his remarks failed to stem the dollar’s continued decline, which extended into the weekend.

While the dollar’s fall is primarily market-driven, history suggests that Trump’s favorability ratings tend to follow a similar trajectory. A strong dollar has often coincided with confidence in his economic policies, while periods of weakness—such as now—signal increasing investor skepticism. This isn’t to say that the dollar dictates poll numbers, but both serve as indicators of market and public sentiment. If the greenback’s slump reflects eroding trust in Trump’s economic agenda, could his approval ratings be next in line for a drop? With trade tensions rising and investors reassessing his second-term outlook, it’s a risk worth watching.

Looking ahead, investors will closely monitor economic data and policy developments, as uncertainty around trade, fiscal reforms, and monetary policy continues to shape market dynamics. The US inflation release will be a key event to watch this week.

Chart: Falling dollar does not bode well for Trump's favorability

Betting on Europe again

Boris Kovacevic – Global Macro Strategist

The euro strengthened last week, benefiting from broad dollar weakness, a shift in investor sentiment, and renewed fiscal optimism in Europe. Germany’s historic debt issuance announcement fueled expectations of stronger growth, while the European Central Bank’s quarter-point rate cut on Thursday was offset by a more cautious policy outlook.

On Saturday, ECB Executive Board member Isabel Schnabel warned that inflation in the Eurozone is more likely to remain above the 2% target for an extended period than to decline sustainably below it. Her remarks suggest growing resistance within the ECB to further rate cuts in the near term. Schnabel’s comments come as policymakers prepare for a pivotal April decision, with divisions emerging over how much further monetary easing is warranted. Meanwhile, Europe’s economic outlook continues to evolve as governments prepare to deploy hundreds of billions of euros in defense and infrastructure spending, particularly in Germany.

The euro saw strong gains last week, rallying 4.4% against the dollar. It was the largest advance since 2009, the year the German debt break had been introduced. However, the currency faced some resistance near $1.0850, as traders reassessed the implications of a hawkish ECB amid an improving economic outlook. Looking ahead, market participants will closely monitor Eurozone inflation data and ECB communications for further clues on monetary policy. With the bloc’s cyclical recovery gaining momentum and inflation risks still elevated, expectations of additional ECB easing are becoming increasingly uncertain.

Chart: Euro almost back in line with bond market volatility

Pound’s mixed fortunes

George Vessey – Lead FX & Macro Strategist

The pound has been caught in the crossfire of late, weakening against the euro, but strengthening against the US dollar. On the latter, due to US growth scares, more Fed easing being priced in has boosted UK-US rate differentials in the pound’s favour. GBP/USD surged 2.7% last week and above key moving average resistance levels, opening the door to a test of the $1.30 handle in the near-term. The daily chart is flashing overbought though, which suggests a correction lower, or period of consolidation is looming, but from a valuation perspective, GBP/USD is still 4% below its 10-year average of $1.35.

Against the euro though, given the huge spending plans from Europe, the pound suffered its worst week in two years, falling 1.6% before fading around its 50-week moving average, which has supported for over a year now. However, if GBP/EUR struggles to reclaim its 200-day moving average at €1.1929, then more downside could be in the offing, especially as the fiscal divergence between the UK and Eurozone could prove more euro positive due to growth differentials. However, a consolidation in the UK’s fiscal outlook should limit the downside risk in sterling, whilst near-term monetary policies and sterling’s carry advantage due to higher UK yields remains pound positive.

In the spotlight from the UK this week, we have monthly GDP data. The UK economy has been on a fragile footing since the second half of 2024, and January’s GDP should confirm a slowing in momentum from 0.4% m/m to 0.1%. However, the three-month average is expected to pick up from 0.0% to 0.2%. Unless we see any major deviation from the consensus, the data is unlikely to move the needle on Bank of England policy expectations.

Chart: Reverses sharply from technical resistance

EUR/USD up 3.3% in last seven days

Table: 7-day currency trends and trading ranges

Table: 7-day currency trends and trading ranges.

Key global risk events

Calendar: March 10-14

Table: Key global risk events calendar

All times are in ET

Have a question? [email protected]

*The FX rates published are provided by Convera’s Market Insights team for research purposes only. The rates have a unique source and may not align to any live exchange rates quoted on other sites. They are not an indication of actual buy/sell rates, or a financial offer.


Source link