US-Canada trade war intensifies – United States


Written by the Market Insights Team

Half a day twists and turns

Kevin Ford –FX & Macro Strategist

Yesterday, the USD/CAD experienced significant intraday volatility due to escalating trade tensions initiated by President Trump and subsequent de-escalation by Ontario Premier Doug Ford. Initially, Trump raised tariffs to 50% on all aluminum and steel imports from Canada, following Ford’s refusal to withdraw a 25% electricity tariff on US exports. This tariff particularly would have impacted electricity sales to 1.5 million homes and businesses across Michigan, Minnesota, and New York. Later, Ford announced on social media that the 25% electricity surcharge would be scrapped.

Despite this half a day trade war spat, uncertainty lingers over the tariff situation. Markets are awaiting confirmation on whether steel and aluminum tariffs will be postponed, and/or if some countries will be exempted, especially given President Trump’s recurring tariff pattern of impose and delay. For now, the 25% tariffs on steel and aluminum are in effect as of today. Aluminum and steel, critical materials, have far-reaching economic implications. With US industry capacity exceeding 75% for both metals and heavy reliance on Canadian imports, (imports made up 23% of the U.S. steel market in 2024 and 44% of U.S. aluminum market, and half of those imports coming from Canada), tariff hikes are likely to drive up prices and the impact might be felt beyond aluminum and steel. Tariffs ripple through supply chains, increasing costs across various industries and items such as housing, household appliances, construction equipment, farm machinery, batteries, and vehicles, as many specialty steel products for the automotive industry are unavailable domestically. Also, increasing internal capacity would take years for some companies. If history serves as an example, during 2018, when then President Trump imposed 25% steel and aluminum tariffs, metal prices increased and there was little sector job creation during the time.

The USD/CAD has attempted to break above the 1.454 level four times in the past six days without success. Prices holding above 1.447 signal CAD bearishness, shifting risks to the upside. The coming days will be crucial in assessing whether Trump proceeds with metals tariffs. Also, today we’ll see how markets respond to the US CPI data, the BoC’s rate decision and Governor Tiff Macklem press conference. As mentioned previously, US CPI is expected to come at 2.9% YoY and markets are expecting BoC to cut rates 25 bps to 2.75%.

Chart: U.S. Steel and Aluminum capacity takes year to grow, and expansion space is limited.

Dollar not profiting from tariff angst

Boris Kovacevic – Global Macro Strategist

The US dollar fell against most major currencies yesterday, despite another wave of risk aversion gripping global markets. Traditionally, escalating trade tensions would drive demand for the dollar as a safe-haven asset, but investors are now looking beyond short-term flows and focusing on the economic damage these tariffs could inflict. The market reaction suggests that concerns over weaker US growth and corporate profitability are beginning to outweigh the immediate defensive bid for the dollar. The Greenback has fallen for seven consecutive days and is down 6.5% from its 2025 peak.

President Trump’s latest tariff escalation has further rattled financial markets. Just days after imposing broad duties on Canadian and Mexican imports, Trump announced he would double planned steel and aluminum tariffs on Canada to 50% in response to Ontario’s tax hike on electricity exports. This move has sent shockwaves through equities, with the S&P 500 extending its three-week decline to nearly 10%, while Wall Street’s fear gauge (VIX) surged toward its highest level since last August. The Canadian dollar tumbled to a weekly low, highlighting the over proportional impact of trade tensions on American (North & Central) currencies.

Beyond tariffs, yesterday’s macro data reinforced mixed signals about the US economy. The NFIB Small Business Optimism Index fell to 100.7, its weakest level since October 2024, as uncertainty among business owners surged to near-record highs. Small firms are growing increasingly concerned about inflation and labor quality, while their confidence in future economic conditions has deteriorated sharply. At the same time, however, the JOLTS report showed job openings climbing to 7.74 million, suggesting that labor demand remains resilient in key sectors like retail, finance, and healthcare.

Looking ahead, the focus remains on US inflation data, central bank commentary, and geopolitical risks. The dollar’s recent weakness could persist if trade concerns continue to weigh on economic sentiment and corporate outlooks, particularly as investors reassess the balance between short-term positioning and longer-term fundamentals.

Chart: Volatility home grown this time, leaving USD without a bid.

Euro continues its surge

Boris Kovacevic – Global Macro Strategist

The euro continued its remarkable surge against the dollar, breaking through the $1.09 barrier for the first time since Trump’s election. The currency is up more than 5.5% this month as investor sentiment shifts away from the US, weighed down by recession fears and continued trade policy uncertainty.

The latest catalyst for the euro’s rally comes from Germany, where negotiations over a historic fiscal expansion are progressing. Franziska Brantner, co-leader of the Greens, signaled a willingness to negotiate a deal on increased state borrowing to finance defence spending and economic revival. While the details remain unclear, markets welcomed the prospect of higher fiscal stimulus, which, when combined with ECB rate cuts, creates a rare case of simultaneous monetary and fiscal support for the eurozone economy.

The political backdrop in Europe is fueling this divergence between the euro and the dollar. Germany’s debt policy overhaul remains the focal point, with expectations of a spending package that could significantly raise borrowing and boost investment over the next decade. However, political hurdles remain, with the Greens still opposing broader reforms to debt rules and a €500 billion infrastructure fund. Markets will be closely watching for any deal before the weekend, as its approval could provide another leg higher for the euro.

The combination of US economic weakness, ongoing tariff uncertainty, and a growing policy divergence between the Fed and ECB is eroding confidence in the greenback. For now, euro bulls are in control, with traders looking for confirmation of a German fiscal deal and further signs that the US economy is cooling.

Chart: 5.5% monthly gain would be 4th  biggest since 2010

Look over your shoulder sterling

George Vessey – Lead FX & Macro Strategist

Since the start of 2023, GBP/USD has mostly been in positive territory, clocking up to 11% gains by September 2024. The same can’t be said for EUR/USD, which only reached 5% gains, significantly underperforming in comparison. Historically the two currency pairs have exhibited a high correlation, explained by the interconnective relationship between the euro area and UK economies. The correlation remains strong, but the euro is now playing catch up.

Aside from recent US dollar weakness driven by the fading US exceptionalism narrative, the pound has likely been dragged higher by the fiscal re-rating of Europe. But of course, it’s the euro that’s benefited most from Germany’s historic stimulus package that includes a debt-brake reform to boost spending on defence and infrastructure. After last week’s seismic shift in euro sentiment, EUR/USD now stands over 5% higher this month alone compared to GBP/USD’s less than 3% gain.

Looking back over the last two years, the pound has enjoyed a high yield advantage over many peers, supporting GBP/USD’s outperformance relative to EUR/USD. It’s also spurred GBP/EUR on to scale 2-year peaks recently. But the tables seem to be turning. The euro could be primed for a continued spell of outperformance versus its major peers like sterling as Europe’s growth outlook looks set to improve whilst German yields surge higher.

GBP/EUR is already down 2.2% this month and has broken below its 50-week moving average support level for the first time in a year, which could open the door to an extended slide towards €1.17. Moreover, whilst the strong positive correlation between EUR/USD and GBP/USD will hold, we think the euro has more scope to run higher than sterling does against the dollar.

Chart: Pound has outperformed euro for last two years

Euro dominates across the board

Table: 7-day currency trends and trading ranges

7-day currency trends and trading ranges.

Key global risk events

Calendar: March 10-14

Key global risk events calendar

All times are in ET

Have a question? [email protected]

*The FX rates published are provided by Convera’s Market Insights team for research purposes only. The rates have a unique source and may not align to any live exchange rates quoted on other sites. They are not an indication of actual buy/sell rates, or a financial offer.

Source link

Intel Stock Jumps as TSMC Eyes Foundry Stake With Nvidia, Others, Report Says


KEY TAKEAWAYS

  • Shares of Intel are jumping more than 7% in premarket trading Wednesday following a report that TSMC has approached U.S. chip designers Nvidia, Advanced Micro Devices, and Broadcom about forming a joint venture to own and run the chipmaker’s foundry division.
  • According to Reuters, TSMC wouldn’t own more than 50% of the JV.
  • Intel shares have lost about 55% of their value in the past 12 months entering Wednesday.

Shares of Intel (INTC) are jumping more than 7% in premarket trading Wednesday following a report that Taiwan Semiconductor Manufacturing Company (TSM) has approached U.S. chip designers Nvidia (NVDA), Advanced Micro Devices (AMD), and Broadcom (AVGO) about forming a joint venture to own and run the U.S. chipmaker’s foundry division.

“Qualcomm (QCOM) has also been pitched by TSMC, according to one of the sources and a separate source,” said the report, which cited “four sources familiar with the matter.”

According to Reuters, TSMC, the world’s largest contract chipmaker, has floated running the foundry division, which makes custom chips for other companies. The report, which noted that the talks are at an early stage, said TSMC wouldn’t own more than 50% of the JV. 

Reuters added that the Trump administration has asked TSMC for help in turning around Intel. Intel’s foundry business has been in the spotlight as a potential beneficiary of the Trump administration’s stated goal of ensuring artificial intelligence chips are designed and manufactured domestically.

Intel, TSMC, Nvidia, AMD, Broadcom, and Qualcomm didn’t immediately respond to Investopedia requests for comment.

Intel shares have lost about 55% of their value in the past 12 months entering Wednesday.


Source link

What to Do When the Stock Market Drops – InvestorPlace


When the stock market goes through a big drop and your portfolio’s value is going lower and lower, it can be difficult to know what to do.

It’s an emotional time and mistakes are common when we are feeling pressure.

What about my retirement?

My kid’s college education?

My dreams of financial independence?

Well, when the market takes a nosedive there are some things you should do, and also some things you absolutely, positively SHOULD NOT do.

And we can learn a lot by looking at one of the biggest business stories of the past 100 years…

Amazon.

If you were asked to name some of the biggest stock market winners of the past century, there’s a good chance Amazon would come to mind.

After all, Amazon has gone from a small online bookseller to one of the world’s largest, most powerful companies. In 2020, the company’s market value reached a massive $1 trillion.

Amazon now sells virtually everything… and its founder, Jeff Bezos, is one of the world’s richest men.

As result, Amazon’s shareholders have enjoyed one heck of a ride…

Amazon’s market value has increased more than 120,000% since its IPO in 1997. That kind of gain turns every $10,000 invested into a stunning $12 million.

You probably also know why Amazon achieved such huge success. Its Prime membership program was a big hit. Its mastery of logistics lowered the price of almost everything. Its cloud computing business generated billions of dollars in annual revenue.

What you probably don’t know is what the Dow Jones Industrial Average did on March 4, 2015… or what the Dow did on October 18, 2013… or what the Dow did on ANY specific day of Amazon’s incredible rise.

You also probably don’t know what mortgage rates were on December 12, 2003… or where the Federal Reserve had short-term interest rates set at on July 27, 2011.

That’s because what the stock market and interest rates were doing on those days didn’t amount to a hill of beans compared to what Amazon’s business was doing.

Recessions, bear markets, and stock market corrections made a lot of headlines but proved to be tiny speedbumps on Amazon’s path to success.

What the market did or what made headline news on any specific day is meaningless compared to the power of Amazon’s business model, the massive online shopping trend it rode to success, and the moves its management made.

What really mattered to Amazon shareholders wasn’t the broad market, interest rates, or presidential elections. What really mattered was that Amazon constantly innovated, delivered value to its customers, and outperformed its competition.

The same goes for every innovative, successful company you can think of: Apple. Disney. Starbucks. Google. Tesla. Visa. Home Depot. Nike. Chipotle. Netflix. Hershey. Microsoft. McDonalds. Costco. Airbnb. Lululemon. The list goes on and on and on.

What interest rates or the stock market did during the ascent of these companies didn’t matter at all. Even recessions, bear markets, and stock crashes didn’t matter. Who was president didn’t matter.

What mattered was innovation, massive industry trends, delivering value to customers, and smart business models.

Here’s why this is so important to you as an investor…

If you invest in stocks for the long-term, you are guaranteed to live through bear markets, recessions, and corrections.

These declines – even if they are in the modest 15% range – will scare you.

They will make you question the idea of owning stocks.

If you invest in stocks for the long-term, you’re sure to come across tons of “bearish” news and predictions.

There’s a whole industry of journalists and financial analysts who constantly predict the fall of America, runaway inflation, the next Great Depression, and a host of other calamities.

These folks are born pessimists. No amount of positive things can shake them from thinking things are about to go to hell in a handbasket soon.

And you know what?

We listen to them!

Humans are hardwired to pay close attention to potential dangers.

A hundred thousand years ago, it’s how we survived. Constantly worrying that a tiger or bear could be around the corner was a valuable instinct.

These days, we don’t have much to fear from bears or tigers.

However, our instincts make us pay close attention to potential dangers… both real and imagined. So, our subconscious minds compel us to click on bearish headlines, fixate on disasters, worry about elections, buy magazines with gloomy forecasts on their covers, and fret over 15% stock market corrections.

Or as media insiders like to say, “Fear sells” and, “If it bleeds, it leads.”

I encourage you to let common sense and the facts shape your actions instead of leaving it up to caveman thinking.

You’ll be far more successful investor if you do.

Why do I say that? And what are the facts?

Well, just consider that the stock market has averaged a positive annual return of 10% for the past 100 years. This is because the trend of increasing prosperity that is powered by free markets and free enterprise is one of the strongest trends in human history.

And here’s another important fact…

During the 20th century, stocks appreciated in value by 1,500,000%.

A 1,500,000% return turns every $100 invested into $1.5 million.

But wait…

Wasn’t the 20th century filled with wars and recessions and other awful things?

Yes.

There were two huge world wars, which killed tens of millions of people and devastated large portions of the world.

You also had the Great Depression… the Korean War… the Cuban Missile Crisis… the Watergate scandal … the inflation of the 1970s… the Arab oil embargo… the Vietnam War… and the savings and loan crisis of the 1990s.

You also had more than a dozen recessions and five horrible bear markets.

Despite all these horrible things, U.S. stocks appreciated in value by 1,500,000% during the 20th century.

Despite something bad happening every decade, incredible wealth was created by innovative businesses like Coca-Cola, Ford Motor, Apple, Hershey, Intel, Disney, General Electric, McDonald’s, Proctor & Gamble, Wrigley, Tootsie Roll, Pfizer, Microsoft, Walmart, Starbucks, and thousands of others.

We all know there are problems in America… like debt, poverty, and inequality.

These topics are covered daily in the news. They are the subjects of best-selling books. They have many people paralyzed by fear.

But if you know your history and know how powerful American innovation is, you know this is no cause to sell your stocks and crawl into a hole.

You know that for every ONE problem in America, there are THOUSANDS of brilliant people working on innovative solutions. They are developing amazing products and services that will make our lives better.

These are the types of people who invented the light bulb… the television… the pacemaker… the airplane… and the iPhone.

They are people who have the brains and worth ethic to create incredible businesses like Starbucks, Facebook, Amazon, Whole Foods, Apple, Nike, and Google.

These companies have provided good jobs to millions of people… they provided goods and services to thankful customers… and they produced hundreds of billions of dollars in wealth for their shareholders. All by creating and innovating.

Even better, these kinds of folks work in America. Despite what some Debbie Downers like to say, the legendary investor Warren Buffett is right: America is still the greatest place in the world to do business.

We have deep and liquid capital markets.

We have rule of law.

We have excellent accounting standards, which creates transparency.

We encourage and foster innovation.

We respect property rights.

We have an excellent transportation network (if you’ve fallen for the myth that U.S. infrastructure is terrible, I urge you to visit a third world country for comparison).

We have a huge population of well-to-do consumers ready to buy great products and services.

The advances made by American entrepreneurs allow today’s average American to live better than a king did 100 years ago.

Even people in America’s “low income” bracket have better medical care, better food, better transportation, and better access to information than anyone did in 1919, no matter what their level of wealth.

In other words, free markets, innovation, and productive enterprise has allowed mankind to achieve incredible progress despite wars, recessions, and bear markets.

It’s been that way for centuries… and it will continue to be that way in the future.

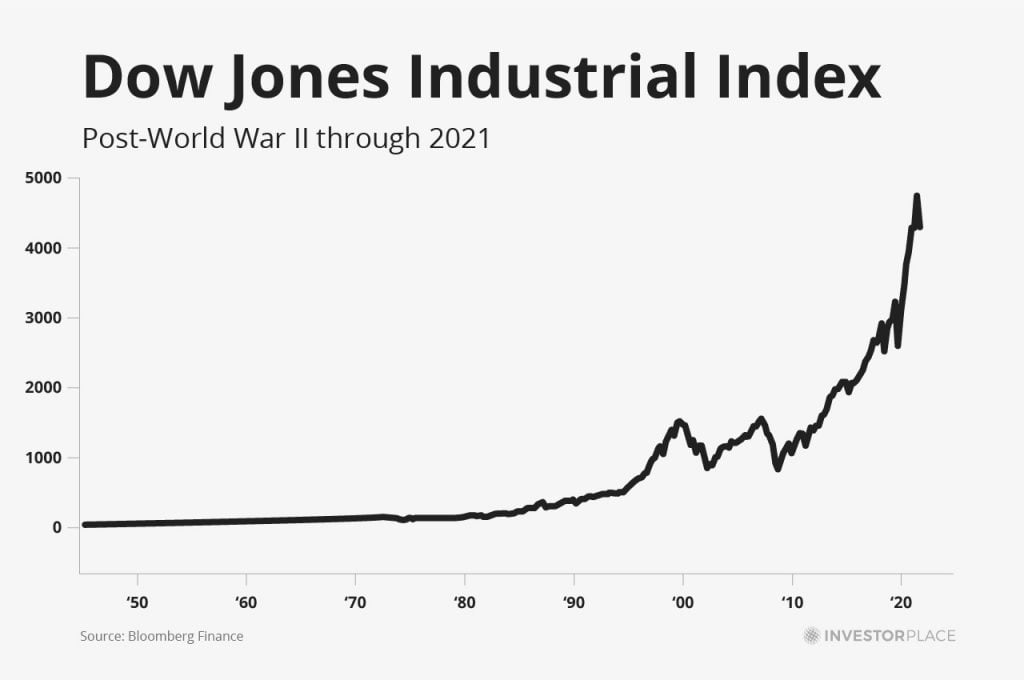
Below is a chart of the Dow Jones Industrial Index from post-World War II through 2021

DJI - Post World War IIDJI - Post World War II

Incredible, right?

The stock market declines of 1987, 2000, and 2008 – while painful at the time – are just speed bumps on the long-term chart. And the takeaway is clear: Over time, American prosperity rises and the stock market goes up.

With this picture in mind, my advice is to “make the trend your friend” and ignore the naysayers. Don’t panic over a market correction and don’t let the fear-stoking headline of the hour scare you out of your holdings of high-quality innovative companies that are poised to change the world.

During stock market corrections, I ask you to focus on what really matters: progress, transformational industry trends, creating value for others, and innovation.

Remember that despite all the negative occurrences of the past 100 years, shareholders of innovative companies that serve their customers have made fortunes.

It’s been the surest way to get rich in America for more than 100 years. It will be that way for at least 100 more. That’s why staying bullish on human progress and innovation is at the foundation of what we do at InvestorPlace.

It’s also why, when our subscribers write in to ask if we have “bear market survival” plans, we send them this essay.

Our “bear market survival” plan consists of reviewing the facts above, thinking long-term, and looking to buy high-quality stocks at discount prices.

Our “bear market survival” plan does not consist of selling stocks in a panic.

I believe that when an investor can “deprogram” themselves from obsessing over “the market” and interest rates – and instead focus on the things above – the things that history has shown really matter – that investor ascends to a higher level of understanding when it comes to money and investing.

It’s one of the most important milestones on the journey to mastering money.

The Next Time You’re Tempted to Panic, Look at These Eight Charts

Since 1928, there have been 26 bear markets in the benchmark S&P 500 stock index. After each and every one of them, stocks went on to reach all time highs. The track record here is perfect.

Recent history has eight outstanding examples of why a smart “bear market strategy” consists of keeping the facts in mind, thinking long term, and not getting scared out of stocks.

We like to think these eight charts are an antidote to a harmful financial disease we call “Short-Term-itis.”

For example, during the famed 1987 “Black Monday” crash, the stock market dropped 33.5% in a single day. It caused a short-term global financial panic.

However, less than two years later, the stock market reached an all-time high.

After the 1987 Black Monday crash, stocks reached an all-time highAfter the 1987 Black Monday crash, stocks reached an all-time high

Then you have the big stock market decline of 1990, which was created by worries over a U.S. recession and the Gulf War. Stocks fell 19.9% during this decline. However, stock recovered and hit a new all-time high less than a year later.

After the 1990 decline, stocks reached an all-time highAfter the 1990 decline, stocks reached an all-time high

Then you have the big 1998 market decline. Stocks fell 19.3% over the span of a few months. Stocks quickly recovered and reached a new all-time high by early 1999.

After the big 1998 drop, stocks reached an all-time high After the big 1998 drop, stocks reached an all-time high

Then you have the 2000-2002 bear market. This crash came after the dot.com reached its frenzied peak in March 2000. Although this was one of the worst market downturns in U.S. history, stocks went on to recover and reach new all-time highs in 2007.

After the tech crash of 2000, stocks reached an all-time highAfter the tech crash of 2000, stocks reached an all-time high

Next you have the stock bear market that accompanied the Great Financial Crisis of 2008. Stocks fell an incredible 56% during the decline. However, stocks went on to recover and entered a historic bull market that lasted a decade. Fortunes were made during the recovery and the market reached a new all-time high in 2013.

After the Great Financial Crisis of 2008, stocks reached an all-time highAfter the Great Financial Crisis of 2008, stocks reached an all-time high

In the midst of the decade-long recovery that followed the 2008 crash, the market saw a decline of about 19% in late 2011. Stocks recovered and reached a new all-time high by early 2012.

After the 2011 decline, stocks reached an all-time high After the 2011 decline, stocks reached an all-time high

In 2018, the market suffered a gut-wrenching decline of 19%. But by the summer of the following year, stocks had recovered and reached another new all-time high.

After the 2018 decline, stocks reached an all-time highAfter the 2018 decline, stocks reached an all-time high

Then there is the covid-19 related stock market drop and recovery of 2020. When the world realized covid-19 was a serious worldwide problem, the market fell 53% in less than two months. However, government stimulus helped the market recover and stocks reached a new all-time high by the end of the year.

After the COVID-19 crash of 2020, stocks reached an all time highAfter the COVID-19 crash of 2020, stocks reached an all time high

Summing Up

You’ve just gone on a tour of the biggest financial disasters of the past 60 years.

You’ve reviewed the most famous, most horrible bear markets and stock crashes in history… like the Black Monday crash of 1987… the dot-com crash of 2000… and the Great Financial Crisis of 2008.

You’ve also seen the track record here is perfect. Each period of rough times was followed by all-time highs.

These recent recoveries highlight a very long trend…

Every major stock market correction, every crash, every bear market in American history has been followed by new all-time highs.

That’s why we state once again… FOR EMPHASIS…

During stock market corrections, focus on what really matters: progress, transformational industry trends, creating value for others, and innovation.

Remember that despite all the negative developments of the past 100 years, shareholders of innovative companies that serve their customers have made fortunes.

Remember that it pays to bet on America.

Remember that a wise “bear market survival” plan consists of reviewing the facts above, thinking long-term, and staying long stocks.

Regards,

signaturesignature

Brian Hunt


Source link

Trump bump flips to slump – United States


Written by the Market Insights Team

After a stellar 8% rise in 2024, boosted by the so-called “Trump trade” in the final few months, the dollar is now weaker than all of its G10 peers year-to-date. Equities have taken an abrupt turn for the worse, with some US indices suffering their biggest daily falls since 2022 and entering correction territory – defined by a 10% drawdown from their peak. It’s the US President’s ever-changing tariff policy driving uncertainty and raising recession fears that has businesses and investors on edge.

Dollar not profiting from tariff angst

Boris Kovacevic – Global Macro Strategist

The US dollar fell against most major currencies yesterday, despite another wave of risk aversion gripping global markets. Traditionally, escalating trade tensions would drive demand for the dollar as a safe-haven asset, but investors are now looking beyond short-term flows and focusing on the economic damage these tariffs could inflict. The market reaction suggests that concerns over weaker US growth and corporate profitability are beginning to outweigh the immediate defensive bid for the dollar. The Greenback has fallen for seven consecutive days and is down 6.5% from its 2025 peak.

President Trump’s latest tariff escalation has further rattled financial markets. Just days after imposing broad duties on Canadian and Mexican imports, Trump announced he would double planned steel and aluminum tariffs on Canada to 50% in response to Ontario’s tax hike on electricity exports. This move has sent shockwaves through equities, with the S&P 500 extending its three-week decline to nearly 10%, while Wall Street’s fear gauge (VIX) surged toward its highest level since last August. The Canadian dollar tumbled to a weekly low, highlighting the over proportional impact of trade tensions on American (North & Central) currencies.

Beyond tariffs, yesterday’s macro data reinforced mixed signals about the US economy. The NFIB Small Business Optimism Index fell to 100.7, its weakest level since October 2024, as uncertainty among business owners surged to near-record highs. Small firms are growing increasingly concerned about inflation and labor quality, while their confidence in future economic conditions has deteriorated sharply. At the same time, however, the JOLTS report showed job openings climbing to 7.74 million, suggesting that labor demand remains resilient in key sectors like retail, finance, and healthcare.

Looking ahead, the focus remains on US inflation data, central bank commentary, and geopolitical risks. The dollar’s recent weakness could persist if trade concerns continue to weigh on economic sentiment and corporate outlooks, particularly as investors reassess the balance between short-term positioning and longer-term fundamentals.

Chart of dollar index versus VIX index

Euro continues its surge

Boris Kovacevic – Global Macro Strategist

The euro continued its remarkable surge against the dollar, breaking through the $1.09 barrier for the first time since Trump’s election. The currency is up more than 5.5% this month as investor sentiment shifts away from the US, weighed down by recession fears and continued trade policy uncertainty.

The latest catalyst for the euro’s rally comes from Germany, where negotiations over a historic fiscal expansion are progressing. Franziska Brantner, co-leader of the Greens, signaled a willingness to negotiate a deal on increased state borrowing to finance defence spending and economic revival. While the details remain unclear, markets welcomed the prospect of higher fiscal stimulus, which, when combined with ECB rate cuts, creates a rare case of simultaneous monetary and fiscal support for the eurozone economy.

The political backdrop in Europe is fueling this divergence between the euro and the dollar. Germany’s debt policy overhaul remains the focal point, with expectations of a spending package that could significantly raise borrowing and boost investment over the next decade. However, political hurdles remain, with the Greens still opposing broader reforms to debt rules and a €500 billion infrastructure fund. Markets will be closely watching for any deal before the weekend, as its approval could provide another leg higher for the euro.

The combination of US economic weakness, ongoing tariff uncertainty, and a growing policy divergence between the Fed and ECB is eroding confidence in the greenback. For now, euro bulls are in control, with traders looking for confirmation of a German fiscal deal and further signs that the US economy is cooling.

Chart of EURUSD monthly performances

Look over your shoulder sterling

George Vessey – Lead FX & Macro Strategist

Since the start of 2023, GBP/USD has mostly been in positive territory, clocking up to 11% gains by September 2024. The same can’t be said for EUR/USD, which only reached 5% gains, significantly underperforming in comparison. Historically the two currency pairs have exhibited a high correlation, explained by the interconnective relationship between the euro area and UK economies. The correlation remains strong, but the euro is now playing catch up.

Aside from recent US dollar weakness driven by the fading US exceptionalism narrative, the pound has likely been dragged higher by the fiscal re-rating of Europe. But of course, it’s the euro that’s benefited most from Germany’s historic stimulus package that includes a debt-brake reform to boost spending on defence and infrastructure. After last week’s seismic shift in euro sentiment, EUR/USD now stands over 5% higher this month alone compared to GBP/USD’s less than 3% gain.

Looking back over the last two years, the pound has enjoyed a high yield advantage over many peers, supporting GBP/USD’s outperformance relative to EUR/USD. It’s also spurred GBP/EUR on to scale 2-year peaks recently. But the tables seem to be turning. The euro could be primed for a continued spell of outperformance versus its major peers like sterling as Europe’s growth outlook looks set to improve whilst German yields surge higher.

GBP/EUR is already down 2.2% this month and has broken below its 50-week moving average support level for the first time in a year, which could open the door to an extended slide towards €1.17. Moreover, whilst the strong positive correlation between EUR/USD and GBP/USD will hold, we think the euro has more scope to run higher than sterling does against the dollar.

Chart of EURUUSD vs GBPUSD performances since 2023

Euro dominates across the board

Table: 7-day currency trends and trading ranges

Table of FX rates

Key global risk events

Calendar: March 10-14

Table of risk events

All times are in GMT

Have a question? [email protected]

*The FX rates published are provided by Convera’s Market Insights team for research purposes only. The rates have a unique source and may not align to any live exchange rates quoted on other sites. They are not an indication of actual buy/sell rates, or a financial offer.


Source link

Dividend Aristocrats In Focus: T. Rowe Price Group


Updated on March 11th, 2025 by Nathan Parsh

Investors looking for high-quality dividend growth stocks should first consider the Dividend Aristocrats. These are an exclusive list of 69 stocks in the S&P 500 Index with 25+ years of consecutive dividend increases.

The Dividend Aristocrats are an elite group of dividend growth stocks. For this reason, we created a full list of all 69 Dividend Aristocrats.

You can download your free copy of the Dividend Aristocrats list, along with important metrics like dividend yields and price-to-earnings ratios, by clicking on the link below:


Disclaimer: Sure Dividend is not affiliated with S&P Global in any way. S&P Global owns and maintains The Dividend Aristocrats Index. The information in this article and downloadable spreadsheet is based on Sure Dividend’s own review, summary, and analysis of the S&P 500 Dividend Aristocrats ETF (NOBL) and other sources, and is meant to help individual investors better understand this ETF and the index upon which it is based. None of the information in this article or spreadsheet is official data from S&P Global. Consult S&P Global for official information.

T. Rowe Price Group (TROW) has increased its dividend for 39 years in a row, thanks to its strong brand, a highly profitable business, and future growth potential.

The stock’s dividend yield is 5.2%, which is above the ~1.3% average dividend yield of the broader S&P 500 Index. Taken together, T. Rowe Price stock possesses many of the qualities dividend growth investors typically look for.

Business Overview

T. Rowe Price, Jr., founded it in 1937. In the eight decades since, it has grown into one of the largest financial services providers in the United States. Today, the company has a market cap of ~$22 billion and impressive assets under management.

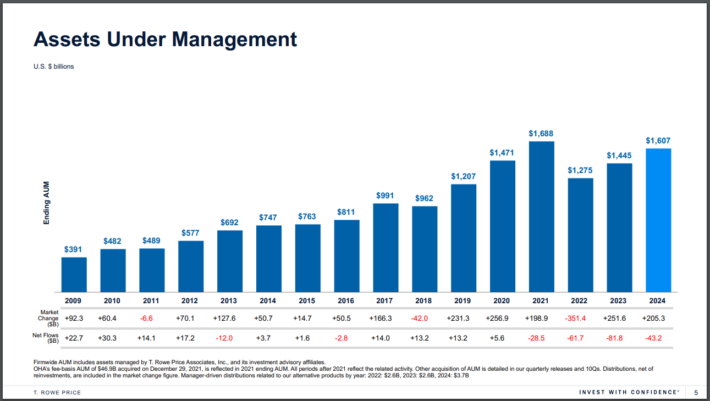
Source: Investor Presentation

T. Rowe Price ended 2024 with more than $1.6 trillion in assets under management.

The company provides mutual funds, advisory services, and separately managed accounts for individuals, institutional investors, retirement plans, and financial intermediaries. T. Rowe Price has a diverse client base in terms of assets and client type.

This is a challenging climate for asset managers. Some investors have grown weary of higher trading costs and annual fees. The onset of low-cost exchange-traded funds, or ETFs, has successfully lured client assets away from traditional mutual funds that have higher fees. This has caused brokers to lower commissions and fees to retain client assets.

However, company has strong growth potential in the years ahead.

Growth Prospects

T. Rowe Price has several catalysts for future growth. On February 5th, 2025, T. Rowe Price announced its fourth quarter and full-year results for the period ending December 31st, 2024. For the quarter, revenue increased 11% to $1.82 billion, which was $50 million below estimates. Adjusted earnings-per-share were $2.12 compared to $1.72 in the prior year, but this was $0.09 less than expected.

For the year, revenue grew 9.8% to $7.1 billion, and adjusted earnings-per-share were $9.33, compared to $7.59in 2023.

During the quarter, assets under management (AUM) of $1.639 trillion were up 19.2% year-over-year and higher by 3.1% sequentially. Market appreciation of $205.3 billion was partially offset by $43.2 billion of net client outflows. Operating expenses of $1.26 billion increased 0.1% year-over-year and grew 6.4% sequentially.

Since 2015, the company has grown earnings-per-share by an average compound rate of 8.1% annually. Moreover, the company performed well in 2020. Asset managers like T. Rowe have low variable costs. As a result, higher revenues, driven primarily by increasing assets under management, allow for margin expansion and attractive earnings growth rates.

Assets under management grow in two basic ways: increased contributions and higher underlying asset values. While asset values are finicky, the trend is upward over the long term. In addition, T. Rowe has another growth lever in the form of share repurchases. The company has shrunk its share count by an annual rate of 1.3% over the last decade.

Competitive Advantages & Recession Performance

T. Rowe Price’s competitive advantage comes from its brand recognition and expertise. The company enjoys a good reputation in the financial services industry. This helps generate fees, a significant driver of revenue. It has built this reputation through strong mutual fund performance.

T. Rowe Price considers its employees to be its most valuable assets. There is a good reason for this, It is critical for an asset management company to have qualified experts and retain top talent. This focus on building a strong brand gives the company competitive advantages, primarily the ability to keep existing clients and bring in new ones.

T. Rowe Price did not perform well during the Great Recession:

  • 2007 earnings-per-share of $2.40
  • 2008 earnings-per-share of $1.82 (24% decline)
  • 2009 earnings-per-share of $1.65 (9% decline)
  • 2010 earnings-per-share of $2.53 (53% increase)

As could be expected, T. Rowe Price experienced a sharp decline in earnings-per-share in 2008 and 2009. When stock markets decline, equity investors typically withdraw funds to raise cash.

Fortunately, the company remained profitable throughout the recession, allowing it to raise its dividend each year. T. Rowe Price quickly recovered in the aftermath of the Great Recession. Earnings increased significantly in 2010 and reached a new high by 2011.

Valuation & Expected Returns

We expect T. Rowe Price to produce adjusted earnings-per-share of $9.23 for 2025. Using the recent share price of ~$97, the stock has a price-to-earnings ratio of 10.5. We have a target price-to-earnings ratio of 14. If the stock valuation returns to the fair value estimate, then multiple expansion would add 5.9% to annual returns over the next five years.

The company does have a strong brand, with fairly consistent profitability and earnings growth. Even better, the stock appears undervalued today. We see earnings-per-share increasing at a rate of 3% annually through 2030 due to a combination of the sheer number of AUM and share repurchases.

Therefore, total returns would consist of the following:

  • 3% earnings growth
  • 5.2% dividend yield
  • 5.9% multiple expansion

T. Rowe Price is expected to return 12.9% annually through 2030. T. Rowe Price is a particularly attractive stock for dividend growth. The company has raised its dividend for 39 years in a row. And the dividend is reasonably secure, with an expected payout ratio below 55% for this year.

Final Thoughts

Investors scanning the financial sector for dividend stocks may naturally land on the big banks.

In fact, most Dividend Aristocrats in the financial sector come from the insurance and investment management industries. This speaks volumes about the stability of their business models.

T. Rowe Price is an industry leader and should continue increasing its dividend yearly. The focus on lower fees will continue to be a headwind for the industry. That said, shares of T. Rowe Price earn a buy rating due to expected annual returns.

Additionally, the following Sure Dividend databases contain the most reliable dividend growers in our investment universe:

If you’re looking for stocks with unique dividend characteristics, consider the following Sure Dividend databases:

Thanks for reading this article. Please send any feedback, corrections, or questions to [email protected].


Source link

What Our Experts Are Doing in This Crash


New tariffs from Trump roil the market (again)… the case for a bullish bounce… a key bearish line-in-the-sand… our experts are buying… a critical perspective

This morning, President Trump ratcheted up the tariff war, ordering tariffs on Canadian steel and aluminum to be increased another 25%, taking the full duty to 50%.

The policy goes into effect tomorrow morning.

Here’s Trump on Truth Social explaining why:

Based on Ontario, Canada, placing a 25% Tariff on “Electricity” coming into the United States, I have instructed my Secretary of Commerce to add an ADDITIONAL 25% Tariff, to 50%, on all STEEL and ALUMINUM COMING INTO THE UNITED STATES FROM CANADA, ONE OF THE HIGHEST TARIFFING NATIONS ANYWHERE IN THE WORLD.

In response, Ontario Premier Doug Ford threatened to shut off electricity to U.S. customers.

This is what trade wars look like.

Before this morning’s news, stocks appeared to be attempting to form a base. After 30 minutes of trading, the S&P 500 was flat, the Dow Jones Industrial Average was modestly lower, and the Nasdaq Composite was up about 0.70%.

But within minutes of Trump’s tariff announcement, all three major indexes fell into the red. As I write, the Nasdaq has clawed back to a small gain. Who knows where we’ll end the day?

Stepping back, let’s look squarely at this volatility.

What’s the potential for a bounce? How bad might it be if we keep falling? And how do our experts assess this pullback overall?

Let’s begin with the bull case.

Are we nearing technical exhaustion?

Let’s begin by looking at the S&P 500’s Relative Strength Index (RSI) indicator.

For newer Digest readers, the RSI is a momentum indicator that measures the extent to which an asset is overbought or oversold.

A reading over 70 suggests an asset is “overbought” (and likely poised to pull back as traders take profits) while a reading below 30 means it’s “oversold” (and poised for gains as bargain-hunters step in and buy).

As I write Tuesday, the S&P’s RSI is 28 – officially “oversold.”

As you’ll see below, in the last two years, there have been four times when it reached this general level. In each of those times, stocks jumped higher in the following days, though the ensuing bullishness had differing durations.

Chart showing in the last two years, there have been four times when it reached this general level. In each of those times, stocks jumped higher in the following days, though the ensuing bullishness had differing durations.

Source: TradingView

This doesn’t guarantee that we’re in for a bounce, but it increases those odds.

We get a similar takeaway from the S&P’s Moving Average Convergence/Divergence (MACD) indicator. It reflects changes in a price trend’s strength, direction, momentum, and duration.

It’s now at its lowest level since 2022’s bear market low.

Chart showing the S&P’s Moving Average Convergence/Divergence (MACD) indicator. It reflects changes in a price trend’s strength, direction, momentum, and duration. It’s now at its lowest level since 2022’s bear market low.

Source: TradingView

It’s hard for such extremes to remain for long.

You might think of it like a rubber band. The greater this MACD (and RSI) stretches, the farther/faster the ensuing snapback rally often is when the tension eventually releases.

So, if a reversion rally is in the cards, how high might we go?

The case for an 8%+ bounce

To help us with this analysis, we’re going to master trader Jeff Clark.

For newer Digest readers, Jeff is a market veteran with more than four decades of experience. In his service, Jeff Clark Trader, he profitably trades the markets regardless of direction – up, down, or sideways.

Over the last few days, one of Jeff’s indicators has been flashing a “bull” signal. From Jeff this past Friday:

The Volatility Index (VIX) just generated its third broad stock market “buy signal” of 2025. All three occurred within the last 10 days.

The first two signals reversed immediately. So, bullish traders are hoping this third time will be the charm.

As a quick reminder, VIX buy signals occur when the index closes above its upper Bollinger Band and then closes back inside the bands.

Jeff notes that while this indicator’s track record is excellent, it’s not perfect. Sometimes, instead of rallying immediately after the indicator triggers, the stock market falls. This pushes the VIX above its upper Bollinger Band again, negating the buy signal.

As Jeff just noted, the VIX Indicator has given us two false positives in the last two weeks. This is highly unusual.

Back to Jeff:

It is [incredibly rare] to get two failed VIX buy signals back-to-back – thereby setting the stage for a “triple” VIX buy signal. That is, however, what the market is set up for right now…

When it happens, it leads to “V” shaped rallies.

For example, last July/August we got a cluster of three VIX buy signals in about a two-week period. The first two signals failed.

Following the third signal, though, the S&P 500 rallied 400 points (8%) in about 10 days.

A similar move this time around would have the S&P 500 challenging the top of its recent trading range – near 6100 – by St. Patrick’s Day.

Our hypergrowth expert Luke Lango just ran a study suggesting a bullish move could go even higher

As usual, historical data and market history underpin Luke’s analysis.

This time, he ran a study on the Nasdaq-100. Luke prefers the Nasdaq-100 because we live in a tech-based economy, and this index includes the world’s largest 100 tech companies.

Luke evaluated what happened after the Nasdaq-100 closed below its 200-day moving average (MA), which it did earlier this week for the first time in more than a year.

Here’s Luke:

[The Nasdaq-100] has crossed below its 200-day moving average precisely 11 times before since 1990.

All 11 times, the market was either on the cusp of a big rebound or big breakdown – and which way it went depended on how the market acted in the subsequent two weeks.

Per Luke, if the Nasdaq-100 can remain within 4% of its 200-day MA, stocks always rebounded over the next 12 months, with average gains of over 25%.

Given this, Luke issued five “buy” alerts in his service Innovation Investor yesterday.

From Luke:

We view the odds of an economic recovery as being significantly greater than the odds of an economic recession…

And we therefore believe the odds of stocks soaring over the next year – and this being a great buying opportunity – as being significantly higher than the odds of stocks crashing over the next year.

So… let’s get aggressive here.

Regular Digest readers see me reference the following quote regularly, but this is a great time to highlight it. From billionaire Rob Arnott, founder and chairman of the board of Research Affiliates:

In investing, what is comfortable is rarely profitable.

But what happens if the Nasdaq-100 fails to hold within 4% of its 200-day MA?

That brings us to the potential downside of this recent selloff.

Let’s return to Luke:

[In our case study analysis,] if the Nasdaq-100 didn’t play strong defense and fell more than 4% below its 200-day moving average over the subsequent two weeks, stocks always slumped into a bear market.

This happened in early 1990 (right before the ’90s recession), mid-2000 (right before the dot-com crash), early 2008 (right before the 2008 financial crisis), and early 2022 (right before the inflation crash).

As I write on Tuesday, the 200-day MA sits at 20,323 while the index trades at 19,452, which means it’s just a shade over 4% lower.

We’re holding the line…barely. Clearly, we want to see some bullishness soon.

But if this market continues dropping, let’s maintain perspective

I’m in regular communication with many of InvestorPlace’s analysts… and I can tell you that, while cautious, they’re seeing opportunity.

We just highlighted how Luke put his money where his mouth was yesterday, recommending five new stocks.

He wasn’t the only one. On Friday, our global macro expert Eric Fry, editor of Fry’s Investment Report, made a new recommendation. Given the volatility, he wrote:

Anyone who [buys] shares of [this recommendation] today might not be happy about that purchase one week from now, or even one month from now, but I believe they [will] be very happy about it one year from now.

And we can throw legendary investor Louis Navellier into the mix.

As we’ve been highlighting in recent days, Louis is holding a live event this Thursday at 1 p.m. Eastern to prep investors for Nvidia Corp.’s (NVDA) “Q-Day,” which takes place one week from Thursday.

Here’s Louis explaining what’s behind the upcoming briefing:

In the third week of March, we’re going to have the big NVIDIA Corporation annual conference – the developers conference.

I expect Nvidia to announce a new breakthrough technology that could light a fire under the shares of one of its “Q” partners… a stock 1,000 times smaller than Nvidia.

It’s my top quantum pick, a small-cap stock protected by 102 patents with close ties to NVIDIA.

Though I don’t know all the details of Louis’ presentation, my hunch is that this broad market pullback has just made his preferred quantum stocks even more attractive from an entry valuation perspective. What I know for sure is that Louis has been banging the drum on this opportunity.

To learn more about his event and register for free, click here.

Finally, let’s wrap up with big-picture perspective

For this, we’ll turn to InvestorPlace’s CEO, Brian Hunt.

As longtime Digest readers know, beyond helming InvestorPlace, Brian is an accomplished trader/investor who loves teaching/writing about the topic.

In 2022’s bear market, Brian wrote an essay that’s critical for investors to remember as markets sell off. I encourage you to read the entire piece right here. But to prevent us from running too long, I’ll excerpt its takeaway to wrap us up today:

When the stock market goes through a big drop and your portfolio’s value is going lower and lower, it can be difficult to know what to do.

It’s an emotional time and mistakes are common when we are feeling pressure.

What about my retirement?

My kid’s college education?

My dreams of financial independence? …

These declines – even if they are in the modest 15% range – will scare you.

They will make you question the idea of owning stocks…

During stock market corrections, I ask you to focus on what really matters: progress, transformational industry trends, creating value for others, and innovation.

Remember that despite all the negative occurrences of the past 100 years, shareholders of innovative companies that serve their customers have made fortunes.

It’s been the surest way to get rich in America for more than 100 years. It will be that way for at least 100 more. That’s why staying bullish on human progress and innovation is at the foundation of what we do at InvestorPlace.

It’s also why, when our subscribers write in to ask if we have “bear market survival” plans, we send them this essay.

Our “bear market survival” plan consists of [remembering the long-term strength of the stock market], thinking long-term, and looking to buy high-quality stocks at discount prices.

Our “bear market survival” plan does not consist of selling stocks in a panic…

It’s one of the most important milestones on the journey to mastering money.

Have a good evening,

Jeff Remsburg


Source link

Economic sanctions and trade restrictions – February update – United States


In today’s fast-paced global market, staying current on sanctions updates is critical for businesses engaged in cross-border payments. Recent developments from U.S. and U.K. authorities—as well as actions by the European Union—underscore the dynamic nature of the regulatory landscape. Below we break down the key updates announced in January 2025 and what they mean for your business operations.

U.S. Treasury expands authorizations for activities and transactions in Syria

The U.S. Department of the Treasury’s Office of Foreign Assets Control (OFAC) issued Syria General License (GL) 24, expanding authorizations for activities and transactions in Syria, effective December 8, 2024. This action underscores the United States’ commitment to ensuring that U.S. sanctions do not impede activities to meet basic human needs or humanitarian assistance.

This authorization is in effect for six months, as the U.S. government continues to monitor the situation. GL 24 helps ensure that sanctions do not impede essential services and continuity of governance functions across Syria, including the provision of electricity, energy, water, and sanitation. Get all the details in the official announcement.

UK sanctions guidance: Countering evasion and no-Russia clause

The Office of Trade Sanctions Implementation (OTSI) has published two documents to aid compliance with UK sanctions against Russia. “Countering Russian Sanctions Evasion” guides exporters and manufacturers in identifying circumvention tactics, recognizing high-risk goods, spotting red flags, and enhancing due diligence to aid businesses in managing their risk and meeting their compliance obligations.

The UK government has also issued a “No-Russia Clause” which assists exporters in tailoring contracts to include provisions that prevent re-export to Russia. Prohibitions in the UK’s Russia sanctions regime also typically prohibit export ‘for use in’ Russia. Even if the immediate destination of the relevant goods is not Russia, the prohibition may still apply. UK’s trade sanctions on Russia seek to deny Russia access to the goods, technologies, services, and revenue necessary to pursue its illegal war.

Direct trade between the UK and Russia has fallen heavily since sanctions were introduced. However, Russia has been seeking to procure goods and services via indirect routes and complex supply chains. This heightens the risk of circumvention of trade sanctions, and diversion of goods to Russia.

US Treasury sanctions Russia’s energy sector

The U.S. Department of the Treasury (OFAC) and the UK’s Office of Financial Sanctions Implementation (OFSI) have announced sweeping sanctions targeting Russia’s energy sector to diminish revenue for its war against Ukraine. The sanctions, fulfilling a G7 commitment, impact major oil producers Gazprom Neft and Surgutneftegas, over 180 vessels (including those in the “shadow fleet”), oil traders, service providers, and energy officials.

A new determination authorizes sanctions on anyone operating in Russia’s energy sector, increasing risks for those involved in the Russian oil trade. The UK is joining the US in sanctioning major Russian oil producers. Treasury also issued amended General License 8L, which authorizes certain wind-down transactions related to energy through March 12, 2025.

Strengthening collaboration on economic sanctions

The Office of Foreign Assets Control (OFAC) of the U.S. Department of the Treasury and the Office of Financial Sanctions Implementation (OFSI) of the UK have established a Memorandum of Understanding to enhance their collaborative relationship. This arrangement aims to advance their shared goal of enforcing and promoting compliance with economic and trade sanctions.

The Memorandum facilitates the sharing of relevant information, coordination of investigations, personnel training, and discussions on regulatory expectations. It outlines terms and conditions for cooperation, ensuring compliance with applicable laws and regulations. Information sharing will adhere to strict controls and safeguards, with mechanisms for handling unauthorized disclosures. The agreement also establishes contact points for efficient communication and designates coordinators to oversee its implementation.

While not legally binding, the Memorandum signifies a commitment to cooperation, allowing for amendments, suspension, or termination by either participant.

Family International Realty LLC fined for sanctions evasion

OFAC has announced that Family International Realty LLC and its owner have agreed to pay $1,076,923 to settle potential civil liability for violating Ukraine-/Russia-related sanctions. Between 2018 and 2023, they executed a scheme to evade sanctions by transferring ownership of luxury condominiums owned by sanctioned Russian oligarchs Valeri Abramov and Viktor Perevalov to family members and shell companies. This was done to obscure the oligarchs’ interests and facilitate rentals and sales, generating approximately $182,442 in commissions and reimbursements for the company. The settlement reflects that the violations were egregious and not self-disclosed, also considering the owner’s resolution of related criminal charges.

Haas Automation settles with OFAC for sanctions violations

Haas Automation, Inc. has agreed to pay $1,044,781 to settle potential civil liability for 21 apparent violations of Ukraine-/Russia-related sanctions. Between December 2019 and March 2022, Haas indirectly supplied a computer numerical control (CNC) machine, spare parts, and authorization codes to blocked Russian entities through its Russian distributor, Abamet Management Limited.

The U.S. Office of Foreign Assets Control (OFAC) determined that Haas did not voluntarily disclose the violations and that eight of them were egregious. OFAC considered Haas’s remedial efforts and cooperation as mitigating factors. Haas is also settling with the Bureau of Industry and Security (BIS) for $1,500,000. Further details are available in the enforcement release.

Executive Order 14148: Rescinding prior actions

On January 24, President Trump signed a new Executive Order (E.O.), “Initial Rescissions Of Harmful Executive Orders And Actions,” which, among other actions, revoked E.O. 14115, “Imposing Certain Sanctions on Persons Undermining Peace, Security, and Stability in the West Bank.” To implement the President’s revocation of E.O. 14115, OFAC removed the West Bank-Related Sanctions program from its website and removed all persons designated under E.O. 14115 from the Specially Designated Nationals and Blocked Persons List (SDN List). All property and interests in property blocked under E.O. 14115 are now unblocked.

EU prolongs economic sanctions against Russia

The Council of the European Union has extended its economic sanctions targeting specific sectors of the Russian economy for another six months, lasting until July 31, 2025. These measures, initially introduced in 2014 in response to Russia’s actions in Ukraine, were significantly expanded following Russia’s full-scale invasion in February 2022. The sanctions aim to weaken Russia’s ability to finance the war and apply pressure to change its policies. They encompass restrictions on trade, finance, technology, and dual-use goods. The EU remains steadfast in its condemnation of Russia’s aggression and unwavering support for Ukraine’s sovereignty and territorial integrity. Read the full announcement for more detail.

Navigating the latest sanctions updates in cross-border payments

Staying ahead of sanctions updates isn’t just about avoiding penalties, it’s about safeguarding your business reputation and ensuring seamless international operations. As regulatory landscapes evolve, proactive compliance becomes an essential element of strategic growth.

In an era of rapid regulatory change, your ability to adapt and stay informed is key to maintaining a competitive edge and protecting your bottom line.  For companies navigating cross-border payments, these updates serve as a crucial reminder to:

  • Enhance compliance frameworks:
    Regularly update your internal policies and due diligence processes considering new sanctions guidance and enforcement actions.
  • Invest in training:
    Ensure that your teams are well-versed in the latest regulatory changes. Training can help identify red flags and prevent inadvertent sanctions breaches.
  • Leverage technology:
    Utilize advanced compliance tools to monitor transactions, screen counterparties, and flag any activities that may fall under evolving sanctions regimes.
  • Maintain open channels:
    Engage with legal and regulatory experts to continuously assess your exposure and adapt to the shifting sanctions landscape.

Want more insights on the topics shaping the future of cross-border payments? Tune in to Converge, with new episodes every Wednesday.

Plus, register for the Daily Market Update to get the latest currency news and FX analysis from our experts directly to your inbox.


Source link

10 Highest Yielding Blue Chip Stocks Now


Published on March 11th, 2025 by Bob Ciura

Blue-chip stocks are established, financially strong, and consistently profitable publicly traded companies.

Their strength makes them appealing investments for comparatively safe, reliable dividends and capital appreciation versus less established stocks.

This research report has the following resources to help you invest in blue chip stocks:

Resource #1: The Blue Chip Stocks Spreadsheet List


There are currently more than 500 securities in our blue chip stocks list.

We categorize blue chip stocks as companies that are members of 1 or more of the following 3 lists:

Simply put, blue chip stocks have at least 10 consecutive years of dividend increases.

At the same time, we often recommend income investors consider high dividend stocks, for their elevated dividend yields.

High dividend stocks means more income for every dollar invested. All other things equal, the higher the dividend yield, the better.

The combination of dividend yield and growth, can result in outstanding long-term returns.

In this research report, we analyze 10 blue chip stocks with high dividend yields of 5.0% and greater.

The list is sorted by dividend yield, in ascending order.

Table of Contents

The table of contents below allows for easy navigation.

High Yield Blue Chip #10: Franklin Resources (BEN)

  • Dividend History: 45 years of consecutive increases
  • Dividend Yield: 6.2%

Franklin Resources is an investment management company. It was founded in 1947. Today, Franklin Resources manages the Franklin and Templeton families of mutual funds.

On January 31st, 2025, Franklin Resources reported net income of $163.6 million, or $0.29 per diluted share, for the first fiscal quarter ending December 31, 2024.

This marked a significant improvement from the previous quarter’s net loss of $84.7 million, though EPS remained lower than the $251.3 million net income recorded in the same quarter last year.

Source: Investor presentation

The past few years have been difficult for Franklin Resources. Franklin Resources was slow to adapt to the changing environment in the asset management industry.

The explosive growth in exchange-traded funds and indexing investing surprised traditional mutual funds.

ETFs have become very popular with investors due in large part to their lower fees than traditional mutual funds. In response, the asset management industry has had to cut fees and commissions or risk losing client assets.

Earnings-per-share are expected to decline in 2025 as a result. The company still maintains a manageable payout ratio of 51% expected for 2025, but if EPS continues to decline, the dividend payout could be in danger down the road.

Click here to download our most recent Sure Analysis report on BEN (preview of page 1 of 3 shown below):

High Yield Blue Chip #9: Enterprise Products Partners LP (EPD)

  • Dividend History: 27 years of consecutive increases
  • Dividend Yield: 6.4%

Enterprise Products Partners was founded in 1968. It is structured as a Master Limited Partnership, or MLP, and operates as an oil and gas storage and transportation company.

Enterprise Products has a large asset base which consists of nearly 50,000 miles of natural gas, natural gas liquids, crude oil, and refined products pipelines.

It also has storage capacity of more than 250 million barrels. These assets collect fees based on volumes of materials transported and stored.

Source: Investor Presentation

Enterprise Products Partners reported strong fourth-quarter 2024 earnings, delivering $1.6 billion in net income, or $0.74 per common unit, representing a 3% increase over the prior year.

Adjusted cash flow from operations rose 4% to $2.3 billion, with the company declaring a quarterly distribution of $0.535 per unit, a 4% year-over-year increase.

Enterprise also continued its capital return strategy, repurchasing 2.1 million common units during the quarter and 7.6 million units for the full year, bringing total buybacks under its program to $1.1 billion.

For the full year, the company posted $9.9 billion in EBITDA, moving 12.9 million barrels of oil equivalent per day.

Click here to download our most recent Sure Analysis report on EPD (preview of page 1 of 3 shown below):

High Yield Blue Chip #8: Pfizer Inc. (PFE)

  • Dividend History: 16 years of consecutive increases
  • Dividend Yield: 6.5%

Pfizer Inc. is a global pharmaceutical company focusing on prescription drugs and vaccines. Pfizer’s top products are Eliquis, Prevnar family, Paxlovid, Comirnaty, Vyndaqel family, Ibrance, and Xtandi. Pfizer had revenue of $63.6B in 2024.

Pfizer reported solid Q4 2024 results on February 4th, 2025. Company-wide revenue grew 21% operationally and adjusted diluted earnings per share climbed to $0.63 versus $0.10 on a year-over-year basis because of stabilizing COVID-19 related sales, growing revenue from the existing portfolio, and lower expenses.

Global Biopharmaceuticals sales gained 22% to $17,413M from $14,186M led by gains in Primary Care (+27%), Specialty Care (+12%), and Oncology (+27%). Pfizer Centerone saw 11% lower sales to $325M, while Ignite revenue was $26M.

Of the top selling drugs, sales increased for Eliquis (+14%), Prevnar (-4%), Plaxlovid (flat), Cominraty (-37%), Vyndaqel/ Vyndamax (+61%), Ibrance (-2%), and Xtandi (+24).

Click here to download our most recent Sure Analysis report on PFE (preview of page 1 of 3 shown below):

High Yield Blue Chip #7: Northwest Bancshares Inc. (NWBI)

  • Dividend History: 13 years of consecutive increases
  • Dividend Yield: 6.7%

Northwest Bancshares is a bank holding company that offers full-service financial institutions providing a complete line of personal and business banking products, including employee benefits, investment management services, and trust.

Northwest Bank is the leading subsidiary of Northwest Bancshares, and it operates 162 branches in central and western Pennsylvania, western New York, eastern Ohio, and Indiana. Northwest Bancshares has been paying a rising dividend for thirteen consecutive years.

On January 24th, 2025, the company announced the fourth quarter results for the fiscal year (FY)2024. The company reported fourth-quarter 2024 net income of $33 million, or $0.26 per diluted share, reflecting a $4 million increase from the same period in 2023 but a slight decline from the previous quarter.

Adjusted net income (non-GAAP) was $35 million, or $0.27 per diluted share. The company’s net interest margin expanded by 9 basis points to 3.42%, bolstered by an interest recovery. Additionally, the efficiency ratio improved to 61.8%.

Click here to download our most recent Sure Analysis report on NWBI (preview of page 1 of 3 shown below):

High Yield Blue Chip #6: Altria Group (MO)

  • Dividend History: 55 years of consecutive increases
  • Dividend Yield: 6.9%

Altria is a tobacco stock that sells cigarettes, chewing tobacco, cigars, e-cigarettes, and more under a variety of brands, including Marlboro, Skoal, and Copenhagen, among others.

With a current dividend yield of nearly 8%, Altria is an ideal retirement investment stock.

This is a period of transition for Altria. The decline in the U.S. smoking rate continues. In response, Altria has invested heavily in new products that appeal to changing consumer preferences, as the smoke-free category continues to grow.

Source: Investor Presentation

The company also has a 35% investment stake in e-cigarette maker JUUL, and a 45% stake in the Canadian cannabis producer Cronos Group (CRON).

Altria Group reported solid financial results for the fourth quarter and full year of 2024. For the fourth quarter, revenue of $5.1 billion beat analyst estimates by $50 million, and increased 1.6% year-over-year. Adjusted EPS of $1.29 beat by a penny.

For the full year, Altria generated adjusted diluted EPS growth of 3.4% and returned over $10.2 billion to shareholders through dividends and share repurchases.

For 2025, Altria expects adjusted diluted EPS in a range of $5.22 to $5.37. This represents an adjusted diluted EPS growth rate of 2% to 5% for 2025.

Click here to download our most recent Sure Analysis report on Altria (preview of page 1 of 3 shown below):

High Yield Blue Chip #5: LyondellBasell Industries (LYB)

  • Dividend History: 13 years of consecutive increases
  • Dividend Yield: 7.0%

LyondellBasell is one the largest plastics, chemicals and refining companies in the world. The company provides materials and products that help advance solutions for food safety, water purity, fuel efficiency of vehicles, and functionality in electronics and appliances.

LyondellBasell sells products in more than 100 countries and is the world’s largest producer of polymer compounds. The company, with U.S operations headquartered in Houston, Texas and global operations headquartered in London, generated $40.3 billion in sales last year.

On January 31st, 2025, LyondellBasell posted its Q4 and full year results for the period ending December 31st, 2024. The company posted revenues of $9.45 billion, marking a sequential decline from $10.32 billion in Q3, due to softer demand and lower product pricing across key divisions.

The company posted adjusted EBITDA of $689 million, down from $1.21 billion in Q3, reflecting higher raw material costs, seasonally lower polyolefin demand, and compressed refining and oxyfuels margins amid weaker gasoline crack spreads.

Adjusted net income for Q4 was $249 million ($0.75 per share), down from $617 million ($1.88) in Q3. For the year, adjusted EPS was $6.40.

Click here to download our most recent Sure Analysis report on LYB (preview of page 1 of 3 shown below):

High Yield Blue Chip #4: Universal Health Realty Income Trust (UHT)

  • Dividend History: 40 years of consecutive increases
  • Dividend Yield: 7.0%

Universal Health Realty Income Trust operates as a real estate investment trust (REIT), specializing in the healthcare sector. The trust owns healthcare and human service-related facilities.

Its property portfolio includes acute care hospitals, medical office buildings, rehabilitation hospitals, behavioral healthcare facilities, sub-acute care facilities and childcare centers.

Universal Health’s portfolio consists of 76 properties located in 21 states.

On February 26, 2025, Universal Health Realty Income Trust (UHT) reported its financial results for the fourth quarter of 2024. The company achieved net income of $4.7 million, or $0.34 per diluted share, marking an increase from $3.6 million, or $0.26 per diluted share, in the same period of 2023.

This improvement was driven by a net increase in income from various properties, partially offset by higher interest expenses due to increased borrowing rates and outstanding borrowings under the revolving credit agreement.

Funds from operations (FFO) for the quarter were $11.8 million, or $0.85 per diluted share, up from $11.4 million, or $0.82 per diluted share, in the prior year’s fourth quarter.

Click here to download our most recent Sure Analysis report on UHT (preview of page 1 of 3 shown below):

High Yield Blue Chip #3: MPLX LP (MPLX)

  • Dividend History: 12 years of consecutive increases
  • Dividend Yield: 7.3%

MPLX LP is a Master Limited Partnership that was formed by the Marathon Petroleum Corporation (MPC) in 2012. In 2019, MPLX acquired Andeavor Logistics LP.

The business operates in two segments:

  • Logistics and Storage, which relates to crude oil and refined petroleum products
  • Gathering and Processing, which relates to natural gas and natural gas liquids (NGLs)

In early February, MPLX reported (2/4/25) financial results for the fourth quarter of fiscal 2024. Adjusted EBITDA and distributable cash flow (DCF) per share grew 9% and 7%, respectively, primarily thanks to higher tariff rates and increased volumes of liquids and gas.

MPLX maintained a healthy consolidated debt to adjusted EBITDA ratio of 3.1x and a solid distribution coverage ratio of 1.5x.

Click here to download our most recent Sure Analysis report on MPLX (preview of page 1 of 3 shown below):

High Yield Blue Chip #2: Delek Logistics Partners LP (DKL)

  • Dividend History: 10 years of consecutive increases
  • Dividend Yield: 10.9%

Delek Logistics Partners, LP is a publicly traded master limited partnership (MLP) headquartered in Brentwood, Tennessee. Established in 2012 by Delek US Holdings, Inc. (NYSE: DK), Delek Logistics owns and operates a network of midstream energy infrastructure assets.

These assets include approximately 850 miles of crude oil and refined product transportation pipelines and a 700-mile crude oil gathering system, primarily located in the southeastern United States and west Texas.

The company’s operations are integral to Delek US’s refining activities, particularly supporting refineries in Tyler, Texas, and El Dorado, Arkansas.

Delek Logistics provides services such as gathering, transporting, and storing crude oil, as well as marketing, distributing, and storing refined products for both Delek US and third-party customers.

On February 25, 2025, Delek Logistics Partners (DKL) reported its financial results for the fourth quarter of 2024. The company achieved an adjusted EBITDA of approximately $107.2 million, an increase from $100.9 million in the same period of the previous year.

Distributable cash flow was $69.5 million, with a coverage ratio of approximately 1.2 times. The Gathering and Processing segment saw an adjusted EBITDA of $66 million, up from $53.3 million in Q4 2023, primarily due to higher throughput from Permian Basin assets and contributions from the H2O Midstream acquisition.

Click here to download our most recent Sure Analysis report on DKL (preview of page 1 of 3 shown below):

High Yield Blue Chip #1: Arbor Realty Trust (ABR)

  • Dividend History: 11 years of consecutive increases
  • Dividend Yield: 14.0%

Arbor Realty Trust is a nationwide mortgage real estate investment trust (REIT) that acts as a direct lender and operates in two reporting segments: Agency Business and Structured Business. The trust provides loan origination and servicing for multifamily, seniors housing, healthcare, and other diverse commercial real estate assets.

Arbor Realty’s specific focus is government-sponsored enterprise products, although its platform also includes commercial mortgage backed securities (CMBS), bridge and mezzanine loans, and preferred equity issuances.

On February 21, 2025, Arbor Realty Trust reported its financial performance for the fourth quarter of 2024. The company achieved distributable earnings of $0.48 per share, surpassing the quarterly dividend of $0.43 per share.

This marked the 13th consecutive quarter in which distributable earnings exceeded dividends, highlighting Arbor’s consistent profitability. The debt platform originated $1.1 billion in new loans during the quarter, bringing the total originations for the year to $4.2 billion.

Click here to download our most recent Sure Analysis report on ABR (preview of page 1 of 3 shown below):

Additional Reading

If you are interested in finding other high-yield securities, the following Sure Dividend resources may be useful:

High-Yield Individual Security Research

Other Sure Dividend Resources

Thanks for reading this article. Please send any feedback, corrections, or questions to [email protected].


Source link

My System Is Flagging a Potential 50X Opportunity… Even in This Ugly Market


There’s no way to sugarcoat it. The market’s a disaster right now, folks.

The tariffs on Canada and Mexico, as well as the 20% tariffs on China, have sent the stock market spiraling lower in March. Even though President Trump backpedaled and postponed some of the tariffs on Canada and Mexico until April, it was too little, too late for many investors.

The S&P 500, Dow and NASDAQ have all erased their post-election gains. In fact, in the first six trading days of March alone, all three indices fell more than 4%.

Breaking news keeps jerking the market around, too. The markets fell this morning after President Trump announced even bigger tariffs on Canadian aluminum and steel – only to stage a rebound as news broke that Ukraine agreed to a 30-day ceasefire negotiated by the United States if Russia accepts the plan.

But believe it or not, a future billionaire is making their first move today.

George Washington once said that when you have a people who are “possessed by the spirit of Commerce,” they can achieve anything.

I don’t think our first president would realize just how true those words were.

Consider Jeff Bezos. At 30 years old, he quit a cushy Wall Street job to sell books online – at a time when most people barely used the internet.

Now, Amazon.com, Inc. (AMZN) dominates global commerce… and Bezos has a $215 billion net worth.

Or Bill Gates. He dropped out of Harvard to build software. Most people didn’t even own a computer back then.

Today, Microsoft Corporation (MSFT) is a $3 trillion giant… and Bill Gates is worth about $108 billion.

Mark Zuckerberg… Elon Musk… I could go on.

These guys weren’t lucky. They didn’t become billionaires overnight. They were talented, worked hard, and took advantage of life-changing opportunities whenever circumstances (or fate) came along.

They are the epitome of the American dream.

Now, I am no Bill Gates or Jeff Bezos. Frankly, I am also more of a “car guy” than a “rocket ship guy.”

However, I do like to say that my life story is also the embodiment of the American dream.

I wasn’t born with a silver spoon in my mouth. I’m the son of a stone mason and the first in my family to go to college. Today, I live a lavish lifestyle – and it’s all thanks to the market-beating system I created over four decades ago.  

Believe it or not, I stumbled onto this system by accident when I “failed” a specific assignment at Cal State Hayward in the late ’70s.

So, in today’s Market 360, I want to tell you about the failed assignment that started it all for me. I’ll explain how it led me to create a system that would find some of the market’s biggest winners over the past few decades.

In fact, it helped me find NVIDIA Corporation (NVDA) when it was trading at just $1 (split-adjusted) in 2016. We all know what happened after that – the stock went up by more than 7,000% at its peak.

Then, I’ll wrap things up by telling you about the 50X profit opportunity my system is alerting me to today… and where you can learn more about it.


Source link

Greenback drops to October lows as recession worries dominate – United States


Written by Steven Dooley, Head of Market Insights, and Shier Lee Lim, Lead FX and Macro Strategist

USD hits pre-election lows

Global markets fell again yesterday with the US’s Dow Jones down 1.1%, UK’s FTSE 100 falling 1.2% and Japan’s Nikkei dropping 0.6%.

Rising global recession fears, equity market volatility and weaker growth indicators have driven a shift toward safe-haven assets with the Japanese yen and Swiss franc outperforming.

Unusually, the US dollar has not benefited from these safe-haven flows, with markets instead worried about the prospects for US growth.

The AUD/USD climbed from one-week lows with a 0.2% gain but remains broadly within the six-week old trading range between 0.6200 and 0.6400.

Similarly, the NZD/USD recovered within its recent trading range between 0.5600 and 0.5775.

In Asia, the moves were more significant. USD/SGD fell back to the lowest level since 11 November.

The USD/CNH fell to the lowest level since 19 November.

Chart showing USD/SSGD at four-month lows

US inflation in focus tonight

Technically, the US dollar index remains relatively weak with the market still below its 50-day and 200-day EMAs. 

Tonight, US consumer prices will be revealed at 11:30pm AEDT.

After a robust reading of 0.446% in January, core CPI inflation probably slowed somewhat to 0.287% m-o-m in February, although it most certainly stayed above the December level of 0.210%.

We anticipate that core PCE inflation (to be released later this month) stayed high in February at 0.282% m-o-m.

The Fed will probably continue to monitor inflation concerns if the print matches our prediction. 

The USD index is now at a four-month low, with next key support at its weekly 200-day EMA of 102.58.

Chart showing dollar index 50- 100- and 200- weekly moving averages

Korea’s artificial job market masks KRW weakness

Today, the Korea unemployment rate will be revealed at 10:00 AEDT. As the labor market improves, we anticipate that the unemployment rate will slightly decline once again, from 2.9% in January to 2.8% SA in February.

The service sector probably kept adding employment as a result of the government’s frontloading fiscal expenditures, offsetting job losses in the manufacturing and construction sectors.

We retain negative outlook on KRW, which may see USD/KRW move higher in the short-term.

USDKRW is currently at its three-month low.  The USDKRW pair has rebounded from its 50-day EMA support of 1443.09, which may be attractive to USD buyers.

The next level of key support for USDKRW is at its 200-day EMA of 1403.63.

Chart showing KRW pressured on artificial labor market

USD sees losses across Asia

Table: seven-day rolling currency trends and trading ranges  

Key global risk events

Calendar: 10 – 15 March  

Key global risk events calendar: 10 - 15 March

All times AEDT

Have a question? [email protected]

*The FX rates published are provided by Convera’s Market Insights team for research purposes only. The rates have a unique source and may not align to any live exchange rates quoted on other sites. They are not an indication of actual buy/sell rates, or a financial offer.


Source link

Copyright © 2023 | Powered by WordPress | Coin Market Theme by A WP Life