Oracle (ORCL) delivered quarterly results that topped analysts’ expectations and projected strong growth, sending shares higher in extended trading Wednesday.
Oracle shares jumped close to 7% in after-hours trading. The stock was up about 6% for 2025 through Wednesday’s close.
In its fiscal fourth quarter, revenue grew 11% year-over-year to $15.9 billion, above the analyst consensus. Adjusted net income of $4.88 billion, or $1.70 per share, rose from $4.61 billion, or $1.63 per share, in the year-ago quarter, also beating estimates.
The gains came as cloud infrastructure revenue jumped 52% to $3 billion, making it Oracle’s fastest-growing segment, though the figure was slightly short of Wall Street estimates.
CEO Safra Catz said Oracle expects cloud infrastructure growth to increase from 50% in fiscal 2025 to more than 70% in fiscal 2026. Analysts had called for growth of 62%, according to Visible Alpha.
“FY25 was a very good year—but we believe FY26 will be even better as our revenue growth rates will be dramatically higher,” said Catz.
“Oracle is well on its way to being not only the world’s largest cloud application company—but also one of the world’s largest cloud infrastructure companies,” Catz added.
Shares of Voyager Technologies, a space and defense tech company that counts Palantir (PLTR), Lockheed Martin (LMT), and NASA among its clients and partners, soared in their first day of trading.
Voyager, which now trades on the New York Stock Exchange using the ticker “VOYG,” priced its initial public offering at $31 per share, above an estimated range of $26 to $29. The shares opened Wednesday at $69.75 before finishing just above $56. At its intraday high, the stock traded near $74.
Voyager sold more than 12 million shares in the offering, raising roughly $695 million in proceeds.
The Denver-based company reported a first-quarter net loss of $26.9 million on revenue that jumped over 14% year-over-year to $34.5 million, according to a filing with the Securities and Exchange Commission. NASA is its largest customer, accounting for over a quarter of the company’s revenue in 2024, the company said.
Voyager’s launch comes after a string of strong IPOs, suggesting improving investor appetite for new listings. Just earlier this week, shares of Circle (CRCL) more than doubled in its trading debut. Omada Health (OMDA) and Hinge Health (HNGE) also made debuts in recent weeks.
The latest Consumer Price Index (CPI) data showed headline and core inflation rising 0.1% m/m in May, down from April’s prints and below forecasts. This means, on a year-over-year basis, headline CPI ticked up to 2.4% (vs. 2.3% prior), while core remained steady at 2.8%. It marks the fourth straight month of weaker-than-expected core inflation, reinforcing the disinflation trend. Markets responded by pricing in more Federal Reserve (Fed) easing this year. Treasury yields declined and the US dollar index dropped by the most in a week.
The string of below-forecast inflation prints suggest consumers have yet to fully experience the effects of President Trump’s tariffs, likely due to temporary tariff pauses, companies absorbing costs, or pre-emptive inventory stockpiling. However, domestic service prices, including housing, appear restrained too, hinting at consumer caution and income insecurity – offsetting any inflationary pass-through from tariffs.
The broader impact of the trade war remains disinflationary at this stage, which, all else being equal, is supportive for financial assets. However, anecdotal signs that corporations are preparing price hikes could keep the Fed wary, hence the rather muted reaction in equities.
Investors are also likely focusing on tariffs’ reflationary effects and long-end supply dynamics, which point to continued steepening of the yield curve. This is a dynamic we’ve referenced frequently in relation to driving USD weakness too.
New tariff threats drive haven demand
George Vessey – Lead FX & Macro Strategist
The other important news is that President Trump said a trade deal with China was done. However, markets remained cautious as the agreement lacked concrete details and still requires final approval from US and China presidents. Then, overnight, Trump said he plans to send letters to trading partners within the next one to two weeks, outlining unilateral tariff rates ahead of a July 9 deadline. Risk sentiment soured and trade uncertainty ramped up once again.
The dollar weakened against most G10 currencies, while gold, the Swiss franc, and the yen gained on haven demand. The US dollar remains a key barometer of trade sentiment, and its failure to extend higher in the wake of the so-called deal with China was telling. Now, it’s under increased selling pressure once more, with the dollar index looking poised to hit a fresh 3-year low.
As the US engages with India and Japan to negotiate lower tariffs, some view Trump’s latest remarks as a tactic to increase pressure in trade discussions. Scepticism also remains about whether he will follow through on his pledge, given his track record of setting tight deadlines that often shift or go unfulfilled.
As ever, this persistent uncertainty continues to weigh on businesses, consumers, and investors, making it difficult to plan for potential policy shifts. Markets remain on edge, awaiting clearer signals on whether tariff adjustments will materialize or simply remain a negotiating tool.
Euro’s tug-of-war: trapped in uncertainty
Antonio Ruggiero – FX & Macro Strategist
The euro climbed back above $1.15 versus the USD following a softer-than-expected US inflation report and Trump’s tough talk on tariffs again. The rally was underpinned first by heightened Fed rate cut expectations, which helped narrow the yield differential that still favours the dollar, offering some support to the euro. Still, the move stood out, as rate differentials have recently had a diminished role in driving price action, with broader US sentiment acting as the dominant force instead. Then came Trump’s latest tariff threat, which sent traders flocking to safe haven alternatives to the dollar.
EUR/USD has managed to break out of its well-worn and frustrating range between $1.1380 and $1.1445, although the move may prove short-lived. The common currency continues to struggle in mounting a sustained push toward April’s highs, with resilience in the US economic outlook proving a key headwind.
Underneath it all, volatility remains a crucial driver of short-term direction for the euro. Since the start of Trump’s presidency, the euro has been a primary beneficiary of heightened market uncertainty: Investors have piled into long euro positions, using it as a dollar alternative to hedge against US-driven volatility.
Over the past two months, however, EUR/USD risk reversals in favor of euro calls have softened across the volatility curve. While trade developments have curbed euro bullishness, other factors—some even euro-driven—may have quietly contributed to less aggressive positioning: Lagarde’s hawkish stance was undeniably supportive for the euro, but ultimately removed the very fuel that had been driving it higher for months—volatility. Markets now have clarity on the ECB’s policy path, with no rate cuts until after summer and only a 47.7% probability of a September cut. This reduced policy uncertainty has dampened speculative positioning around the July meeting, pulling down options market volatility. In other words, while the euro still benefits from dollar hedging, the lack of ECB-driven volatility as a catalyst weakens the case for a sustained bullish EUR/USD uptrend. After all, lower ATM volatility tends to drag down wing volatility, having a multiplier effect that weakens appetite for aggressive euro bets and ultimately reins in momentum.
Meanwhile, the euro’s ambition to rival the dollar as a global reserve currency remains distant. The ECB’s latest annual report, released yesterday, showed international euro usage remained flat in 2024 at 19%, while its FX reserve share held steady at 20%—just a third of the dollar’s dominance. Though the report doesn’t yet reflect recent market shifts, it underscores the long road ahead for the euro to challenge the dollar’s role. Meanwhile, rising demand for crypto and gold, with the latter having recently overtaken the euro as the second-largest central bank reserve asset, adds further obstacles to broader euro adoption.
Sterling struggles as gilt yields diverge
George Vessey – Lead FX & Macro Strategist
The weaker US dollar allowed the pound to claw back towards $1.36, but this morning’s softer-than-expected GDP data has forced the UK currency to pare gains. Still, GBP/USD continues to trade in the higher echelons of $1.35, over six cents higher than its 5-year average. GBP/EUR is looking vulnerable though after slipping below key daily moving averages of late, as the euro sweeps up a chunk of the demand flowing away from the dollar.
Away from the trade drama, the UK data this week has been a drag on the pound. The British economy shrank 0.3% m/m in April, the first decline in six months, and the biggest since October 2024. Services output fell by 0.4%, following growth of 0.4% in March, and was the largest contributor to the fall in GDP. Industrial and manufacturing production also came in below forecasts. The gloomy numbers follow a sharp decline in payrolls, with over 100,000 jobs lost in May, and means the likelihood of an August Bank of England rate cut has solidified further. Markets are pricing in two more rate cuts this year now, and as a result, two-year gilt yields are expected to trend lower in anticipation of easier policy, which could prove a strong headwind for sterling.
Long-end rates are expected to stay elevated though. The three-year spending plan outlined by UK Chancellor Rachel Reeves yesterday suggest sustained demand on public finances raising the likelihood of further borrowing and potential tax hikes down the line. Hence 10- and 30-year gilt yields keep pressing higher, widening the divergence with 2-year yields.
*The FX rates published are provided by Convera’s Market Insights team for research purposes only. The rates have a unique source and may not align to any live exchange rates quoted on other sites. They are not an indication of actual buy/sell rates, or a financial offer.
The S&P 500 slipped 0.3% on Wednesday, June 11, as investors weighed softer-than-expected inflation data and progress on U.S.-China trade talks.
Shares of Nucor and other steelmakers lost ground following reports that the U.S. and Mexico have discussed reducing or eliminating tariffs on steel imports up to a certain volume.
GE Vernova shares advanced after BofA analysts boosted their price targets. The analysts highlighted expectations for strong growth in U.S. electricity demand.
Major U.S. equities indexes ended the midweek session slightly lower.
The S&P 500 traded in positive territory for much of the day but lost steam on Wednesday afternoon. It closed with a loss of 0.3%, snapping a streak of three straight winning sessions. The Nasdaq was down 0.5%, while the Dow finished just a point below Tuesday’s closing level.
After securing the S&P 500’s top performance in the previous session, Intel (INTC) shares gave back most of their gains on Wednesday, tumbling 6.5% to record the steepest daily drop in the benchmark index. This week’s volatility for Intel stock came as trade talks between the U.S. and China boosted hopes for less onerous semiconductor export restrictions. Meanwhile, the chipmaker remains in the midst of a major restructuring effort under CEO Lip-Bu Tan, who has been focused on cutting costs through workforce reductions, divestitures, and other initiatives since entering the role in March.
Shares of steelmakers came under pressure following reports that the U.S. and Mexico are negotiating to scale back or cancel President Donald Trump’s 50% tariff on steel imports up to a certain volume. The North American neighbors are reportedly exploring a quota system that would allow a specific amount of the metal to enter the U.S. from Mexico duty-free or at lower rates, with excess amounts subject to the full 50% levy. Nucor (NUE) shares lost 6.1%.
Lockheed Martin (LMT) shares dropped 4.3% after reports indicated that the U.S. Department of Defense is cutting down on its orders for the aerospace and defense manufacturer’s F-35 fighter jets. Delays involving a technological upgrade have hampered the finalization of contracts for the F-35.
Warner Bros. Discovery (WBD) jumped 5%, climbing the most of any S&P 500 stock on Wednesday, as investors continue to evaluate the entertainment giant’s recently announced plan to split its studio operations and TV business into two separate companies. The stock has been volatile since the announcement, and uncertainties about the strategy remain.
Starbucks (SBUX) shares jolted 4.3% higher on Wednesday. The coffee giant announced the launch of Green Dot Assist, a virtual assistant powered by generative artificial intelligence (AI) that is designed to help baristas with in-store functions, from learning to make drinks to troubleshooting maintenance issues. The company’s CEO also said that Starbucks would accelerate its rollout of an updated staffing model across its stores and noted that the company has garnered significant interest regarding a possible sale of its stake in its China business.
Shares of GE Vernova (GEV), the energy technology company that spun off from General Electric in 2024, surged 3.9% after Bank of America boosted its price target on the stock. Analysts highlighted their expectations for growing electricity demand in the U.S. over the next 10 years. They noted that GE Vernova could be well-positioned to capitalize on its natural gas turbine market strength. BofA also pointed to upside potential for GE Vernova’s electrification business, anticipating strong demand for grid reliability equipment.
Broadcom (AVGO) shares gained 3.4%. In results released last week, the chipmaker reported record quarterly revenue, driven by a boom in AI semiconductors, prompting numerous analysts to raise their price targets on the stock. However, Broadcom issued a muted forecast for the current quarter, citing potential softness in its server storage, wireless, and industrial businesses, and its shares initially moved lower in the wake of the report. Despite these challenges, Broadcom expects AI revenue growth to remain robust, saying it could hit $5.1 billion in the fiscal third quarter.
Shares of Quantum Computing surged 25% to their highest level since December on Wednesday, boosted by Nvidia CEO Jensen Huang’s bullish remarks about the emerging technology.
The stock recently broke out from a rectangle, a chart formation signaling a continuation of the stock’s longer-term strong uptrend.
Investors should watch major overhead areas on Quantum Computing’s chart around $27 and $37.50, while also monitoring key support levels near $15 and $9.
Quantum Computing (QUBT) shares surged to their highest level since December on Wednesday, boosted by Nvidia CEO Jensen Huang’s bullish remarks about the emerging technology.
Quantum Computing shares, which traded below $1 dollar a year ago, gained 25% on Wednesday to close at around $19, putting the stock back into positive territory for 2025. The company last month said it had finished construction of its Quantum Photonic Chip Foundry in Tempe, Ariz., and that it had deepened its engagement with both government and commercial partners amid growing interest in its photonic and quantum optics technology.
Below, we take a closer look at Quantum Computing’s chart and apply technical analysis to identify major price levels worth watching out for.
Rectangle Formation Breakout
After retracing to the 200-day moving average (MA), Quantum Computing shares trended higher before forming a rectangle, a chart formation signaling a continuation of the stock’s longer-term strong uptrend.
That move higher started earlier this week, with the stock breaking out from the formation on the highest daily trading volume since mid-December. Moreover, the relative strength index confirms bullish price momentum, though the indicator also flashes overbought conditions, potentially leading to short-term pullbacks.
Let’s point out two major overhead areas on Quantum Computing’s chart to watch if the stock continues to climb and also identify key support levels worth monitoring during future retracements.
Major Overhead Areas to Watch
Near-term strength could initially lift the shares to around $27. This area on the chart may provide overhead resistance near the stock’s prominent December peak.
Investors can project an overhead area to watch above the December high by using the measured move technique, also known by chart watchers as the measuring principle.
When applying the analysis to Quantum Computing’s chart, we calculate the percentage change of the uptrend that immediately preceded the rectangle and add it to the formation’s top trendline value. For example, we apply a 150% increase to $15, which projects a target of $37.50. representing nearly 100% upside from Wednesday’s closing price.
Key Support Levels Worth Monitoring
Retracements in the stock could see the price revisit support around $15. Investors would likely look for “buying the dip” opportunities in this area near the rectangle formation’s top trendline.
Finally, selling below this level could trigger a drop to $9. Quantum Computing shares find a confluence of support at this location near the upward sloping 50-day MA and a trendline that links a range of price action on the chart stretching back to last November.
The comments, opinions, and analyses expressed on Investopedia are for informational purposes only. Read our warranty and liability disclaimer for more info.
As of the date this article was written, the author does not own any of the above securities.
CD rates continue to be unpredictable, with four improved offers joining our term leaderboards since last Tuesday, including today’s new 6-month certificate from Rising Bank promising 4.51% APY.
The nation-leading CD rate continues to be 4.60%, available from Newtek Bank for a 9-month term that locks your APY until March 2026.
Following the overall leader and the new 4.51% certificate, 16 CDs offer 4.50%, with terms as short as 3 months—from PonceBankDirect—or as long as 21 months from PenAir Credit Union.
Alternatively, you can secure 4.28% to 4.32% for 3 to 5 years.
While the Fed isn’t likely to cut rates soon, reductions could arrive later this year.
Below you’ll find featured rates available from our partners, followed by details from our ranking of the best CDs available nationwide.
4.60% for 9 Months or 4.50% Until March 2027
Today’s best CD rate in the country comes from Newtek Bank, which is paying 4.60% on a 9-month term, extending your rate lock into 2026. It’s one of four CDs that have joined top APY slots in the past eight days. The other three are today’s new addition of a 6-month offer from Rising Bank guaranteeing 4.51%, a 4.45% 12-month CD unveiled yesterday by T Bank, and the PenAir certificate mentioned below that leads in the 2-year term.
To view the top 15–20 nationwide rates in any term, click on the desired term length in the left column above.
All Federally Insured Institutions Are Equally Protected
Your deposits at any FDIC bank or NCUA credit union are federally insured, meaning you’re protected by the U.S. government in the unlikely case that the institution fails. Not only that, but the coverage is identical—deposits are insured up to $250,000 per person and per institution—no matter the size of the bank or credit union.
Consider Longer-Term CDs To Guarantee Your APY Further Into the Future
Want a longer rate lock at a slightly lower rate? You can stretch your savings until December 2027 with a 30-month offer from Genisys Credit Union that guarantees 4.32% APY.
Savers who can sock their money away for even longer might like the leading 4-year or 5-year certificates. You can snag a 4.28% rate for 4 years from Lafayette Federal Credit Union. In fact, Lafayette promises the same 4.28% APY on all its certificates from 7 months through 5 years, letting you secure that rate as far as 2030.
Multiyear CDs are likely smart right now, given the possibility of Fed rate cuts later in 2025, and perhaps also in 2026. The central bank lowered the federal funds rate by a full percentage point last fall and could restart rate cuts in the coming months. While any interest-rate reductions from the Fed will push bank APYs lower, a CD rate you secure now will be yours to enjoy until it matures.
Today’s Best CDs Still Pay Historically High Returns
It’s true that CD rates are no longer at their peak. But despite the pullback, the best CDs still offer a stellar return. October 2023 saw the highest CD rates push briefly to 6%, while today’s leading rate is 4.60%. But compare that to early 2022, before the Federal Reserve embarked on its fast-and-furious rate-hike campaign. The most you could earn from the very best CDs in the country ranged from just 0.50% to 1.70% APY, depending on the term.
Jumbo CDs Beat Regular CDs in 4 Terms
Jumbo CDs require much larger deposits and sometimes pay premium rates—but not always. In fact, today’s best jumbo CD rates only out-pay the top standard rate in four of the eight CD terms we track. That means it’s smart to always check both types of offerings when CD shopping, and if your best rate option is a standard CD, simply open it with a jumbo-sized deposit.
Institutions are offering higher jumbo rates in the following terms:
18 months: Hughes Federal Credit Union is paying 4.50% on a 17-month jumbo certificate vs. 4.30% for a standard 18-month CD.
3 years:Hughes Federal Credit Union offers 4.34% for a 3-year jumbo CD vs. 4.32% for the highest standard rate.
5 years: Both GTE Financial and Lafayette Federal Credit Union offer 4.33% for jumbo 5-year CDs vs. 4.28% for the highest standard rate.
In the 1-year term, meanwhile, the top standard and jumbo CDs pay the same rate of 4.50% APY.
*Indicates the highest APY offered in each term. To view our lists of the top-paying CDs across terms for bank, credit union, and jumbo certificates, click on the column headers above.
Where Are CD Rates Headed in 2025?
In December, the Federal Reserve announced a third rate cut to the federal funds rate in as many meetings, reducing it a full percentage point since September. But following its announcement last month, the central bank has opted to hold rates steady at all three of its 2025 meetings to date.
The Fed’s rate cuts last year represented a pivot from the central bank’s historic 2022–2023 rate-hike campaign, in which the committee aggressively increased interest rates to combat decades-high inflation. At its 2023 peak, the federal funds rate climbed to its highest level since 2001—and remained there for nearly 14 months.
Fed rate moves are significant to savers, as any reductions to the fed funds rate will push down the rates that banks and credit unions are willing to pay consumers for their deposits. Both CD rates and savings account rates reflect these changes to the fed funds rate.
Time will tell what exactly will happen to the federal funds rate in 2025 and 2026—as tariff activity from the Trump administration has paused the Fed’s course as policymakers await clear data. But with more Fed rate cuts possibly arriving later this year, today’s CD rates could be the best you’ll see in a while—making now a smart time to lock in the best rate that suits your personal timeline.
Daily Rankings of the Best CDs and Savings Accounts
We update these rankings every business day to give you the best deposit rates available:
Important
Note that the “top rates” quoted here are the highest nationally available rates Investopedia has identified in its daily rate research on hundreds of banks and credit unions. This is much different than the national average, which includes all banks offering a CD with that term, including many large banks that pay a pittance in interest. Thus, the national averages are always quite low, while the top rates you can unearth by shopping around are often 5, 10, or even 15 times higher.
How We Find the Best CD Rates
Every business day, Investopedia tracks the rate data of more than 200 banks and credit unions that offer CDs to customers nationwide and determines daily rankings of the top-paying certificates in every major term. To qualify for our lists, the institution must be federally insured (FDIC for banks, NCUA for credit unions), the CD’s minimum initial deposit must not exceed $25,000, and any specified maximum deposit cannot be under $5,000.
Banks must be available in at least 40 states. And while some credit unions require you to donate to a specific charity or association to become a member if you don’t meet other eligibility criteria (e.g., you don’t live in a certain area or work in a certain kind of job), we exclude credit unions whose donation requirement is $40 or more. For more about how we choose the best rates, read our full methodology.
Shares of Papa John’s jumped Wednesday on the news that the pizza chain might be taken private.
Papa John’s International (PZZA) stock finished the session up 7.5%, after rising as much as 15% earlier in the day to its highest level since November. A Semafor report said that asset manager Apollo and Irth Capital Management have bid to take the company private in a deal valuing it at about $2 billion. Papa John’s market capitalization is around $1.6 billion, according to Visible Alpha.
Irth Capital, which is associated with Qatar’s royal family, as well as Apollo and Papa John’s, did not respond to Investopedia’s requests for comment in time for publication.
Papa John’s in early May reported first-quarter North American comparable-store sales that were down year-over-year. Its shares’ value has risen more than a quarter this year, climbing off April lows.
Google extended buyout offers to more employees this week, marking the latest move by Big Tech firms to lower headcounts.
It may not be the last, as companies face pressure to reduce spending amid macroeconomic uncertainty.
Microsoft, Amazon, and Intel are among others that recently announced or are reportedly planning cuts.
Google extended buyout offers to more employees this week, marking the latest move by Big Tech firms to lower headcounts. It may not be the last, as companies face pressure to reduce spending amid an uncertain economic environment, while also investing in AI infrastructure.
Tech has seen an exodus in 2025. The sector has announced nearly 75,000 job cuts in 2025 as of the end of May, according to a report last week from Challenger, Gray & Christmas, up from about 55,000 cuts in the same period in 2024.
Within the last two months alone, reports emerged that Microsoft (MSFT) is looking to cut 3% of its global workforce, or roughly 7,000 jobs, and Amazon (AMZN) reportedly trimmed about 100 jobs in its devices and services unit. Intel (INTC) intends to cut a whopping 20% of its workforce this year, as the embattled chipmaker attempts to turn around its business.
Another factor at play is huge AI infrastructure investments announced by Microsoft, Alphabet and others. That spending puts greater pressure on profit margins, D.A. Davidson analyst Gil Luria told Investopedia, meaning companies “are either keeping lower levels of hiring for personnel, or even sometimes taking action to reduce personnel.” Advancements also make it possible for companies to rely on smaller teams of software developers, Luria added.
Microsoft, for example, has said it plans to spend $80 billion in capital expenditures this year. Luria estimates that for every year Microsoft invests at current levels, there are 10,000 positions the company could have to either let go unfilled or cut.
Written by Steven Dooley, Head of Market Insights, and Shier Lee Lim, Lead FX and Macro Strategist
Trade FX lower despite deal
The US dollar weakened across markets after lower-than-expected US inflation data, but positive news on the US-China trade deal failed to lift equity markets or the Australian dollar.
The annual US inflation rate for May was 2.4%, in line with forecasts, while the core inflation rate came in at 2.8%, below the expected 2.9%. Both monthly readings also missed forecasts, causing the US dollar to drop.
The bigger news came from US-China trade talks, with President Trump announcing on social media: “Our deal with China is done, subject to final approval with President Xi and me.” Commerce Secretary Howard Lutnick expects final details to be completed in the coming days, although the agreement is unlikely to be made public.
Despite the announcement, trade-sensitive markets didn’t benefit. US stocks fell, with the S&P 50 down 0.3% and the Nasdaq losing 0.5%.
In currency markets, trade-exposed currencies like the Australian and New Zealand dollars fell. The AUD/USD dropped 0.3%, reversing after testing resistance above 0.6500, while NZD/USD fell 0.4%. Meanwhile, USD/CNH and USD/CAD both edged up 0.1% as the Chinese yuan and Canadian dollar eased.
The US dollar weakened elsewhere, with USD/SGD down 0.2%, nearing its lowest level since October 2014. EUR/USD and GBP/USD gained, with the euro the best overnight, while USD/JPY declined.
USD/SGD at decade lows as Bessent gains momentum in Fed Chair race
US Treasury Secretary Scott Bessent is emerging as a top contender to replace Jerome Powell as Federal Reserve Chair, according to Bloomberg.
With Powell’s term ending in May 2026, President Trump has pledged to name a successor well in advance. However, Bloomberg reports that interviews for the role have yet to begin, keeping markets uncertain.
Bessent’s potential nomination is already affecting the US dollar, as traders anticipate his approach to monetary policy.
In Asia-Pacific markets, the US dollar’s continued weakness has pushed USD/SGD toward decade lows, where buyers may soon step in.
At the time of writing, USD/SGD is hovering at 1.2864, with key resistance at the 21-day EMA of 1.2911, followed by the 50-day EMA of 1.3025—levels that could shape the pair’s next move.
RBNZ Governor Orr’s resignation raises concerns for NZD
Newly released documents reveal that former Reserve Bank of New Zealand Governor Adrian Orr resigned in March due to government funding cuts, contradicting earlier speculation that his departure stemmed from a dispute over bank capital rules.
Orr abruptly stepped down on 5 March, cutting short his second five-year term with three years remaining.
From a technical perspective, NZD/USD is hovering above the key psychological support level of 0.6000. The next critical support levels are at the 21-day EMA of 0.5987, followed by the 50-day EMA of 0.5923.
Euro surges in Asia
Table: seven-day rolling currency trends and trading ranges
*The FX rates published are provided by Convera’s Market Insights team for research purposes only. The rates have a unique source and may not align to any live exchange rates quoted on other sites. They are not an indication of actual buy/sell rates, or a financial offer.
The average median monthly housing cost is increasing for homeowners, even as the price tag on homes has declined, according to the most recent month-over-month data analyzed by Investopedia. One factor behind the trend? Rising interest rates.
Key Takeaways
Median monthly housing cost rose to $2,412 in May, up $16 from April
The Investopedia Home Affordability Index slipped to 0.86
Household income needed to afford a median-priced home rose to $8,040 per month
The affordability gap widened to $1,094, the largest since January
The median monthly housing cost for homeowners rose $16 to $2,412 in May, up from April’s reading of $2,396, according to data calculations. Meanwhile, the housing cost-to-income ratio worsened slightly to 34.73% (from 34.66%), and Investopedia’s Home Affordability Index slipped to 0.86 (from 0.87) during that time period.
Important
The Investopedia Home Affordability Index is an ongoing look at home affordability in the United States. We collect home price, mortgage rate, income, and other data, and calculate the current housing cost-to-income ratio, which shows the percentage of household income taken up by housing costs. A reading of 1.0 or better means housing is affordable. Readings below 1.0 mean housing is unaffordable.
While the median home price for April (the latest available reading) was down slightly (to $367,711 from $368,247 in March), average monthly mortgage interest rates increased, pushing the combined cost higher. Investopedia’s monthly payment figure includes principal, interest, taxes, and insurance for a median-priced home.
Housing Affordability
Affordability consists of three parts: income, cost, and the impact of housing costs on household budgets. Homeowners whose housing cost ratio exceeds 30% of their income are considered “housing cost burdened” by the federal government. Our affordability calculations use that same ratio.
The housing cost ratio stood at 34.4%, according to our recent analysis of trends in April compared to a month prior. This means that 34.4% of median household income was spent on housing, above the official 30% threshold for affordability.
The Investopedia Home Affordability Index shows the relationship between housing costs and income. A reading of 1.0 or better means housing is affordable. Readings below 1.0 mean housing is unaffordable.
Income Required to Make a Median-Priced Home Affordable
We also calculate the gross income required to afford a median-priced home. For May, that figure was $8,040 (up from $7,936 a month prior). In other words, a household would need to bring in $8,040 per month for median housing costs to consume 30% or less of income.
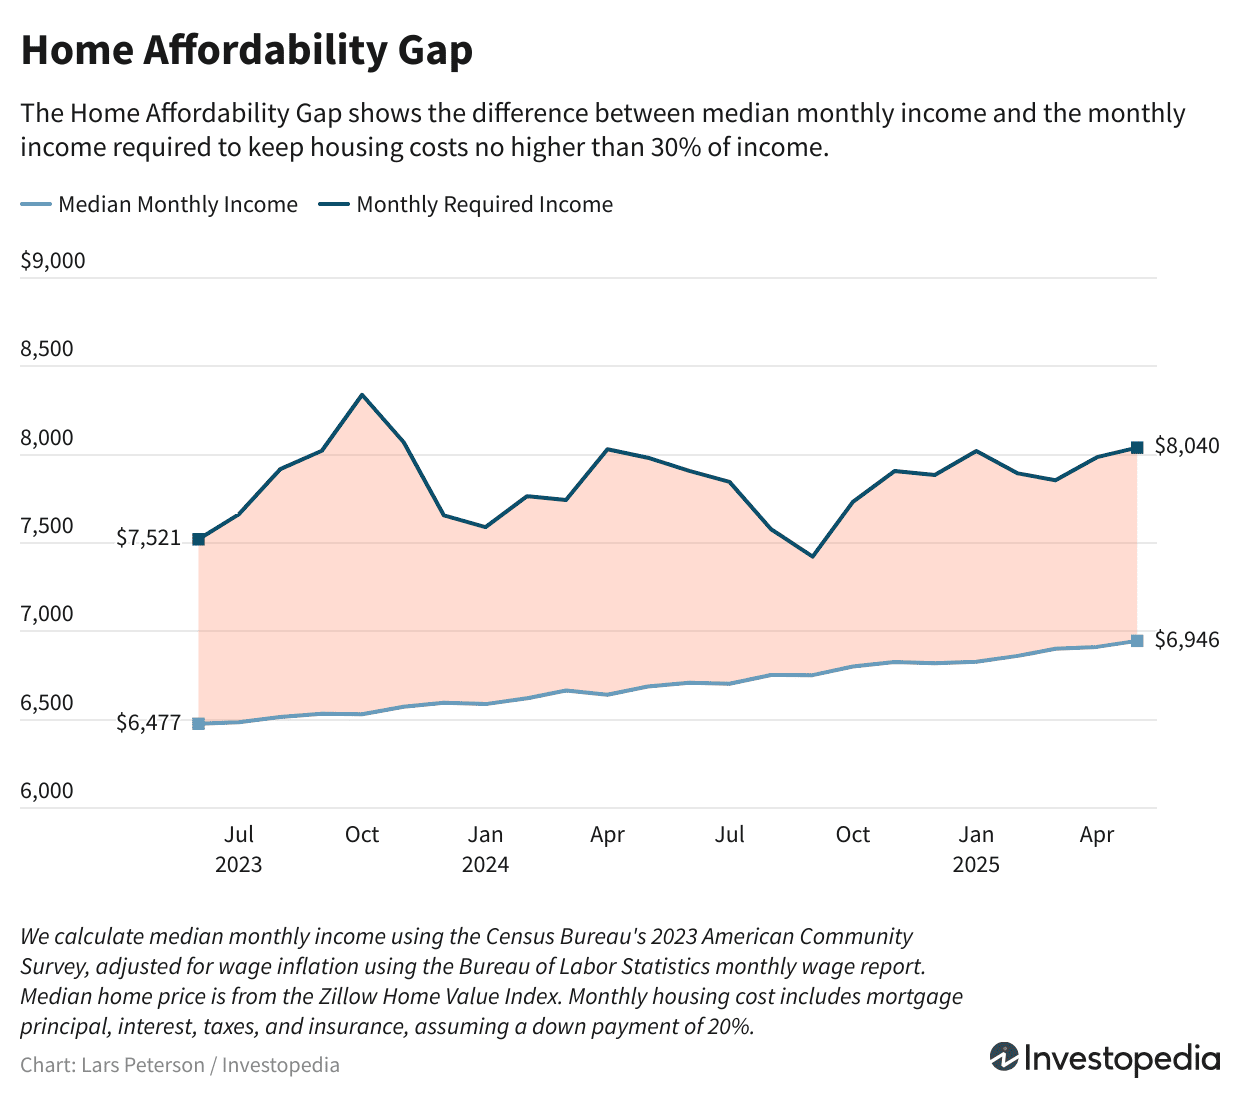
Home Affordability Gap
This measure shows the difference between median income and the income required to afford a median-priced home. Over time, the affordability gap widens and narrows as interest rates and home prices move with their markets while income rises steadily.
The home affordability gap for May was $1,094. In practical terms, a median-income household would need an extra $1,094 monthly to bring housing costs down to the 30% affordability threshold, leaving less for essentials like food, transportation, or financial goals like college or retirement.
The narrowest gap in our data was $620, recorded in September 2024 when mortgage rates hit their most recent low. On average, the gap has held at $1,152 since June 2023.
Tip
You can calculate the housing cost ratio for a home you own or want to buy. Simply divide your monthly housing payment (principal, mortgage, taxes, and insurance) by your monthly income. Prospective buyers can use our mortgage calculator to get an estimated payment for a house they want.
Housing Costs
Our affordability charts and indicators are derived from housing costs—median home price, average monthly interest rates, and additional housing costs like insurance and property taxes.
Date
Monthly Mortgage Payment (Principal & Interest)
Property Taxes
Insurance
Monthly Total Cost
2025-05
$1,961
$236
$215
$2,412
2025-04
$1,945
$236
$215
$2,396
Median Home Value
Principal and interest are the most significant parts of a homeowner’s housing costs. Median home value determines both. In April, the latest data available, the median home price dipped slightly to $367,711 from $368,247 a month prior.
Tip
If you’re looking for a home, see our collection of the Best Mortgage Lenders to help you shop for a mortgage.
Average Monthly Mortgage Rates
April’s modest decline in median home price may have led to lower monthly housing costs and an improvement in affordability; however, higher mortgage interest rates that month more than offset that factor.
Important
Getting multiple quotes is essential when shopping for a home loan. In fact, according to a report by Freddie Mac, borrowers who seek at least four quotes have an average annual savings of about $600 to $1,200. Another study by the Federal Reserve Bank of Philadelphia said that seeking at least one additional rate quote results in an 18-basis-point rate reduction and a 28-point reduction for lower-income borrowers.
Other Housing Costs
We include estimates for homeowners’ insurance and property taxes that add about $450 to monthly housing costs.
Income
The last piece of the affordability puzzle is household income. For May, it stood at $6,946, $34 better than the previous month’s figure of $6,912.
Methodology
We collect data from several sources to find the housing cost ratio and generate our home affordability index.
Median Home Price
We rely on the national Zillow Home Value Index for home price data. We chose Zillow’s data because it is updated frequently and includes a range of housing types (single-family homes, condos, co-ops).
Average Mortgage Interest Rates
We average mortgage rates from Investopedia’s daily reporting based on Zillow’s rate data. The rates quoted in our sample are based on an LTV of 80% or less (a down payment of at least 20% of the home’s sales price) and an applicant credit score range of 680-739.
Other Housing Costs
We estimate the costs of property tax and homeowners’ insurance. For property tax we take an average of the property tax rates levied by each U.S. state and compiled by the Tax Foundation. For homeowners’ insurance, we use the monthly estimate from Insurify.
Median Monthly Income
We derive median monthly income from household income from the Census Bureau’s American Consumer Survey (ACS) (2023) and Average Weekly Earnings from the Bureau of Labor Statistics (BLS). The ACS figure is the baseline; we calculate a wage inflation adjustment from the BLS’s earnings report and apply that to the ACS baseline.