Orderly hits $100B in trading volume as omnichain liquidity demand surges


Orderly hits $100B in trading volume as omnichain liquidity demand surges

Key takeaways:

  • Orderly’s permissionless liquidity layer has processed over $100 billion in total trading volume.
  • More than 30 decentralized exchanges and DeFi protocols have integrated Orderly’s liquidity infrastructure.
  • The platform supports 10+ blockchain networks, including Arbitrum, Base, Polygon, and Solana.

Orderly’s unified liquidity model drives record-breaking trading activity

Orderly, a cross-chain liquidity infrastructure provider, has reached a major milestone, surpassing $100 billion in cumulative trading volume. The surge in demand comes as more decentralized exchanges (DEXs) and DeFi protocols tap into Orderly’s omnichain liquidity network, which aggregates liquidity across multiple blockchains to offer deeper order books and reduced slippage.

The liquidity layer, which facilitates trading on over 110 markets, has seen daily trading volumes spike to $1.8 billion during peak periods. Orderly’s architecture allows emerging DEXs to access institutional-grade liquidity from day one, making it a preferred solution for projects launching on both established and emerging blockchain networks.

“While we knew this day was coming, it’s nevertheless gratifying to have broken $100B in cumulative volume, which is a testament to the dozens of partners who’ve integrated us by leveraging the Orderly SDK to enable boundless liquidity for their users.” — Orderly Co-Founder Ran Yi

Growing liquidity infrastructure sets the stage for wider adoption

Orderly’s trading volume is spread across more than 10 blockchain ecosystems, including EVM-compatible networks and high-performance chains like Solana. Recent integrations include Berachain, Monad, and Story, highlighting the platform’s ability to support emerging blockchains looking to bootstrap liquidity.

The network is backed by 20+ top-tier market makers, including Wintermute, Selini, and Riverside, ensuring that traders using Orderly-powered platforms benefit from tight spreads and minimal slippage. Notably, Raydium, a leading Solana-based DEX, has expanded its reliance on Orderly for its perpetual markets.

With a centralized exchange (CEX)-level trading experience and fully decentralized infrastructure, Orderly is rapidly positioning itself as the go-to liquidity solution for Web3 trading platforms.


Source link

DocuSign Stock Jumps as Results Top Estimates on ‘Rapid Traction’ Of AI Platform


Key Takeaways

  • DocuSign shares jumped Friday after the technology company reported better fourth-quarter earnings than analysts had expected.
  • Revenue and adjusted earnings per share each rose from the same time last year.
  • The electronic signature software maker said it is seeing “rapid traction with customers” for its new AI-powered contract management platform.

Shares of DocuSign (DOCU) surged Friday morning after the electronic signature company topped analysts’ estimates for the final quarter of fiscal 2025.

On Thursday, DocuSign reported adjusted earnings per share of $0.86, a cent better than expectations, on $776.25 million in revenue, about $15 million above the analyst consensus compiled by Visible Alpha. In the same quarter a year ago, DocuSign recorded adjusted EPS of $0.76 on revenue of $712.39 million.

CEO Allan Thygesen said the company is seeing “rapid traction with customers” with its artificial-intelligence powered Intelligent Agreement Management platform it launched last year. DocuSign announced the product last April, saying it would help customers save time and money by creating, organizing, and analyzing contracts more efficiently.

DocuSign forecasted first-quarter revenue of $745 million to $749 million and full-year revenue of $3.13 billion to $3.14 billion, each below the analyst consensus. However, the company’s projected billings revenue of $741 million to $751 million for the first quarter and $3.3 billion to $3.35 billion for the full year were each in line or better than estimates.

Shares of the technology company were up more than 15% Friday morning and have gained around 50% over the last 12 months.


Source link

The Shortcut for Finding the World’s Best Businesses


Think of a stock’s dividend history as a “cheat sheet” for assessing whether it’s worth your money

You can spend a lot of time searching for stocks to buy.

You can study for hours and learn how to analyze stock charts and corporate balance sheets. You can spend hours going over financial statements.

But if you’re like a lot of people, you don’t have the interest or the time. You’ve got a job and a family, and they keep you busy.

The good news is there’s a shortcut around doing all that work.

You can simply look for businesses that have increased their dividends for at least 10 years in a row.

Remember, dividends are cash payments distributed to a company’s shareholders. Only businesses with durable competitive advantages can pay increasing dividends for more than a decade (on top of all their other financial obligations).

Out of the more than 5,000 publicly traded businesses, less than 5% of them meet this high standard of quality.

These businesses are the beachfront real estate of the stock market.

Some legendarily profitable and stable members of the “dividend raiser” club include:

  • Johnson & Johnson (NYSE:JNJ)
  • McDonald’s (NYSE:MCD)
  • Automatic Data Processing (NASDAQ:ADP)
  • IBM (NYSE:IBM)
  • PepsiCo (NASDAQ:PEP)
  • 3M (NYSE:MMM)
  • Wal-Mart (NYSE:WMT)
  • Procter & Gamble (NYSE:PG)
  • Coca-Cola (NYSE:KO)
  • Chevron (NYSE:CVX)
  • ExxonMobil (NYSE:XOM)

The longer the string of consecutive dividend increases, the more impressive it is. Only truly fantastic business with durable competitive advantages can increase their dividends for 20, 30, or even 40 consecutive years.

As of 2019, discount retailer Wal-Mart has increased its dividend payment every year for 44 years. Oil giant ExxonMobil has increased its dividend payment every year for 36 years. Soft-drink giant Coca-Cola has increased its dividend payment every year for 56 years.

These businesses paid and increased their dividends through recessions, government shutdowns, wars and real estate busts. They paid their dividends during the dot.com bust. They paid their dividends during the 2008–2009 financial crisis — the ultimate dividend “stress test.”

In terms of consistency, these firms rank just behind the rising sun.

Companies with more than 10 or 20 years of consecutive dividend increases are the strongest, safest companies in the world. Many of these firms sell “basic” products like medicine, soda, food, candy, cigarettes, toothpaste and deodorant.

Ordinary companies can’t raise their dividends for 10 or 20 consecutive years. In fact, they probably won’t even exist that long. This is because their business models are shaky, unpredictable and vulnerable to competition.

The average investor will spend lots of time chasing hot tips from brokers, coworkers and relatives. He’ll chase “get rich quick” schemes. He’ll try to pick stocks based on chart patterns. He’ll stay up at night worrying about the risky stocks he owns.

It’s bizarre behavior when you realize there is a group of elite, dividend-paying businesses available to him. He’s choosing SPAM over filet mignon.

Instead of owning risky stocks, I like the predictability of owning robust, reliable businesses like McDonald’s and Coca-Cola.

I can’t pick the next hit website, the next miracle drug, or the next retail fad — but I know it’s very, very likely that folks will keep eating burgers, drinking soda, and brushing their teeth.

Again, you can spend lots of time learning how to analyze business… you can spend a lot of time searching for them. Or, you can simply “weed out” over 99% of stocks by focusing on companies with long strings of consecutive dividend increases.

Several of these lists are compiled each year. One is called “Dividend Achievers.” It’s the list compiled by NASDAQ of companies that have increased their dividends for at least 10 consecutive years. As of 2019, there were 264 members of this list.

Another list is called “Dividend Aristocrats.” It’s the list of S&P 500 companies that have increased their dividends for 25 consecutive years. As of 2019, there are only 57 members of this list.

You can think of these lists as “cheat sheets” for finding the world’s best businesses.

You work hard for your money. Don’t abuse it by investing in low-quality businesses.

Instead of buying unproven business based on whims, chart patterns, and hot tips, demand quality from the businesses you buy.

One of the greatest indicators of business quality is at least 10 years of consecutive dividend increases. This is the blue ribbon worn by the best public businesses.

Over at Profitable Investing, my friend Neil George has done more “due diligence” on this than the folks at NASDAQ or S&P Dow Jones.

And of the many stocks Neil covers, he recommends just a handful of stocks that have raised their dividends for 10 years or more, plus meet Neil’s other criteria. Click here to find out more about Neil and how he picks stocks.

Regards,

Brian

P.S. Once a particular “dividend raiser” catches your eye, the next step is to consider the price. Too many investors think you have to pay up for great investments. That just isn’t true. And I’ve got a simple strategy to buy elite stocks at bargain prices.


Source link

Trade war sends stocks into correction – United States


  • The S&P 500 has entered correction territory, down 10% from its February peak, wiping out $5 trillion in value. With economic slowdown concerns rising, there is an increasing risk that this correction could turn into a bear market.
  • February inflation came in lower than expected (headline CPI at 2.8%, core CPI at 3.1%), briefly halting the stock selloff. However, one-off factors played a major role, and businesses are raising prices ahead of potential tariffs.
  • President Trump announced a 200% tariff on European wine, champagne, and spirits while maintaining steel and aluminum duties. Canada and the EU are retaliating, increasing fears of a trade war that could weigh on economic growth.
  • Markets expect the Fed to hold rates at 4.5% until June, but with inflation lingering and economic sentiment worsening, next week’s FOMC decision will be key. Powell’s comments on the rate outlook could determine the dollar’s direction
  • Russian President Putin hinted at the possibility of renewed energy cooperation with the US, causing European natural gas prices to drop. This speculation comes as Trump pushes for an end to the war in Ukraine
  • UK GDP shrank 0.1% in January, missing expectations and signaling continued economic stagnation. Despite this, the Bank of England is expected to hold rates at 4.5% due to persistent inflation risks, keeping pressure on UK assets
  • The US dollar rebounded after a 7-day losing streak but remains down 5% from its 2025 peak, caught between trade-related volatility and Fed rate expectations.
Chart: Equities hit by broad wave of uncertainty.

Global Macro
Another week adding to global complexity

Correction. Investors continue to display a cautious stance amid tariff uncertainty and macro ambiguity. It isn’t surprising to see that the market rout resumed this week, sending the S&P 500 into correction territory as equities continued their three-week slide. The equity index is now down 10% from its February peak, equating to around $5 trillion of value lost. Around a quarter of all corrections turn into bear market, a scenario that increases in likelihood when the economy is slowing down such as now.

Cooler inflation, for now. A surprisingly cool set of February US consumer price inflation prints m/m pulled the annual rate of headline inflation down to 2.8% from 3% while core inflation dips to 3.1% from 3.3%. This halted the stock selloff that had put the S&P 500 on the verge of a correction. The details are less rosy though with a substantial 4% m/m drop in air fares (highly volatile) the main factor driving the softer inflation readings. Moreover, there’s brewing anecdotal evidence of firms pre-emptively raising prices ahead of potential tariffs with this week’s NFIB survey reporting a 10-point jump in the proportion of companies raising prices.

Focus on tariffs. Despite a softer US inflation print earlier in the week, escalating trade tensions weighed heavily on sentiment. President Trump announced a potential 200% tariff on European wine, champagne, and spirits, doubling down on trade tensions just a day after vowing to keep steel and aluminum duties in place.

Fed to remain cautious. Market pricing now suggests the Federal Reserve will stay put until June, though persistent inflation and deteriorating sentiment are complicating the policy path. Next week’s Fed decision and economic projections will be crucial, as investors look for clarity on how officials will balance stubborn inflation with weakening economic momentum.

Floating a deal. Natural gas futures plunged after Russian President Vladimir Putin floated the possibility of renewed energy cooperation with Washington. Speaking in Moscow, Putin suggested that if the US and Russia reached a deal on energy, pipeline gas to Europe could be restored. This speculation comes as US President Donald Trump intensifies his efforts to broker an end to the war in Ukraine, leading some to wonder whether energy trade restrictions might be loosened as part of a broader peace framework.

Tit-for-tat. President Trump’s latest tariff escalation has further rattled financial markets. Trump announced he would double planned steel and aluminum tariffs on Canada to 50% in response to Ontario’s tax hike on electricity exports. The administration has also announced a potential 200% tariff on European wine, champagne, and spirits. Canada and the EU are responding accordingly in a sign that the global trade war is ratcheting up. President Trump made it clear that he intends to retaliate against the EU’s countermeasures once again. This tit-for-tat will raise the already elevated tensions between both regions and could limit the upside on the euro for now.

UK wobble. The UK economy shrank 0.1% in January on a monthly basis, versus an expected expansion of 0.1% and markedly lower than December’s 0.4% print. However, the 3-month rolling average ticked up from 0.1% to 0.2%. It’s still a blow to the UK’s Labour party that has pledged to bring an end to over a decade of stagnation. Despite the slowing UK economy, the Bank of England is expected to keep its Bank Rate on hold at 4.5% next week due to growing inflationary risks.

Week ahead
Central banks convene

Next week’s market action will be dominated by central bank decisions and key sentiment data, with the Federal Reserve (FOMC), Bank of Japan (BoJ), Bank of England (BoE), and Swiss National Bank (SNB) all set to announce rate decisions.

The FOMC decision on March 19 will be the highlight of the week, with the Fed widely expected to keep rates unchanged at 4.5%. However, Chair Jerome Powell’s guidance will be key, as markets seek clarity on when rate cuts may begin.

Recent inflation readings suggest price pressures are moderating but remain above target, leaving the Fed in a difficult position. If Powell signals a later start to rate cuts, the US dollar could strengthen, while equities might face renewed pressure.

In Europe, the focus will be on inflation, as Eurozone CPI figures (March 19) will reveal how price trends are evolving. While headline and core CPI are expected to hold steady at 2.4% and 2.6% y/y, any surprises could influence ECB rate expectations.

Meanwhile, the BoE rate decision (March 20) is expected to keep rates at 4.5%, but UK labor market data coming out earlier that day should swing sentiment towards on or the other direction within the Board.

The only sentiment data for Europe will come in the form of the ZEW and European Commission surveys. They could show a significant uptick in business confidence due to the fiscal plan announced in Germany. The boost will be needed if the euro wants to maintain its upward trajectory.

Table: Key global risk events calendar.

FX Views
Consolidation amidst competing narratives

USD Searching for a bottom. The US dollar index snapped a 7-day decline earlier this week as European FX softened on trade policy uncertainty. The dollar remains close to pre-election levels though, still down over 3% on the month and over 5% from its 2025 peak. The US dollar remains caught between trade-related volatility, Fed repricing, and shifting risk sentiment. While the Trump administration’s aggressive stance on tariffs could provide short-term safe-haven support, investors are increasingly focusing on the longer-term economic damage. If trade uncertainty continues to weigh on equities and growth, the dollar’s safe-haven bid may not be enough to offset structural headwinds. With Trump’s tariff deadline fast approaching and recession risks climbing, next week’s Fed guidance could be the deciding factor in whether the dollar extends its recent slide or stages a comeback. In the very short-term – the upcoming US retail sales data on Monday poses a downside risk to the dollar if a rebound fails to materialize.

EUR Softens on trade war fears. The euro extended its gain to $1.0947 this week, briefly erasing all of its post-US election losses. With US growth scares and unwinding of Trump trades weighing on the dollar, and higher European spending proposals boosting European growth prospects and yields, the pair recorded its biggest weekly gain (4.5%) since 2009 at the start of March. Momentum has unsurprisingly waned though amidst fresh uncertainty surrounding trade and energy policy. With tariff threats still unresolved and economic risks lingering, EUR/USD remains stuck between competing narratives—fiscal optimism on one side, external uncertainty on the other. There is scope for EUR/USD to reclaim the levels of around $1.11 that prevailed before the markets started front-running the idea of the Trump trade though. In fact, real rate differentials suggest $1.15 could be on the cards later this year. A key obstacle to this is the escalating trade war, but we think if a German fiscal deal is achieved next week, EUR/USD should continue scaling higher.

Chart: Euro erases post election losses; dollar erases gains

GBP Eyes on the $1.30 prize. Sterling climbed to a fresh 2025 peak of $1.2988 on Wednesday, within a whisker of the key $1.30, before retracing as tariff headlines hit risk sentiment. GBP/USD is still almost 3% up month-to-date, and almost two cents above its 5-year average of $1.28, and the pair has dipped out of the overbought zone indicated by the 14-day relative strength index. Aside from improving UK growth and rate differentials relative to the US favouring the pound, the strong positive correlation between EUR/USD and GBP/USD should help the sterling’s uplift against the dollar. But the euro’s strength doesn’t bode well for GBP/EUR. The pair did snap a run of six consecutive daily losses though as focus turned to EU-US trade war risks following the EU’s retaliation to US tariffs. However, GBP/EUR is down 1.6% this month and if it closes the week below its 50-week moving average support level, we think a slide towards €1.1740 is feasible over the coming month. Otherwise, the pair might stay bound to a tight range given real rate differentials suggests €1.19 is fair value. Coming up, the Bank of England is expected to keep its Bank Rate on hold at 4.5%, so volatility may arise from a surprise vote split or tone of messaging.

CHF 8-month lows versus euro. The big news from Switzerland of late is that it has been put on a list of countries with “unfair trade practices” by the US due to its positive balance of trade in goods. The growth forecasts for the Swiss economy have since been revised downwards by some economists from 1.4% to 1.2% for 2025. Though this hasn’t directly hit the franc in a negative way, it highlights how no country is immune to Trump’s tariff policies, even Switzerland as one of the most open and fair-trading nations in the world. USD/CHF has stabilised at 0.88 after the previous week’s 3% drop. EUR/CHF on the other hand, hit a fresh 8-month high, breaking above key moving averages in a sign of a bullish trend reversal. Next week, the Swiss National Bank is expected to cut interest rates from 0.5% to 0.25%, which might further dampen demand for the lower yielding swissy. However, downside risk may be limited given its haven appeal amidst heightened geopolitical and trade policy uncertainty.

Chart: Euro re-rating has helped GBP/USD higher too.

CNY Negative outlook persists amid mixed trade data. China’s exports grew 2.3% y/y in January-February while imports contracted 8.4% y/y, creating a record trade surplus of nearly $171bn. The import decline signals persistently weak domestic demand despite government stimulus efforts. USD/CNH maintains a negative short-term outlook after rejection at the Ichimoku Cloud. Price action continues below the Cloud despite easing downward momentum. Resistance sits at 7.3039 with support at 7.2800 and downside potential toward 7.1475. The pair’s recent price action suggests sellers remain in control with rallies likely to be sold. Technically, the downtrend remains intact as long as price stays below the Cloud resistance. Key catalysts ahead include Chinese economic data releases on industrial production, retail sales, and the loan prime rate.

JPY Consolidation phase as Japan monitors inflation transition. Japan remains cautious about declaring deflation’s end, noting a transition from import-driven to wage-driven inflation. The economy shows signs of supply constraints rather than demand weakness. USD/JPY, now near six-month lows is consolidating after finding support in the 146.95-148.86 zone, with positive momentum divergence suggesting a potential rebound. The pair appears set to establish a trading range with key resistance at 151.30-152.27. Technical indicators point to oversold conditions, supporting the case for near-term stabilization. The recent decline’s decelerating momentum reinforces this outlook. The chart shows inverse correlation between Nasdaq and USD/JPY as the yen is typically a vehicle for global carry trade. Stronger Yen may contribute to the recent slowdown in AI-driven tech rally. The BoJ rate decision will be crucial for determining whether the current support holds or breaks.

Chart: US tech drives as Yen strengthens

CAD A tariff-driven rate cut by the BoC. The Bank of Canada’s rate cut decision was largely anticipated by the markets. A tariff-driven 25 bps cut had been expected, as the central bank highlighted concerns about an impending crisis with the implementation of steel and aluminum tariffs, along with countermeasures by the Canadian government, this week. A brief spat between President Trump and Ontario Premier Doug Ford introduced some volatility to the USD/CAD. Nevertheless, for most of the week, the Loonie traded within a narrow range despite the barrage of news and the prevailing risk-averse sentiment in the markets.

The USD/CAD posted a high of 1.4521 this week and a low of 1.434, marked by significant intraday swings that revealed strong resistance above 1.45, with no indication of easing below 1.43. The Loonie remains above the 20-, 40-, and 60-day SMAs, while implied volatility has dropped considerably. April 2nd will be a pivotal date to evaluate the broader trajectory of U.S. trade policy. President Trump’s advisors have differentiated between tactical tariffs, employed as negotiation tools to secure specific concessions, and structural tariffs, aimed at reshaping U.S. trade policy in the long term.

AUD Business sentiment retreats as base pattern forms. Australian business confidence turned negative in February, dropping 6 points to -1 amid persistent cost pressures. Purchase costs accelerated to 1.5% q/q while profitability remained in negative territory. AUD/USD shows signs of forming a medium-term base but needs to clear the 0.64 resistance to confirm this outlook. Support lies at the 50-day moving average (0.6305) and the 0.6157-0.6211 Fibonacci zone. Price action indicates potential upside if these support levels hold. The pair remains range-bound with an upward bias, showing resilience despite the softer domestic data. The next key resistance is at its 200-day moving average (0.6452). Watch for upcoming employment data which could provide the catalyst needed to challenge the critical 0.64 resistance level.

Chart: Surprisingly CAD implied volatility is among the lowest within G10 currencies

MXN Avoiding retaliatory measures. Mexico’s peso strengthened this week, outperforming most other emerging market currencies. Commerce Secretary Howard Lutnick commended Mexico for not engaging in retaliatory tariff hikes against the U.S.  On Wednesday, Mexican President Claudia Sheinbaum delayed any response to U.S. tariffs on steel and aluminum imports, opting to continue negotiations with the Trump administration. Lutnick also praised the UK and Mexico for avoiding tit-for-tat tariff escalations, contrasting them with other trading partners. He cautioned that countries provoking President Trump with retaliatory measures risk facing severe consequences. Mexican Peso has gained 3.5% versus the USD year to date, eyeing the 20-level support, as net short positioning unwinds against the Peso.

Chart: Markets aren't expecting tariffs will be imposed in Mexico

Have a question? [email protected]

*The FX rates published are provided by Convera’s Market Insights team for research purposes only. The rates have a unique source and may not align to any live exchange rates quoted on other sites. They are not an indication of actual buy/sell rates, or a financial offer.


Source link

U.S. Coin Production Reaches 581.6 Million in February 2025


CoinNews 2025 Ida B. Wells quarter
This CoinNews photo shows a 2025 Ida B. Wells quarter. The U.S. Mint has produced 203.65 million of them for circulation.

U.S. coin production slowed in February after reaching a three-month high in January, according to newly released United States Mint manufacturing data. Output remained below 1 billion coins for the 18th consecutive month, following a previous streak of eight months above that level.

The U.S. Mint struck 581.61 million coins for circulating in February – including cents, nickels, dimes, quarters, and half dollars – reflecting declines of 8.2% from January and 9.8% from February 2024.

Here’s how January’s production compares to previous months over the past year:

February 2024 to February 2025 Circulating Coin Production

Month Mintages Rank
February 2025 581.61 M 5
January 2025 633.56 M 3
December 2024 391.70 M 9
November 2024 602.90 M 4
October 2024 826.60 M 1
September 2024 486.00 M 6
August 2024 405.20 M 7
July 2024 235.20 M 12
June 2024 168.22 M 13
May 2024 396.08 M 8
April 2024 368.20 M 11
March 2024 332.70 M 10
February 2024 644.86 M 2


The U.S. Mint’s primary mission is to manufacture coins in response to public demand. It produces, sells, and delivers circulating coins to Federal Reserve Banks and their coin terminals, ensuring commercial banks and other financial institutions have the necessary supply.

Despite costing the Mint 3.69 cents to produce and distribute each penny, the Federal Reserve consistently orders more of them than any other denomination. In February, the Mint struck 353 million Lincoln cents, accounting for 60.7% of all circulating-quality coins produced for the month.

The future of the penny, however, is increasingly uncertain. On Feb. 9, President Trump ordered an end to its production, calling the move a step toward reducing “wasteful” government spending.

“For far too long the United States has minted pennies which literally cost us more than 2 cents,” Trump said in a Truth Social post. “This is so wasteful! I have instructed my Secretary of the US Treasury to stop producing new pennies. Let’s rip the waste out of our great nations budget, even if it’s a penny at a time,” Trump wrote.

Month-Over-Month

In month-over-month comparisons for coins commonly used by Americans, February production saw:

  • 45.6% more Lincoln cents,
  • 9.6% fewer Jefferson nickels,
  • 6.4% fewer Roosevelt dimes, and
  • 79.6% fewer quarters.

Mintages of Native American Dollars and Kennedy Halves

The U.S. Mint also produces other coins in circulating quality, including half dollars and dollars. While Native American $1 coins are no longer ordered by the Federal Reserve, they continue to be minted in circulating quality for collectors. The same applied to Kennedy half dollars until recent years – specifically in 2021, 2022, 2023, and 2024 – when they were released into circulation.

In many years, the U.S. Mint strikes both denominations in January to meet the expected demand for the entire year. However, that has not been the case for Kennedy half dollars over the past four years, as the Federal Reserve unexpectedly ordered millions more for circulation – approximately 12 million in 2021, 7 million in 2022, 18 million in 2023, and 52 million in 2024 (fiscal, not calendar years).

It remains uncertain whether any 2025 Kennedy half dollars will be released into general circulation. As of January, production figures indicated 3.6 million half dollars struck at the Denver Mint and 5.8 million at the Philadelphia Mint, totaling 9.4 million coins. February data showed an additional 2 million minted in Denver, raising its year-to-date total to 5.6 million and bringing the overall 2025 half dollar mintage to 11.4 million coins. By comparison, 2024 production reached 21.9 million from Denver and 15.7 million from Philadelphia, for a total of 37.6 million coins.

Mintage levels for 2025 Native American dollars were expected to remain unchanged after January, when 1.12 million were struck at both the Denver and Philadelphia Mints for a combined 2.24 million coins – the same total as in the previous two years. However, February data showed an increase to 3.08 million coins following the addition of 700,000 more minted at the Philadelphia Mint.

On Jan. 28, the U.S. Mint began selling rolls, bags, and boxes of 2025 Native American dollars. Collectors can expect rolls and bags of circulating 2025 Kennedy half dollars to become available on May 6.

The following table details 2025 circulating coin mintages in February by production facility, denomination, and design.

U.S. Mint Circulating Coin Production in February 2025

Denver Philadelphia Total
Lincoln Cent 163,000,000 190,000,000 353,000,000
Jefferson Nickel 28,560,000 45,600,000 74,160,000
Roosevelt Dime 59,500,000 57,000,000 116,500,000
Quarters 15,300,000 19,950,000 35,250,000
Kennedy Half-Dollar 2,000,000 0 2,000,000
Native American $1 Coin 0 700,000 700,000
Total 268,360,000 313,250,000 581,610,000


In total February production, the Denver Mint struck 268.36 million coins, while the Philadelphia Mint produced 313.25 million, bringing the combined output to 581.61 million coins.

For the year to date, the Denver Mint has struck 551.86 million coins, and the Philadelphia Mint has made 663.31 million coins, bringing the total to 1,215,170,000 coins. This is 37.9% fewer than the 1,400,840,000 coins manufactured during the first two months of 2024.

This next table lists coin production totals by denomination and by U.S. Mint facility:

YTD 2025 Circulating Coin Production by Denomination

1 ¢ 5 ¢ 10 ¢ 25 ¢ 50 ¢ N.A. $1 Total:
Denver 254.4M 72.24M 128M 99.5M 5.6M 1.12M 551.86M
Philadelphia 350M 84M 113M 108.55M 5.8M 1.96M 663.31M
Total 595.4M 156.24M 241M 208.05M 11.4M 3.08M 1215.17M


If the current production pace continues through December, the 2025 annual mintage would near 7.3 billion coins. For comparison, the U.S. Mint produced just over 5.6 billion coins for circulation in 2024, marking the lowest output since 2009.

Lastly, Mint data shows that 35.25 million quarters were struck in February, all reported as Ida B. Wells quarters. After adding January’s figures, quarters honoring Wells now total 97.3 million from Denver and 106.35 million from Philadelphia, for a combined 203.65 million. In January, the U.S. Mint also reported striking 4.4 million Juliette Gordon Low quarters, split evenly between the two facilities. The Wells and Low quarters are the 16th and 17th releases in the Mint’s 20-coin American Women Quarters™ series. More Low quarters will obviously be minted, and the same seems likely for Wells quarters, given their relatively low mintage compared to past issues. The lowest in the series so far is the 2024 Dr. Mary Edwards Walker quarter at 300.6 million. The Mint began selling Ida B. Wells quarters in early February, with Juliette Gordon Low quarters set for release on March 25.


Source link

Why Filing Your Taxes Early Could Save You Stress and Money


Many Americans approach filing taxes with trepidation. In fact, 64% of Americans report feeling stressed about tax season. The best way to alleviate tax-related stress is to take a deep breath and file your return early, however. You’ll lower your stress level and get your tax refund back faster if you get your return in well in advance of the April 15 deadline.

“Filing your taxes as soon as your documents are ready offers both financial and mental benefits. While many Americans procrastinate, taxes are inevitable so why hold on to unnecessary stress and mental fatigue? Filing early lifts that burden off your shoulders while also unlocking key tangible benefits,” says Zack Gutches, a certified public accountant and lead financial planner at True Riches Financial Planning.

Key Takeaways

  • You’ll get a quicker refund if you file your tax return early.
  • You’ll have more time to plan how you’ll pay your taxes if you prepare your taxes early.
  • Early tax preparers have more time to fix mistakes and they may save on tax preparation costs.
  • Filing early will help you avoid penalties and reduce stress.

Get Your Refund Faster

A big advantage of filing your taxes early is that you’ll get your tax refund more quickly if you’re due one.

“The IRS processes returns on a first-in, first-out (FIFO) basis, meaning the earlier you file, the sooner you’ll receive your refund,” Gutches says. “Instead of giving the government an interest-free loan, you can put your money to work sooner, whether that’s earning 4%+ in a high-yield savings account, investing in a money market fund, or allocating funds toward debt repayment, retirement savings, or college funding,”

There have been some concerns that tax refunds could be delayed in 2025 due to pending IRS budget and staff cuts, but the New York Times reported in February that any effect shouldn’t be significant if you e-file your return and it’s not flagged for errors. And it’s another good reason to file as early as possible in case the cuts do take effect.

More Time to Plan If You Owe

Nobody likes a tax bill but you’ll have more time to consider your options for paying if you prepare your taxes early.

“Even if you owe taxes, you don’t have to pay until April 15. Filing early gives you extra time to plan how you’ll cover the payment, whether that’s adjusting your budget, shifting funds, or identifying missed deductions, credits, or pre-tax retirement contributions to lower your tax bill,” Gutches says.

Protect Against Identity Theft

Another advantage to preparing your tax return early is that it helps to guard against identity theft.

“Tax-related identity theft is a growing issue,” Gutches says. “Fraudsters will attempt to file a return using your Social Security number before you do, claiming a refund in your name. Filing early helps block identity thieves from beating you to the punch.”

More Time for Corrections

You’ll give yourself time to catch and fix mistakes if you prepare your tax return well ahead of the April 15 deadline.

Filing early allows extra time to catch any mistakes or omissions. If you spot any errors on the return, taxpayers can fix them and finalize without the added stress of a looming deadline,” says Prudence Zhu, a certified public accountant and founder of Enso Financial.

You can submit an amended tax return to the IRS if you catch a mistake after you’ve filed your return.

Reduced Costs

You may catch a break on your tax prep costs by preparing your return early.

“Some preparers offer discounts for clients who submit their documents early, and tax software companies often provide promotional codes early in the filing season,” Zhu says. “On the other hand, if you file last minute, expect higher prices and limited service options. Tax preparers’ schedules fill up fast during tax season.”

Maximize Tax Benefits

Early tax preparers have more time to explore tax-saving benefits.

“By filing early, taxpayers have more time to strategize tax-saving opportunities such as making last-minute contributions to tax-advantaged accounts like IRAs or HSAs, which can lower taxable income. It also gives you time to explore any potential deductions or credits you might have missed,” Zhu says.

You can also submit an amended return to the IRS if you realize after you’ve filed that you’re eligible for a tax credit or deduction that you didn’t claim.

Avoid Penalties

File early and you won’t have to worry about late filing penalties.

“Filing early allows more time to prepare for payment, minimizing the risk of penalties and interest for late filing,” Zhu says.

The Bottom Line

Preparing taxes early saves you stress and money. File an early return, and you’ll receive your tax refund more quickly. You’ll give yourself more time to plan how you’ll pay the tax bill if you owe one, more time to explore tax benefits, and more time to correct errors. You’ll be able to avoid penalties for late filing by not leaving your return to the last minute and you may save money on tax prep costs.


Source link

How to Prepare Your Portfolio for a Recession – InvestorPlace


Humans are hardwired to pay close attention to potential dangers.

A hundred thousand years ago, it’s how we survived. Constantly worrying that a tiger or bear might be around the corner was a valuable instinct.

We may not encounter bears or tigers anymore, but our instincts remain a part of who we are. We still pay close attention to potential dangers.

A recession may be the potential danger that most frightens investors like us.

Recessions usually inflict some damage on portfolios, and at times they can be downright destructive. The economy and stock market always recover, but it can take some investors years or even decades to get back on track.

If you study the history of economic recessions in the United States, you see that almost all of them up until the Great Depression in 1929 were referred to as “panics.”

The Panic of 1873… the Panic of 1893… the Panic of 1907.

Those all resulted in runs on banks, because depositors feared their financial institutions would not be able to fulfill withdrawal requests. These panics led to the formation of a national bank in 1913, which we know today as the Federal Reserve System.

Bank runs are not much of a thing anymore, but we do see panic selling in the market whenever fear overcomes investors:

  • Fear of inflation.
  • Fear of rising interest rates.
  • Fear of war, trade disputes, and other global socioeconomic events.
  • And, ultimately, fear of a recession.

Even hints or speculation of a recession looming on the horizon are enough to scare the wits out of investors. The result is often uncertainty to the point of gridlock. Investors don’t know whether to stuff their money under the mattress, back up the truck and buy, or do something in between.

As I write this in the second quarter of 2022, signs and speculation of a possible recession have increased, so you are in good company if you’re more worried and confused than just a few months ago.

A recent Bank of America monthly fund manager survey showed that investors are more concerned about the global economy than they have been since the financial crisis of 2007-’08.

Deutsche Bank became the first major bank to predict the United States will enter a “mild” recession later in 2022 into early 2023. Moody’s Analytics put the chances of a recession at 33%, and Goldman Sachs is in the same ballpark at 35%.

JPMorgan Chase CEO Jamie Dimon, arguably the most powerful person in banking, wrote to shareholders in early April 2022 that the global economy will slow, and that “it could easily get worse.”

InvestorPlace’s advisors all agree that a recession is indeed possible. The odds have increased as the war in Ukraine further ignited already hot inflation at 40-year highs. They are all watching carefully.

Still, this is where our survival instinct can be helpful. If those potential dangers help us invest smarter and fortify our portfolios, we can be better prepared to avoid those catastrophic losses that are so difficult to recover from.

Now is the perfect time to consider how you’ll manage your portfolio during a recession. Even if we don’t get one, it’s still a worthwhile exercise to consider ways to protect your portfolio from painful losses that cost money and time.

Recessions Hurt

The simplest definition of a recession is two or more consecutive quarters in which the economy contracts. The National Bureau of Economic Research (NEBR) makes the “official” call on recessions, and it considers many more factors than that. (If you’re interested, you can dive into the details here.)

NEBR uses trailing data, so keep in mind that recessions can only be declared looking in the rearview mirror. By the time a recession is identified, both the economy and the stock market may have already been through the worst of it and could even be turning around.

That said, economists, investors, business owners, and consumers alike can often “feel” when they’re in a recession due to what they see in the world, in the news, and on their balance sheets.

Consumers tend to cut back on discretionary spending, corporate revenues slow down, companies cut back on manufacturing, and unemployment rises as more people find themselves out of work.

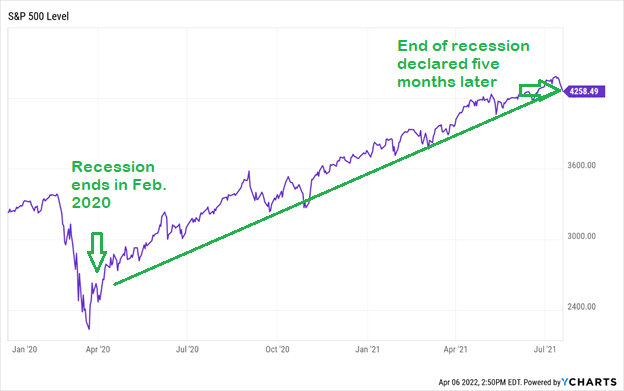
Recessions have lasted anywhere from a grueling 65 months (in very different times in 1873) to a quick two months. That two-month recession, the shortest in U.S. history, is also very recent. It hit in early 2020 as COVID-19 emerged and much of the nation – and the world – shut down.

The NEBR said that recession lasted from February 2020 to April 2020, and they made that announcement on July 19, 2021… more than a year after the fact. Anyone waiting for official word to get back into the stock market missed one heck of a rally, as you can see in the S&P 500 level chart below.

A chart showing the levels of the S&P 500 from January 2020 to July 2021.A chart showing the levels of the S&P 500 from January 2020 to July 2021.

Recessions over the last 80 years, since World War II ended, lasted 11.1 months on average. That makes very short and long recessions the exception rather than the rule, but investors ignore any recession at their own risk.

Believe it or not, stocks can actually go up during recessions. In fact, they often do. The market looks forward, so as we just saw in 2020, stocks often turn higher even as a recession is ongoing. This chart from Hartford Funds shows that stocks gained during seven of the 13 recessions since 1945.

A chart showing how the S&P 500 performed in the past 13 recessions.A chart showing how the S&P 500 performed in the past 13 recessions.

Source: InvestorPlace

The overall average for all 13 recessions was +3.7%. Of the seven recessions when stocks were up, the average gain was 16%. And of the six when stocks lost ground, the average loss was 10.7%.

So this may come as a surprise: Recessions aren’t necessarily catastrophic for stocks. At the same time, they can be costly in terms of both money and time.

The most recent recession discussed above was an outlier in how quickly stocks recovered to new highs. Stocks took much longer to recover from the prior recession that occurred from December 2007 to June 2009 – the so-called “Great Recession” sparked by the subprime mortgage and financial crises. You can see the sharp rally off the March 6, 2009, bottom, but then it took almost another four years for the S&P 500 to get back to where it was before the recession.

A chart showing the levels of the S&P 500 from 2008 to 2013.A chart showing the levels of the S&P 500 from 2008 to 2013.

We see a similar pattern in the 2001 recession from March to November, which was when the whole dot-com bubble burst. The S&P 500 rallied in late 2001 as the recession was ending, but then fell to new lows in 2002. It took until fall of 2005 for the S&P 500 to fully recover.

A chart showing the levels of the S&P 500 from 2001 to 2006.A chart showing the levels of the S&P 500 from 2001 to 2006.

The Nasdaq Composite got hit even worse, taking a full 15 years to top the all-time highs from 2000 prior to the recession.

In this report, we’ll show you five ways to invest in a recession. But like we said before, we don’t officially know about recessions until after the fact.

So first, let’s look at a few recession “indicators” that can tell us about the economy’s status well before the NBER makes its official call.

The #1 Recession Indicator

The NBER doesn’t make the official determination of a recession until after the fact, but there are indicators that can point to the possibility. Perhaps the most frequently watched recession indicator – because it’s the most accurate – is what’s called the “yield curve.”

As I write this in mid-2022, it’s understandable why investors are so nervous. The bond market has been flashing plenty of warning signs lately, with the Treasury yield curve briefly inverting for the first time since 2019 and the end of March and in early April.

The yield curve refers to the relationship between short-term interest rates and long-term interest rates, specifically as paid out by bonds. In a normal market, long-term bonds pay a higher rate – or yield – than short-term bonds. This makes sense, as investors expect a higher return for tying their money up for a longer period of time.

You can see a normal yield curve in the chart below, which John Jagerson and Wade Hansen shared with their Strategic Trader readers in early April. The black line is the long-term yield (10 years), and red line shows the short-term yield (two years).

A chart showing the general yield curves of the short-term and long-term rates.A chart showing the general yield curves of the short-term and long-term rates.

Source: InvestorPlace

The yield curve “flattens” when long-term and short-term rates are about the same, and it “inverts” when short-term yields pay more than long-term yields. An inverted yield curve is concerning because it affects banks’ profits and is often a precursor to a recession.

The most important and closely watched yield curve is the spread between 10-year and 2-year Treasury bond yields. This spread, when it goes negative, has correctly predicted every recession over the past 50 years.

That’s what happened at the very end of the first quarter. At the beginning of 2022, the 2-year and 10-year yields started coming closer together until the 2-year yield (purple line) briefly popped above the 10-year (orange line).

A chart showing the yields over time of the 2-year and 10-year treasuries, with the 10-year briefly dipping below the 2-year in 2022.A chart showing the yields over time of the 2-year and 10-year treasuries, with the 10-year briefly dipping below the 2-year in 2022.

Timing is critical to note here because an inverted yield doesn’t historically signal an immediate recession. In fact, it is usually an opportunity for a period of time.

Luke Lango, InvestorPlace’s Chief Investment Strategist, highlighted the data for his subscribers:

The last three 10-2 inversions didn’t happen at stock market tops – they happenedbefore stock market booms.

In 1988, the 10-2 spread went negative. Stocks rallied 33% over the next 20 months. A decade later, the 10-2 spread inverted again. Stocks rallied 40% over the next 22 months. In 2006, the 10-2 spread also inverted. And over the next 20 months, stocks rallied 22%.

A chart showing the time difference between when the yield curve inverts and when the S&P 500 hits a peak.A chart showing the time difference between when the yield curve inverts and when the S&P 500 hits a peak.

Source: InvestorPlace

In other words, yield curve inversions do predict recessions – but they’re really early in doing so. And, in the time between when the yield curve inverts and the U.S. economy dips into a recession, the stock market tends to party in a big way.

Other Recession Indicators

The yield curve may get the most attention, but it isn’t the only sign of a possible recession on the horizon.

There is also what’s called “stagflation” – a time of high inflation, slowing economic growth, and low unemployment. This is the situation now. The concern here is that the Federal Reserve needs to raise rates to combat inflation, but higher rates make it difficult for businesses to borrow money, which can result in hiring and keeping fewer employees.

Successfully navigating this balance results in the “soft landing” you hear so much about, but investors often turn cautious – sometimes overly cautious – before it’s known whether the landing will be hard or soft.

Consumer confidence is also another indicator economists and investors watch closely when assessing the odds of a recession. The logic here is simple: Consumer spending accounts for roughly 70% of the economy. If confidence wanes and spending drops, the economy can slow or even shrink.

There are also multiple factors that influence consumer confidence and spending, like how many people have jobs and how many are out of work. Real income measures essentially the purchasing power of consumers by adjusting personal income for inflation. Employment may be high currently, but wages have lagged inflation since early 2021.

Wholesale and retail sales tell us about demand for goods, as does manufacturing. If you want a less scientific indicator, you can check men’s underwear sales. Former Fed Chairman Alan Greenspan said many years ago that underwear is the last piece of clothing men buy, so if sales of those are down, it may mean people are holding on to more of their money.

Now that we’ve gone over a few ways we can tell if a recession may be on the way or not, let’s get to what you can do about it – the opportunities that can be found during a recession…

The first thing to know about investing during recessions is that they always end. The track record is without blemish. As we discussed earlier, the bigger question is how long they will last, and how much money and time they will they cost investors.

There are multiple strategies to consider when investing in a recession:

Strategy #1: A Stash of Cash

Cash is not the most exciting thing to think about when it comes to investing, but don’t underestimate its importance – especially in recessionary times.

Cash provides a ballast for your portfolio and dampens overall volatility. It is as low risk as you can get. It won’t grow, unless you can get a good interest rate on a savings or money market account, but $1,000 in cash today will still be $1,000 in cash tomorrow no matter how much the stock market falls (even if its purchasing power declines a little due to inflation).

Cash is also the proverbial “dry powder” that enables you to pounce on opportunities. And as we’ll talk more about in a moment, there will be opportunities. Even good stocks trade at bargain prices during tough economic times and market selloffs.

At the same time, you don’t want to overestimate the importance of cash either by getting out of the market completely. This can happen when investors panic and emotions take over. Too often, investors end up taking bigger losses than they needed to.

To be clear, we are talking here about cash in your investment portfolio. From a personal finance perspective, you also want to have some cash on hand for emergencies like loss of a job or an unexpected repair to your car or home. And from a financial planning perspective, you want little if any of the cash you need right now or will need in the very near future invested in stocks. It’s just too unpredictable.

Strategy #2: Stocks That Typically Do Well in a Recession

There are several tried-and-true investments that typically outperform during a recession. That is, they gain more and/or lose less than many other stocks. As you would expect, these are industries that can maintain demand levels or even increase demand during tough economic times as well as some of the biggest companies in those industries…

  • Healthcare/Pharmaceuticals: Our need for healthcare and medicines doesn’t change just because the economy does. Examples include pharmaceutical companies like Johnson & Johnson (JNJ) and Pfizer Inc. (PFE), biotech companies like Abbvie Inc. (ABBV) and Amgen Inc. (AMGN), medical equipment companies like Abbott Laboratories (ABT) and Medtronic PLC (MDT), and healthcare services and providers like Unitedhealth Group Inc. (UNH) and CVS Health Corp. (CVS). We also have medical software and technology companies such as Cerner Corp. (CERN) and Veeva Systems Inc. (VEEV) that help healthcare providers do more for less cost.
  • Utilities: We still need water, electricity, and gas to live, so demand tends to remain steady, even during tough economic times. Many utility stocks also pay solid dividends, which investors seek in down markets and times of inflation. (See below.) Among the biggest are Nextera Energy Inc. (NEE), Dominion Energy Inc. (D), Atmos Energy Corp. (ATO), and American Water Works Company Inc. (AWK).
  • Home and auto maintenance: If consumers cut back spending, they will likely delay major purchases like new homes and cars. That means spending money to maintain current homes and cars. Hardware stores like Home Depot Inc. (HD) and Lowe’s Companies Inc. (LOW) stores often see an uptick in sales during recessions, as do auto supply stores such as O’Reilly Automotive Inc. (ORLY) and Autozone Inc. (AZO).
  • Consumer staples: People may not go to restaurants as much when money is tight, but that doesn’t mean they stop eating. They may not go to the movies as much, but that doesn’t mean they don’t need entertainment. Demand for food, beverages, cleaning supplies, personal products, and the like usually remains fairly steady. Some of the biggest consumer staples companies include Procter & Gamble Co. (PG), Coca-Cola Co. (KO) and Pepsico Inc. (PEP), and Unilever PLC (UL).
  • Discount stores: Makes sense, doesn’t it? You still need things when times are tough, so might as well get them at the lowest prices you can find. That means discount retailers can benefit. Think dollar stores, warehouse clubs, and even just big chains with lower prices – stores like Walmart Inc. (WMT), Target Corp. (TGT), Costco Wholesale Corp. (COST), and Dollar General Corp. (DG).

Many investors like to put their money into dividend-paying stocks when they fear a recession. History would say it is worth investing some of your portfolio in dividend stocks in good times and in bad.

According to S&P Global, dividends account for 32% of the S&P 500’s total returns since 1926. Fidelity says that in the 90 years from 1930 to 2020, dividends constituted nearly 40% of total returns.

A chart showing the breakdown of gains in the S&P 500 every decade from the 1930s to the 2020s between dividends and stock price appreciation.A chart showing the breakdown of gains in the S&P 500 every decade from the 1930s to the 2020s between dividends and stock price appreciation.

Source: Fidelity

Let that sink in. Somewhere around one-third of the market’s total returns going back nearly a century come from dividends.

A solid dividend also tends to make the payer’s stock less volatile, and the income from the dividend helps counter any drops in the share price. Wall Street sees such stocks as safer investments, and investors seek safety in turbulent markets and economies.

Dividends are not guaranteed. They can be cut by the company if need be, so you want to look for a strong dividend history and strong company cash flow to minimize the chances of dividends being slashed.

Strategy #3: Long-Term Buying Opportunities

In times of recession, stocks can fall because their underlying businesses are not doing as well. That’s understandable.

But stocks often fall too much as fear takes over, and making investment decisions based on any emotion can lead to shortsighted thinking and costly mistakes.

The term “panic selling” is accurate, and when investors sell out of fear, they don’t care what price they are getting back. They simply want out. As with selling anything from a stock to a home, you’re going to get a lower price if you’re desperate to get rid of it.

The buyer, on the other hand, walks away with a real bargain.

Stocks usually move based on a company’s earnings and revenue growth. Every once in a while, especially during times of economic unease like a recession, war, or unexpected scare, that pattern breaks down. As a result, companies still growing their earnings and revenues see their share prices diverge from the underlying fundamentals. Smart investors can sometimes buy a dollar of earnings growth for mere pennies.

Luke Lango has done some fascinating research on what he calls “divergence” and the resulting opportunities:

In my early years as an investor, I remember reading book after book, studying lecture after lecture, and talking to hedge fund manager after hedge fund manager to figure out what type of investment style fit me best.

And by “fit me best” I mean to say I was trying to figure out what investment style would make me the most money.

My questions were answered when I came across an earlier version of the following chart. It graphs the earnings per share of the S&P 500 alongside the price of the S&P 500 from 1988 to 2022.

A chart showing the level of the S&P 500 and the operating EPS of the S&P 500 from 1988 to 2020.A chart showing the level of the S&P 500 and the operating EPS of the S&P 500 from 1988 to 2020.

Source: InvestorPlace

As you can see, the blue line (earnings per share) lines up almost perfectly with the orange line (price). Indeed, the mathematical correlation between the two is 0.93, which is about as close as it gets.

I was convinced after seeing that chart. Clearly, earnings drive stock prices. Forget the Fed. Forget inflation. Forget geopolitics. Forget trade wars, recessions, depressions, and financial crises.

We’ve seen all of that over the past 30 years – and yet, through it all, the correlation between earnings and stock prices never broke or even faltered very much.

But at certain times in history, including here in the first part of 2022, earnings and revenues have not driven stock prices. This divergence is due to macroeconomic fears.

When people get fearful in the stock market, they sell first and ask questions second. They don’t care about fundamentals. Fear on Wall Street sparks a mad dash for the exits.

One period of great divergence Luke identified was 2001 when the dot-com bubble burst and the economy tumbled into a recession. His research shows how that turned out to be one of the best opportunities to buy internet stocks, and he cited Amazon as a prime example:

From December 1999 to September 2001, Amazon dropped a mind-boggling 92%. During that stretch, revenues rose 82%. This was a massive divergence the market had never seen before.

The result? A rally like the market hadn’t seen yet, either.

Within a year, Amazon stock had soared 166%. Within two years, it had risen 707%. Two decades later, it is up 52,860%.

A chart showing the divergence of Amazon's stock price and revenue between 1997 and 2004.A chart showing the divergence of Amazon's stock price and revenue between 1997 and 2004.

Source: InvestorPlace

Of course, taking advantage of undervalued stocks requires a willingness to tolerate volatility and a long-term investment horizon. As a recession gathers steam, it’s impossible to know for sure when investors will get past their fears and start focusing again on fundamentals.

But when they do, quality companies with growing businesses in transformative megatrends can rally further and faster than the market.

Strategy #4: Hedging and Shorting

If you want to take a more active approach to managing your portfolio during recessions and tough markets, you can consider both hedging to dampen downside risk and shorting to profit from stocks that go down.

InvestorPlace macro expert Eric Fry, a former hedge fund manager, says that hedging is really about making money no matter what the market does…

It is a return that is not dependent upon, or relative to, market direction. It does not require nourishment from a bull-market trend.

Over the decades since [A.W.] Jones launched his new-fangled fund, a wide variety of hedge-fund strategies have emerged. Although many of them still focus on buying and selling short stocks, others utilize some combination of bonds, currencies, futures, private equity investments, derivatives, and what-have-yous.

No matter the exact tactics, most hedge funds attempt to construct some type of “market-neutral” portfolio that can generate a positive absolute – no matter if the stock market is rising or falling.

In theory, therefore, “market-neutral” strategies are the fat-free ice cream of investing. They deliver at least some of the good stuff while eliminating almost all the bad stuff.

In its simplest form, a market-neutral trade would feature two halves: one half that bets on some sort of up move, paired against a second half that bets on some sort of down move.

But of course, a perfectly market-neutral trade would never produce a profit or a loss; it would only produce a breakeven result because the gain on one half would perfectly offset the loss on the other half.

Obviously, the goal is not to be that neutral.

Instead, a market-neutral trade attempts to profit when the two halves of the trade combine to produce a profit. Importantly, however, both sides of a market-neutral trade do not need to produce a profit, in order for the entire trade to produce one.

The most direct way to bet on a down move is through shorting a stock. Be aware, though, that shorting is risky and more complicated than buying shares. It also requires you to have a margin account, which allows you to borrow from your broker. Like any other type of loan, you need to pay interest, and you need to pay back what you’ve borrowed.

Shorting a stock means selling it first. If that sounds impossible, here’s how it works: When you identify a stock you believe will go down, you “borrow” shares from your broker and sell them on the open market. The goal is to then buy those shares back at a lower price, return them to your broker, and keep the difference as profit.

You still hope to buy low and sell high, but just in reverse order.

Say you borrow shares of XYZ stock and sell them right away for $20 a share. XYZ then dips to $15, so you buy them back and return them to your broker, keeping the $5 a share as your profit (minus any interest and fees).

The risk, of course, is that the stock you shorted goes higher, and then your losses can mount quickly. Mathematically speaking, the most you can make shorting a stock is 100% if the stock goes to $0, but your downside risk is theoretically infinite if the stock price keeps going higher and higher.

That’s when short-sellers “cover” by buying shares back and taking the loss. You can also be forced to cover if the brokerage issues a “margin call” and essentially demands that you return the shares you borrowed.

You can hedge your portfolio without directly shorting a stock by concentrating on investments that tend to zig when the market zags. We talked above about types of stocks that often outperform during recessions when the market falls.

You can also hedge by investing in inverse exchange-traded funds (ETFs), which are basically short ETFs that are built to move in the opposite direction to the market or a specific index. For example, if the S&P 500 is down 1.5% on a given day, the ProShares Short S&P 500 ETF (SH) would be up 1.5%. You can find inverse ETFs on most any investment index, sector, or theme.

We’ll let Eric have the last word on hedging and how to think about it:

We investors do not need to swing for the fences every time we step the plate. Sometimes, it’s a good idea to shorten our swings and try to hit singles. Heck, it’s even good to get hit by a pitch.

And when times get really tough, select short sales or other portfolio hedges can help a portfolio “score runs” when most typical investment strategies are striking out completely.

Because short sales produce profits from falling stock prices, they can provide a valuable “hedge” to your conventional portfolio. To be sure, short sales can be risky, even when they are part of a market-neutral trade. But so can owning stocks during a bear market.

Therefore, for those folks who are eager to investigate the mysterious, alluring (and risky) world of hedges that can profit directly from falling stock prices, take a look at the final story in this month’s issue.

On the other hand, if you have no interest in advanced “Hedging 2.0” strategies, no problem. Most of us don’t like betting against companies, or the idea that we will lose money if a stock increases in value.

I get it. There are other, less scary forms of hedging, like gold stocks, oil stocks, and “inverse funds” like the ProShares Short 20+ Year Treasury ETF (TBF).

Although “indirect hedges” like these do not automatically rise when the overall is falling, the last few weeks have demonstrated that they can deliver big gains amid market turmoil.

Strategy #5: Built a Crisis-Proof Portfolio in Advance

If the past 30 years of history have taught us anything, it’s that smart investors need to “harden” their financial lives and investment portfolios.

We’ve talked about many of these crises already, from the worst pandemic in a century to the Great Recession of 2007-’08 and the bursting of the 2000 tech bubble.

Moreover, we live in a world rife with cybercrime and financial scams and wars.

And we live in a world where stock market drops occur with disturbing regularity, whether they are from a recession or wars or pandemics or any number of other causes.

For these reasons, building and maintaining a “hardened” financial life to grow your wealth safely is one of the smartest moves you can make for yourself and your family.

As one of the world’s largest investment research firms, InvestorPlace hand selects and recommends many stocks and other investments each year. However, the world’s best investment ideas aren’t worth much if they don’t fit inside a robust all-weather portfolio that can make you money during good times and keep you safe during the bad times.

In fact, asset allocation is arguably more important than stock picking when it comes to successful investments and building wealth safely,.

Asset allocation is the part of your investment strategy that dictates how much of your wealth you place in broad asset classes like stocks, bonds, cash, commodities, precious metals, and real estate. Ideally, you want a diversified mix of assets that greatly limits your exposure to a big decline in one asset class.

There’s no “one size fits all” asset allocation strategy that is right for everyone.

When you (possibly with the help of a financial advisor) think about your right “mix,” you must consider your age, your risk tolerance, and your goals. A 50-year-old who is paying college tuition for three children will think about asset allocation much differently than a 32-year-old with no family.

However, most of us have a similar goals. We want to own a diversified collection of assets that throws off income… even when we are not actively working. We want to buy high-quality assets for bargain prices. We want to keep the financial damage a recession inflicts on us to a minimum.

Having all that means being diversified across private businesses, stocks, bonds, real estate, cash, precious metals, and insurance.

While deciding what allocation works best for you, consider some of these factors:

If you’re younger and more comfortable with the volatility involved in stocks, you can keep a stock exposure to somewhere around 50%-75% of your portfolio. A young person who can place a significant chunk of their wealth into stocks and hold them for decades stands to do very well. But they will have to go through some volatile times.

If you’re older and/or can’t stand risk or volatility, consider keeping a significant portion of your wealth in cash and bonds, perhaps even as much as a 75%-85% weighting.

Near the end of your career as an investor, you’ll likely be more concerned with preserving wealth than growing it, so you’ll in turn likely want to be very conservative.

Whatever mix you choose, just make sure you’re not overexposed to an unforeseen crash in one particular asset. This will make your hardened wealth plan as “crisis proof” and “inflation proof” as possible.

Rely on the Proven Basics

Preparing your portfolio for a recession can mean incorporating strategies specific to the market and the economy at that time.

But it also means sticking to the basics that have proven their worth through recessions, bear markets, and just every other situation.

Have some cash to live on and for emergencies.

Try to minimize big hits to your portfolio by diversifying among asset classes. You never want to be too dependent on any single asset class or even one investment within an asset class.

Dividends can provide both income and stability to your portfolio.

When investing in stocks, stay focused on the long term. The short term is too unpredictable.

Keep emotions out of it. The market is famous for panic selloffs, and it can be tempting to join the crowd when you see your stocks falling. Selling out of fear is rarely the right decision, especially if the long-term outlook for your stocks hasn’t changed.

Most of all, remember that recessions end and bear markets end. They can be painful and stressful when they are happening, but the market and the economy always recover. The bias of capitalism is growth, which makes the bias of the market higher.

Build a smart portfolio.

Avoid the catastrophic losses.

Stay patient.

If you can do those, you’ll be in the best position possible to weather a recession – and other negative market events – and continue on the path to wealth and financial freedom.


Source link

FX consolidates while U.S. equities suffer – United States


Written by the Market Insights Team

Stocks dip, Loonie stays unfazed

Kevin Ford – FX and Macro Strategist

The recent performance of North American markets underscores mounting concerns about a U.S. economic slowdown—not a recession—in 2025. Polymarket places the likelihood of a recession at 38%, and while banks and investment managers avoid the “R-word,” they’ve already cut Q1 GDP estimates. Despite this, corporate profits and macro data reveal no definitive signs of a sharp slowdown. Market sentiment, however, reflects growing fears of higher inflation and slower growth, driven by the impact of tariffs and fiscal austerity. Surveys show that the threat of tariffs alone has weakened business investment prospects, while households worry about rising prices. Adding to these concerns, statements from Trump & Co have fueled unease on both Wall Street and Main Street.

Last week, when asked about the possibility of a recession this year, Trump described the U.S. economy as in a “period of transition”. On pausing tariffs on certain Canadian and Mexican products for a month, he dismissed any link to the stock market, emphasizing long-term U.S. strength. During his first term, Trump often highlighted equity market performance, which had created the so-called “Trump put,” where investors believed he would avoid policies triggering selloffs. However, his latest remarks suggest a shift to interest rates as his key economic barometer, noting “a big, beautiful drop” in rates. Notably, the S&P 500 experienced three Monday drops of over 1% in the first two months of his second term, compared to none in the first 836 days of his first term.

Amid this elevated equity market volatility, and overall risk-off sentiment, how was the CAD performed? Surprisingly, Loonie’s implied volatility remains among the lowest within G10 currencies. The Loonie has traded within a narrow range, with 1.43 as strong short-term support and resistance near 1.445. Concrete evidence of a significant U.S. economic slowdown, along with data showing tariffs directly impacting consumer prices, could trigger not the “Trump put,” but the “Fed put.” This might become the key catalyst to push the Canadian dollar out of its current range, especially as trade tensions escalate.

Today’s University of Michigan sentiment survey in the U.S. is expected to confirm the ongoing trend of participants expressing concerns about the pass-through of tariff costs to consumers.

Chart of CAD implied volatility

Equities enter correction territory

Boris Kovacevic – Global Macro Strategist

Investors continue to display a cautious stance amid tariff uncertainty and macro ambiguity. It isn’t surprising to see that the market rout resumed on Thursday, sending the S&P 500 into correction territory as equities continued their three-week slide. The equity index is now down 10% from its February peak, equating to around $5 trillion of value lost. The dollar was bid but not enough to reverse the downtrend the currency has entered.

Despite a softer US inflation print earlier in the week, escalating trade tensions weighed heavily on sentiment. President Trump announced a potential 200% tariff on European wine, champagne, and spirits, doubling down on trade tensions just a day after vowing to keep steel and aluminum duties in place.

On the macro front, the data added to the uncertainty. US producer prices stagnated in February. Jobless claims came in at 220K, largely in line with expectations, but concerns over slowing wage growth and consumer spending are creeping into the broader outlook. Market pricing now suggests the Federal Reserve will stay put until June, though persistent inflation and deteriorating sentiment are complicating the policy path. Next week’s Fed decision and economic projections will be crucial, as investors look for clarity on how officials will balance stubborn inflation with weakening economic momentum.

The US dollar remains caught between trade-related volatility, Fed repricing, and shifting risk sentiment. While the Trump administration’s aggressive stance on tariffs could provide short-term safe-haven support, investors are increasingly focusing on the longer-term economic damage. If trade uncertainty continues to weigh on equities and growth, the dollar’s safe-haven bid may not be enough to offset structural headwinds. With Trump’s tariff deadline fast approaching and recession risks climbing, next week’s Fed guidance could be the deciding factor in whether the dollar extends its recent slide or stages a comeback.

Chart of dollar index and Trump rating

Euro outlook remains complex

Boris Kovacevic – Global Macro Strategist

The euro edged lower from its five-month high, trading near $1.0850, as investors reassess the broader economic and geopolitical landscape. While the currency remains supported by Europe’s fiscal reset and Germany’s impending debt expansion, fresh uncertainty surrounding trade and energy policy has added a layer of complexity to the outlook. The euro’s recent strength has been driven by expectations of increased government spending, particularly in Germany, but with US tariff threats looming and risk sentiment shifting, markets are now more cautious.

Adding to the eurozone’s economic equation, natural gas futures plunged after Russian President Vladimir Putin floated the possibility of renewed energy cooperation with Washington. Speaking in Moscow, Putin suggested that if the US and Russia reached a deal on energy, pipeline gas to Europe could be restored. This speculation comes as US President Donald Trump intensifies his efforts to broker an end to the war in Ukraine, leading some to wonder whether energy trade restrictions might be loosened as part of a broader peace framework. This means that, in addition to falling wages, inflation expectations could fall faster than anticipated, potentially complicating the European Central Bank’s (ECB) already delicate monetary policy outlook.

Looking ahead, the euro’s trajectory will depend on how markets digest these competing forces. The currency has benefited from Germany’s major fiscal shift and the ECB’s measured approach to rate cuts, but Trump’s trade policies and ongoing geopolitical shifts could introduce fresh volatility. With tariff threats still unresolved and economic risks lingering, EUR/USD remains stuck between competing narratives—fiscal optimism on one side, external uncertainty on the other.

Chart of European stocks and gas prices

UK economic concerns mount after GDP miss

George Vessey – Lead FX & Macro Strategist

The pound is on the backfoot this morning after data showed the UK economy shrank 0.1% in January on a monthly basis, versus an expected expansion of 0.1% and markedly lower than December’s 0.4% print. However, the 3-month rolling average ticked up from 0.1% to 0.2%. It’s still a blow to the UK’s Labour party that has pledged to bring an end to over a decade of stagnation.

Despite the slowing UK economy, the Bank of England is expected to keep its Bank Rate on hold at 4.5% next week due to growing inflationary risks. The cut-hold tempo by the BoE has become well established but weak supply dynamics mean the growth-inflation trade-off has worsened so much that the BoE may well decide to defer a rate reduction in May too. This has already sent yields in the UK relative to those in the US higher in recent weeks, underpinning GBP/USD. Despite trading softer this morning, sterling is primed for another week of gains versus the dollar but is yet to change hands with the key $1.30 handle. Meanwhile, after its worst week in two years last week, GBP/EUR has modestly recovered back into the mid-€1.19 region due to the escalating trade war between the US and EU.

There’s also the threat of political headwinds from Germany weighing on the euro amidst the upcoming vote on fiscal reforms next Tuesday. But overcoming them will ensure sustained upward bias for the euro, which could reinstate the downtrend in GBP/EUR. The pair is trading back above its 200-day moving average this morning, but as we’ve warned – the €1.1740 level looks like the next key downside target if euros strength resumes next week.

Chart of UK GDP

Mexican peso thrives among emerging currencies

Table: 7-day currency trends and trading ranges

Table 7-day currency trends

Key global risk events

Calendar: March 10-14

Table Calendar

All times are in ET

Have a question? [email protected]

*The FX rates published are provided by Convera’s Market Insights team for research purposes only. The rates have a unique source and may not align to any live exchange rates quoted on other sites. They are not an indication of actual buy/sell rates, or a financial offer.


Source link

World Coin News: Spain 2 euro 2025


New bimetallic circulating commemorative:

“UNESCO World Heritage: Salamanca


Spain 2 euro 2025 - Salamanca


TECHNICAL DATA
External ring: copper-nickel
Center disc: nickel-brass, nickel and nickel-brass three layers
Diameter: 25.75 mm
Weight: 8.50 g
Thickness: 2.20 mm
Mint: Fábrica Nacional de Moneda y Timbre (Spain)


Source link