Value investors seek stocks that are trading on the market at a price point below their fundamental value. These stocks typically represent high-quality companies that are either emerging or whose shares have otherwise fallen. While it can be difficult to execute successfully, value investing allows investors to buy stocks at a relatively low price point and then benefit when the market eventually corrects itself and the price rises to be more in line with the company’s underlying value.
In March 2025, some likely candidates for value investors to keep an eye on include pre-clinical biotechnology firm Spyre Therapeutics Inc. (SYRE), shipping firm ZIM Integrated Shipping Services Ltd. (ZIM), and utilities outfit Korea Electric Power Corp. (KEP), among others.
Key Takeaways
Undervalued stocks on the NYSE and the Nasdaq have 12-month trailing P/E ratios as low as 1.07.
Value investors believe it is possible to identify companies with shares trading below their fundamental value. Later, when the market corrects this pricing error, investors achieve gains as share prices rise.
P/E ratio is a key metric used to identify value stocks, but this figure can vary significantly from one sector or industry to the next.
For this reason, it’s most helpful to compare potential value plays against other peers in the same sector.
Other common value metrics include forward P/E ratio, price-to-book ratio, and price/earnings-to-growth ratio.
Below, we consider some of the top undervalued stocks for this month, as measured by 12-month trailing price-to-earnings (P/E) ratio. A detailed explanation of our methodology is found below. All data are as of Feb. 24, 2025.
Top Undervalued Stocks By Sector, Based on Lowest 12-Month Trailing P/E Ratio
Our screen for the best undervalued stocks includes firms listed on either the New York Stock Exchange (NYSE) or the Nasdaq and with a price of at least $5 per share, a daily trading volume of 100,000 or more, and a market capitalization of $300 million or more. From that list, we ranked the companies in our screen by 12-month trailing P/E ratio and then selected the stock with the lowest P/E ratio from each sector.
While there are many different metrics used in value investing, P/E ratio is one of the most common. It is a measure of the price of a company’s shares against its earnings. A low P/E ratio often suggests that a firm’s recent earnings have performed well relative to its price, meaning that it is undervalued in the market.
When looking for undervalued stocks, investors should keep in mind that P/E ratio is just one of many measures of a company’s value. It’s important to look at the firm’s financials as well as other metrics like P/S ratio (for firms that have yet to achieve profitability), price-to-book ratio, and price/earnings-to-growth ratio for a fuller picture. That said, it is also inherently difficult to calculate a company’s intrinsic value, and market unpredictability means that even legitimately undervalued firms may never see a stock price increase in the future.
What Should Investors Look For in Undervalued Stocks?
While we looked at trailing P/E ratio in our screen, forward P/E ratio is also a helpful metric to use to identify undervalued stocks. The forward P/E ratio makes use of Wall Street analyst predictions of a company’s future earnings. It can be a helpful way to take stock of how developments on the horizon could impact the company’s performance, although it’s also important to note that forward P/E ratio is intrinsically speculative.
Another way of comparing price and earnings is the price/earnings-to-growth ratio, which also includes an estimate of future earnings growth. This may provide investors with a better sense of how a company is likely to fare with regard to future earnings, as well as whether the firm may be undervalued relative to potential earnings growth.
Price-to-book ratio is a measure of a company’s share price against its net value (assets less liabilities). By looking at the firm’s book value per share, investors can get a fuller view of a company’s financial wellbeing. The price-to-book ratio suggests how much investors may be willing to pay for each dollar of the company’s net value.
Finally, regardless of which metrics one uses to evaluate a company, it’s essential to consider a benchmark. When it comes to value investing, it’s impossible to determine whether a company is undervalued unless one has a sense of how it compares to peers in its industry or sector. Because P/E ratios differ significantly from one sector to another, this information helps investors make the most educated guesses possible about a company’s underlying value.
The Bottom Line
Undervalued companies may have the potential to experience outsized returns if the market corrects the price to more closely match their underlying value. Investors seeking a value play might look to metrics like 12-month trailing P/E ratio as one indicator. Our screen has revealed a selection of stocks across sectors that could be undervalued, although there is no guarantee that investors in these stocks will achieve better-than-expected results.
The comments, opinions, and analyses expressed on Investopedia are for informational purposes only. Read our warranty and liability disclaimer for more info.
As of the date this article was written, the author does not own any of the above stocks.
Has Nvidia Corp.’s (NVDA) unbeatable, dazzling market performance created an Emerald City-like allure?
On Wednesday, Nvidia released its fourth-quarter earnings report. This came after a volatile start of the year, with the release of Chinese AI DeepSeek-R1 about a month ago causing Nvidia’s shares to decline nearly 17%.
The company’s shares have continued to struggle since then, with the stock dropping 9% over five trading sessions ending Tuesday this week.
Nevertheless, Nvidia reported earnings that topped Wall Street expectations… again. The company’s revenue for the fourth quarter came in at $39.33 billion, up 3.08% from estimates, while earnings per share reached $0.89 adjusted, beating Wall Street’s prediction by 5.22%.
But despite delivering earnings beat as well as strong first-quarter guidance, Nvidia’s shares fell 8% the next day.
Even so, Nvidia is undoubtedly today’s AI darling, but as Dorothy learned in Oz, even the most powerful wizards eventually step from behind the curtain. While the company’s recent numbers still have them on top, investors should start considering companies that will eventually inherit Nvidia’s momentum – the AI Appliers.
AI Appliers take foundational tech breakthroughs – like Nvidia AI chips – and profit off utilizing them. Some companies use AI to enhance businesses, while others provide the energy AI needs to run.
These are the companies now set to produce strong investment gains in the coming years.
In today’s Smart Money, I’ll show you a few under-the-radar AI Appliers on my list with near-future upside potential. That said, with the markets in distress this week, I suggest putting them on your watch list for consideration after this current bout of volatility calms. After all, the AI Revolution isn’t going anywhere.
Then, I’ll explain how investing in these companies is crucial for positioning yourself in this ever-evolving landscape…
The data centers that power AI technologies require such prodigious – and reliable – volumes of electricity that tech giants like Alphabet Inc. (GOOGL), Amazon.com Inc. (AMZN), and Microsoft Corp. (MSFT) have “rediscovered” nuclear power as an ideal energy source.
In October 2024, Amazon announced that Amazon Web Services (AWS) – its cloud computing platform – is set to invest more than $500 million in nuclear power.
AWS has signed an agreement with Dominion Energy Inc. (D), Virginia’s top utility company, to explore the development of a small modular reactor near Dominion’s North Anna Nuclear Generating Station (located about halfway between Washington and Richmond).
Around the same time, Google announced it will purchase power from Kairos Power, a small modular reactors developer. And in September, Microsoft made a deal with Constellation Energy Corp. (CEG) to restart a reactor at the infamous Three Mile Island nuclear facility near Harrisburg, Pennsylvania.
This unlikely marriage between Big Tech and nuclear power is the newest reason why the young bull market in uranium may last several more years.
To capitalize on that potential, I recommend putting the Global X Uranium ETF (URA) on your watchlist. This $3.3 billion ETF holds a broad portfolio of uranium companies – both those that are currently producing, and those that hope to begin producing in the future.
Coupangmay not be a household name here in the United States, but the company is well known in every South Korean household. Coupang is South Korea’s go-to provider of Amazon-like services.
And they are investigating and testing ways to enhance its businesses with AI technologies.
As the company’s founder, Bom Suk Kim, explained on the company’s first quarter 2024 earnings call…
Machine-learning and AI continues to be – have been a core part of our strategy. We’ve deployed them in many facets of our business from supply chain management to same-day logistics.
We’re also seeing tremendous potential with large language models in a number of areas from search and ads to catalogue and operations among others. There is exciting potential for AI that we see and we see opportunities for it to contribute even more significantly to our business. But like any investment we make, we’ll test and iterate and then invest further only in the cases where we see the greatest potential for return.
Kim’s focus on AI and other cutting-edge technologies is not new. Coupang’s e-commerce platform already utilizes AI and advanced robotics. The company’s other patent-protected AI-related tech can predict future order volumes, alert product managers when prices fluctuate significantly, optimize Coupang Eats delivery, and enhance search accuracy.
Today, Coupang has more than 2,100 global patent registrations, and it serves customers in 190+ countries and territories.
As Coupang expands its empire, and its earnings continue ramping higher, I expect its share price to post solid market-beating gains for many years.
Despite being one of the oldest “new” healthcare stocks in the market, GE HealthCare is also leader in the field of AI-enabled medical devices. As of May 2024, of the more than 850 AI-enabled devices authorized by the U.S. Food and Drug Administration, 72 are from GE HealthCare.
From an investment perspective, GE HealthCare is a two-part story. It is a solid, steadily growing medical imaging company that also includes considerable fast-growth potential from its AI product line and investments.
According to Grand View Research, artificial intelligence will become a key driver of medical device innovation over the coming decade. The research firm predicts the AI component of the healthcare market will skyrocket from $15.4 billion in annual sales in 2023 to more than $200 billion in 2030. That’s a compound annual growth rate of 37.5%.
Importantly, GEHC’s AI solutions do not replace medical professionals; they assist them. The company’s AI-enabled devices and services operate alongside traditional medical practitioners to support and optimize their efforts.
GE HealthCare is embracing this new paradigm with gusto.
Arming Your Portfolio
While AI Appliers are sure to give your portfolio strength, a good portfolio has a mix of companies that fall into the three AI categories I’ve laid out before:
AI Creators: Companies like Nvidia that develop the foundational hardware and software powering the AI Revolution.
AI Appliers: Companies that either implement AI technologies to transform their business or provide the essential resources that power AI.
AI Survivors: Traditional sectors like agriculture and metals that are difficult for AI to disrupt.
This dynamic landscape is transforming rapidly, and strategically it is crucial to invest across these categories in order to not get left behind.
As we’re seeing right now, even dominant companies like Nvidia can see their shares struggle despite beating earnings estimates, proving that no one AI play is immune to volatility.
We have all our AI bases covered at Fry’s Investment Report. Our portfolio includes holdings across several sectors – from tech innovators to energy powerhouses, and healthcare companies to metals and mining operations.
So, no matter which way the market turns, our balanced approach has us prepared.
El Salvador’s heralded adoption of Bitcoin as legal tender appears to be undergoing a significant downgrade as businesses are no longer obliged to accept the cryptocurrency.
As part of a $1.4 billion loan agreed with the International Monetary Fund in December, the government’s involvement with the digital Chivo wallet will be “gradually unwound.” At the end of January, on a vote of 55-2, El Salvador’s Legislative Assembly passed modifications to the Bitcoin law, eliminating the word “currency” but keeping it legal tender. The changes will take effect May 1, 90 days after the legislation appeared in the official newspaper.
“Bitcoin no longer has the strength of legal tender,” economist Rafael Lemus told AFP. “It should have always been that way, but the government tried to force it into existence, and it didn’t work.”
Users are now free to accept Bitcoin or not, but it cannot be used to pay taxes or state bills. President Nayib Bukele admitted that introducing Bitcoin as an official currency alongside the US dollar in September 2021—the world’s first such move—had been his government’s “most unpopular” measure, alongside stringent anti-gang security measures.
El Salvador still has 688 Bitcoin in reserve, worth an estimated $574 million, of which $287 million is profit.
On February 13, Bukele and Microstrategy Executive Chairman Michael Saylor discussed how Bitcoin adoption could be accelerated worldwide, with El Salvador’s National Bitcoin Office considering establishing nodes in each household. The aim was to boost public perception of how Bitcoin can work in daily settings.
“President Bukele continues to buy Bitcoin, we have a Bitcoin Office, we have the Bitcoin Law, Bitcoin can be used in El Salvador,” El Salvador’s ambassador to the US, Milena Mayorga, assured at a Bitcoin conference.” But, “it has not been an easy road.” A survey published by the Jesuit Central American University in January revealed 92% of Salvadorans had not used Bitcoin in 2024. Of the 8% who said they had done so, the average was only 14 times a year. Family remittances via digital wallets amounted to $7.22 million in December 2024, less than 1% of the total sent.
Broadcom is expected to report fiscal first-quarter results after the market closes Thursday.
Analysts are widely bullish on the chipmaker’s stock despite recent losses.
Broadcom shares have lost about one-quarter of their value since hitting an all-time high in December.
Broadcom (AVGO) is set to report fiscal first-quarter results after the market closes Thursday, with analysts widely bullish on the chipmaker’s stock despite recent losses.
All but one of the 13 analysts covering the stock tracked by Visible Alpha have issued a “buy” or equivalent rating, with one “hold” rating. Their consensus price target of $259 would suggest about 30% upside from Friday’s closing price at $199.45.
Broadcom is expected to report revenue of $14.61 billion, up 22% year-over-year, and adjusted net income of $7.39 billion, up from $5.25 billion a year earlier.
Or so you might believe based on the sentiment indicators.
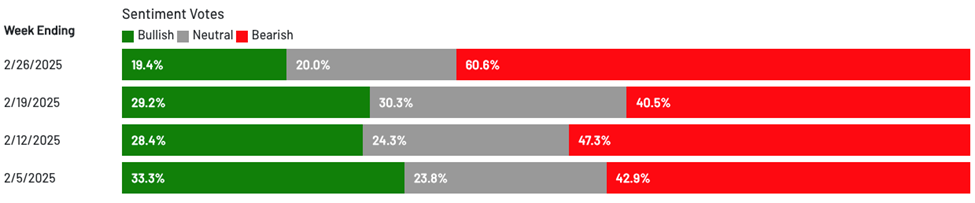
The latest AAII Sentiment Survey showed only 19.4% of respondents are bullish. This was the sixth time in eight weeks the reading came in below the historical average of 37.5%.
Here are the results from the last four weeks:
Meanwhile, the Conference Board Consumer Confidence Index showed a rise in consumer pessimism. The Expectations Index (based on consumers’ short-term outlook for income, business, and labor market conditions) dropped 9.3 points to 72.9. From their press release:
For the first time since June 2024, the Expectations Index was below the threshold of 80 that usually signals a recession ahead.
The survey also showed that 27% of consumers expect business conditions to worsen over the next six to 12 months, the highest since June 2022.
Looking at this data could spook any investor, leading to a classic investing mistake.
However, investors who can keep their heads can profit no matter what the crowd is doing, and I’m going to share an opportunity today.
Profiting by Separating Feelings from Data
Last week I wrote about the Iron Law of the Stock Market: If a company massively grows its sales and earnings, its stock price will grow, too.
Today, investor sentiment is low, but the earnings data tells a different story.
According to FactSet:
77% of S&P 500 companies exceeded earnings per share (EPS) estimates – equal to the five-year average of 77%.
The S&P 500 reported growth in earnings of 17.8% – the highest growth since Q4 of 2021.
No wonder the market hit an all-time high just a week ago.
And amid all the concern about inflation reigniting, yesterday, we learned the Personal Consumer Expenditures Index is 2.5%, down from 2.6% in December.
Regardless of the numbers, herd mentality takes over when sentiment turns negative, causing investors to react without thinking.
Here is what legendary investor Louis Navellier, editor of Growth Investor, has written about this classic investing mistake.
A lot of you are probably fans of momentum investing. The truth is, I am, too. You always want to capitalize on a trend, and trends are made up of people.
But while following the crowd CAN result in great momentum plays… you don’t want to do so blindly.
The crowd-seeking I’m talking about – follow the herd, think later – is responsible for a lot of failed investments. It means you won’t pick up on a shift in the trend. Thus, you’ll get your timing all wrong. You’ll often end up buying near the highs and selling near the lows.
Taking our natural biases out of the equation is at the heart of Louis’ quantitative stock picking system.
A Quality Stock on Sale
When market fear is high, savvy investors start to look for superior stocks that are on sale. That doesn’t necessarily mean cheap stocks. It means great companies selling at reasonable prices, resulting in good value.
Warren Buffett once encapsulated this idea in his usual folksy way, saying:
It’s far better to buy a wonderful company at a fair price than a fair company at a wonderful price.
In Louis’ system, that means stocks growing sales, operating margins, and especially earnings. When a stock like that experiences a sell-off… then that’s a great opportunity.
This week, one of Louis’ Growth Investor stocks, Vistra Corp. (VST), reported outstanding earnings…and still took a hit from the market.
Here is Louis’ summary of its earnings report.
Vistra Corp. (VST) noted that 2024 was not only a “record year but a transformational one” for the company. Full-year earnings soared 88.5% year-over-year to $2.81 billion, compared to $1.5 billion in fiscal year 2023. Revenue rose 16.5% year-over-year to $17.22 billion, topping estimates for $17.15 billion.
For the fourth quarter, Vistra reported earnings of $490.0 million, up from a loss of $184.0 million in the same quarter a year ago.
Below is a screenshot of how the stock rates in Louis’ system. Despite outstanding earnings, the stock took a hit at the end of the week.
But you can also see that the stock is still an “A” in Louis’ Stock Grader system.
As I write Friday morning, Vistra is up more than 140% since Louis recommended exactly one year ago.
And it’s still below his “buy below” price, and that means Louis believes there is a lot more room left for growth!
Keith Kaplan, the CEO of our corporate partner TradeSmith also is a big fan of using data to invest wisely.
His own experience of allowing emotions to drive his investment decisions led him to develop computer systems that can pinpoint the right time to buy and sell any stock, and a set of indicators that can tell him when the market is headed for a rally or a plunge.
Despite widespread investor pessimism, Keith’s data suggests it could be a great time to grab stocks poised for profits. Here he is describing what he sees.
They say you should never try to catch a falling knife.
That’s certainly true… if you’re doing it without a plan.
But if you do it with the right stocks, buying into a downtrend and banking on a reversal can be quite lucrative.
A couple months back, we got the idea of designing a system that’s like catching a falling knife with Kevlar gloves on… where we minimize the risk and trade only the rarest setups with a strong track record of working.
We tested tons of different variables, and eventually we found one combination that produces a rare but quite reliable trading signal.
Keith and his team designed a system that helps investors take advantage of rare but reliable setups with a strong track record of success.
Here is one example from Keith’s back-testing.
One of the cleanest examples I’ve found – a case from 2022, in Caesars Entertainment (CZR).
The signal triggered at $32.36 on Sept. 30… and would’ve led to a 35.5% gain if you’d sold it 21 trading days later (on Oct. 31) for $43.73:
To be clear, there are losers too. No system is 100%.
But in Keith’s study, only one-fifth of the signals lost money, which makes for pretty good odds.
Our data shows that we’re in a rare kind of market that we previously only saw in 1996… and then 70 years earlier, in 1926.
If your market history is sharp, you know those were the early stages of massive investment manias that went far further and lasted much longer than anyone expected.
Both were powered by technological breakthroughs… financial institutions lowering the barrier for smaller investors to participate… and a consumer credit revolution that spurred the economy higher.
These are all things we’re seeing the beginnings of today. And what we’ve found is that these specific conditions signal the start of a “mega melt-up.”
Keith prepared a free demo where he shows how to find 10 “melt-up stocks” for the historic market conditions TradeSmith is picking up now.
We all work hard for the money we invest, so it’s difficult to watch the market plunge. But staying with the data and not acting emotionally is going to lead to greater profits over time.
California’s recent traumatic spate of wildfires has spotlighted the often clunky process of traditional commercial insurance.
Typically, businesses are required to document their losses, file a claim, and wait months or even years for reimbursement. Insurance companies must meticulously assess damages, verify that a claim was not excluded from the policy, and determine how much to pay. Midsize companies and multifamily property owners can go bankrupt waiting for reimbursement.
Some businesses are choosing another option that promises to get them help faster: parametric policies. Allied Market Research forecasts that the global parametric insurance market, which totaled $18 billion in 2023, will grow to more than $34 billion by 2033.
Parametric insurance has been around for years, covering catastrophes like tropical cyclones, other weather-related events, and earthquakes. These policies’ main advantage is a faster payout, since the insurer agrees to pay a predefined sum when a specific peril reaches a predefined magnitude. Payment is triggered by parameters that can be measured quickly, such as rainfall, hurricane category, or wind speed.
The insurer knows how much the insurance subscriber will pay, and the subscriber understands the amount of coverage it will get. Both are aware of the conditions necessary to green-light the payment.
Parametric policies are expensive: A $1 million wildfire insurance policy could require $50,000 in annual premium payments. But the increased frequency of natural disasters is emphasizing the need for faster procedures. Ten years ago, wildfires were considered secondary perils and not regarded as existential threats. The 2016 Fort McMurray fire in Alberta, Canada, changed that attitude within the insurance industry: The fire caused $3 billion in losses, which at that time was considered enormous.
Since then, wildfire costs in the US have multiplied, totaling $67 billion in insured losses in 2024, not counting the 2025 fires, according to reinsurer Munich Re.
Target is scheduled to post its fourth-quarter earnings report on Tuesday, with analysts seeing substantial upside for the retailer’s stock.
Sales and profit for Target are expected by analysts to decline from the same time a year ago, while comparable store sales are projected to rise.
Analysts have said lately that they expect Target will be conservative in its 2025 forecasts, and they are looking for updates on executive succession planning.
Target (TGT) is set to report fourth-quarter earnings on Tuesday morning, with analysts seeing substantial upside for the retailer’s stock.
Analysts’ ratings are split nearly evenly, with five “buy” and six “hold” ratings among the brokers who currently follow Target and are tracked by Visible Alpha. Their average price target of just under $145 suggests about 18% upside to Friday’s close and would put the stock back at late-January levels.
The retailer is expected to report revenue of $30.77 billion for the quarter and adjusted earnings per share of $2.26, down 3.6% and 24%, respectively, from the same time a year ago. At the same time, analysts expect comparable store sales to rise 1.39% year-over-year, a consensus figure that Morgan Stanley analysts noted this week has risen since Target lifted its comparable sales projection in January.
Analysts Expect Conservative 2025 Outlook, Question CEO Succession
Analysts from JPMorgan, Oppenheimer, and Morgan Stanley all said in recent notes that they expect Target will likely follow some of its retail rivals like Walmart (WMT) and Home Depot (HD) and remain conservative in their first-quarter and 2025 projections.
Despite a potential conservative 2025 forecast—and concerns over the impact of tariffs and inflation on discretionary spending—Oppenheimer analysts said they “continue to believe shares have bottomed” and said they would “take advantage of any volatility” after the report. They noted that Target shares have fallen after two of the past four earnings reports, with double-digit swings after four of the last five.
JPMorgan and Morgan Stanley analysts also raised the question of succession planning entering 2025, as CEO Brian Cornell recently passed 10 years in the top job. JPMorgan analysts said Cornell planned to stay for three more years as of September 2022, and said they believe an internal candidate to replace him is “most likely.”
Target shares are down about 18% over the last 12 months. They rose Friday, finishing the week a bit above $124 apiece.
Editor’s Note: This week has been volatile to say the least…
But if anything, that has me and my friends at TradeSmith even more fired up about the market ahead.
The fact is, we’re in a Mega Melt-Up. All the signs are there.
And if you make the right moves today, you’ll be set for a bull market that rivals the internet boom… while avoiding the inevitable bust.
TradeSmith CEO Keith Kaplan has some thoughts below on this week’s volatility… including how it’s convincing us even more that the Mega Melt-Up is on.
Read it below. And be sure to watch his biggest forecast in 20 years, in this brand-new special research presentation. He’ll also share 20 recommendations just for checking it out.
**************************
The market has taken us on a wild ride in 2025.
Between Chinese AI breakthroughs, radical shifts in trade policy, the Federal Reserve’s rate-cutting cycle, and now a surge in inflation expectations, the headlines have been all over the place.
Stocks are acting as you’d expect – soaring one week, shaking out weak hands the next.
All this wild price action has ultimately not taken us far. As I write, the Nasdaq 100 is basically flat from the start of the year…
And that’s especially painful, considering the 5.7% year-to-date gain we were looking at just a week ago.
All this chaos can’t help but make you wonder, “Are we heading for a crash?”
If you google that question, you’ll probably find a bunch of mainstream media headlines urging you to stay scared.
But I’m here to tell you something quite different:
This isn’t the beginning of a bear market.
On the contrary, it’s the setup for one of the biggest opportunities of your lifetime.
We’re smack in the middle of what my team has taken to calling a Mega Melt-Up.
We’ve gone through history and quantified the price action of the past few years. And what we found, shocking as it was, tells us that there’s only been two previous market environments like this one: the 1990s and the 1920s. And both were periods where individual companies rose thousands of percent in very short order.
If our research is correct, and I’m confident it is, the volatility we’ve seen this year isn’t a warning sign.
Instead, it’s even more evidence that we’re in a Mega Melt-Up… the kind that only comes around once or twice in a lifetime.
Three Bear Markets to a 1,000% Gain
Yes, the volatility we’re seeing right now actually supports the case for a Mega Melt-Up.
Let’s take a quick trip back in time.
Like what we’ve seen so far in the 2020s, the 1990s were a boom decade.
From 1995 to 2000, the Nasdaq 100 went up 1,000%.
But it wasn’t a straight shot up. In fact, there were more than two dozen major pullbacks in those five years…
Several of which you could consider an “official” bear market…
And each of which would prove a buying opportunity.
Let’s look at 1995-1996.
Starting in 1995, the Nasdaq 100 started to become a lot more volatile. From July 1995 to August 1996, the Nasdaq 100 posted drawdowns of 9.1%… 10.5%… 14%… 8.2%… and 14.4%. All in the span of one year:
What else happened back then? Well, in 1995 the Nasdaq 100 rose almost 40%. And the next year, it rose 22.7%.
Let’s skip ahead a bit to 1997-1998. We see the exact same thing.
Not only did the Nasdaq 100 retreat 20% in late 1997, creating a short-lived bear market… it saw two separate drawdowns of -22.2% and -19.1% within six months in 1998:
Yet once again, the index went up 21.6% in 1997 and 39.6% in 1998.
Finally, let’s look at 1999. Four major pullbacks in the double-digit range, and one final flush of nearly 9% before stocks took off into the end of the year:
What was the Nasdaq 100’s return in 1999? 101.95%… the highest ever.
The big takeaway from this is simple. You can’t have a Mega Melt-Up without massive price swings along the way.
This is exactly what we found in our research. Both the ‘90s Mega Melt-Up and the 1920s Mega Melt-Up were marked by a ton of volatility.
It’s the price you pay for the kind of extraordinary gains markets deliver in these times.
And, when you zoom out, it’s clear that it’s a small price to pay.
Now, by comparison, what we’re seeing in stocks right now isn’t anything like what I just showed you. The S&P 500 is 3% off its highs and the Nasdaq 100 is nearly 7% off its highs.
They can absolutely go lower from here, and that would not change my thinking onthis Mega Melt-Up one bit.
In fact, there’s an argument that the Melt-Up we’re about to see could be even bigger than the one in the ‘90s.
Why This Melt-Up Could Be Bigger Than the 1990s
The 1990s had three powerful forces fueling stocks:
The birth of the internet (what we’ve been calling a General Purpose Technology) and the associated new companies taking advantage of the trend.
The rise of online trading, making stocks more accessible than ever.
Easier monetary policy, where the Fed’s interest-rate cuts fueled a consumer credit boom.
These three forces are what we call Melt-Up Multipliers. For a Melt-Up to be truly powerful, it must have these specific three factors.
The 1920s saw the same thing, with electrification being the major technological breakthrough… margin lending making it possible for investors to own more stocks than they could buy… and a consumer credit boom powering the economy.
Today, we have these same three melt-up multipliers… and one more.
Artificial Intelligence: AI is today’s Internet moment – a technology that’s changing everything, from medicine to finance.
Zero-Commission Trading & Apps Like Robinhood: More retail money is flooding into the markets than ever before.
The Fed’s Rate Cuts: The Federal Reserve is slashing rates again, just like it did in the mid-90s.
Oh, and there’s a “wild card” fourth factor… President Donald Trump. Like him or not, his policies are market-friendly… And the last time he took office in 2017, the Nasdaq 100 surged 31.5%.
This is the perfect storm for a Mega Melt-Up.
But there’s a tricky thing to understand about melt-ups… and especially Mega Melt-Ups…
All melt-ups end the same way – in a meltdown.
Ride the Melt-Up and Avoid the Meltdown
The 1990s Melt-Up ended with the 2000 crash. The Roaring ’20s Melt-Up ended in the 1929 crash… and, even worse, the Great Depression.
And yes, this melt-up will end in a crash, too.
But that doesn’t mean you should sit on the sidelines. It means you need the right tools to capture the upside – and know exactly when to get out.
That’s why we built Trade360, our all-in-one software suite that’s designed to help you make the most out of every market environment.
And we recently made two big upgrades specifically to make it the perfect trading tool for a Mega Melt-Up period like we’re seeing now.
One is a tool that clearly identifies whether markets are in Melt-Up mode or not… and alerts you when that condition changes.
With this, you don’t have to second-guess whether or not we’ve seen a major top. You’ll get an alert that tells you when it’s time to get out before stocks crash.
The other is an advanced trading strategy that’s perfectly suited to melt-up environments.
Remember all those drawdowns in the Nasdaq 100 I showed you earlier?
If we’re seeing all that selling in the benchmark, you better believe we’re seeing it in individual stocks, too.
So, we designed a strategy that takes advantage of these short-term, extreme pullbacks in otherwise quality stocks.
When prices fall by a certain amount and at a certain pace, the strategy buys in… and sells the stock 21 trading days later.
This simple strategy has a near 80% win rate and average gains of around 16% – counting winners and losers.
And it works whether stocks are in a bull market, or a bear market… as it targets those rare occurrences where prices reach irrational extremes.