Archives 2025

10 Dividend Dynamos Combining High Yields With Robust Growth


Published on February 25th, 2025 by Bob Ciura

High dividend stocks means more income for every dollar invested. All other things equal, the higher the dividend yield, the better.

In this research report, we analyze 10 dividend dynamos offering high dividend yields of 5.0% and greater.

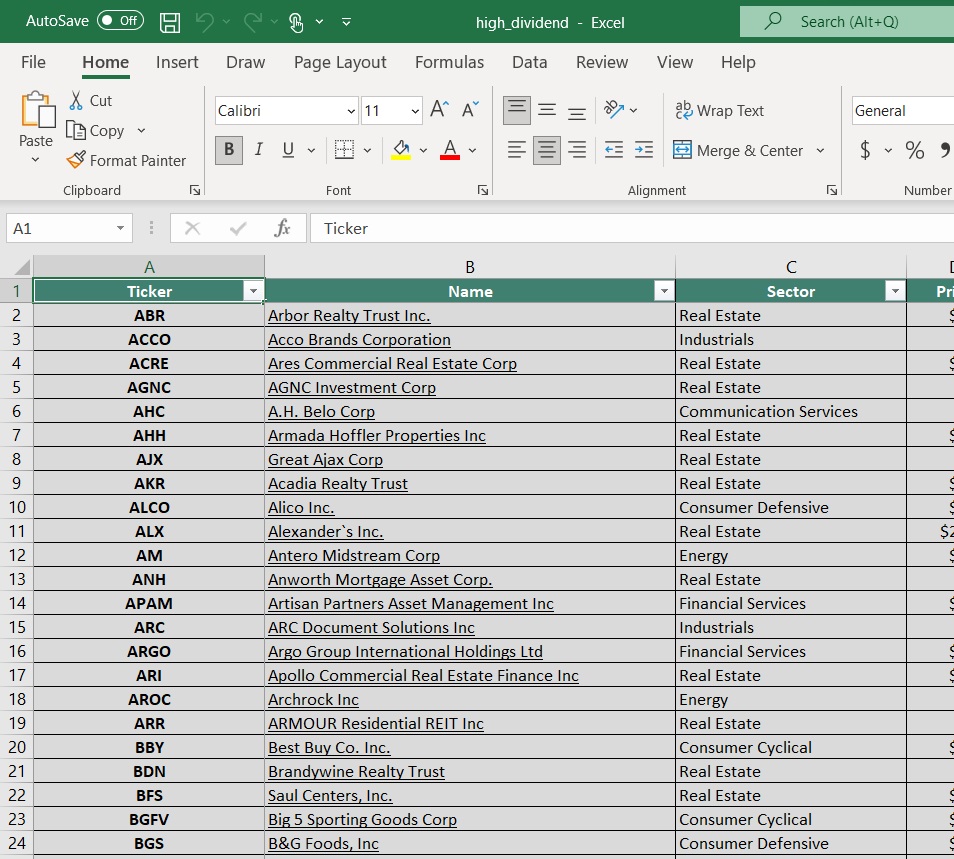
The free high dividend stocks list spreadsheet below has our full list of individual securities (stocks, REITs, MLPs, etc.) with with 5%+ dividend yields.

You can download a free copy by clicking on the link below:


Not only do the stocks in this article have high yields above 5%, they are also generating strong growth.

The combination of a high starting yield, plus long-term growth, could produce strong total returns in the years ahead.

To qualify for this list, we screened out any high-yield stocks with our lowest Dividend Risk Score of ‘F’, to try to filter out stocks in danger of cutting their dividends.

The 10 stocks are sorted by five-year expected underlying business growth, from lowest to highest.

Table of Contents

Dividend Dynamo #10: Bank of Nova Scotia (BNS)

  • 5-year annual expected business growth: 5.0%

Bank of Nova Scotia (often called Scotiabank) is the fourth-largest financial institution in Canada behind the Royal Bank of Canada, the Toronto-Dominion Bank and Bank of Montreal.

Scotiabank reports in four core business segments – Canadian Banking, International Banking, Global Wealth Management, and Global Banking & Markets.

Scotiabank reported fiscal Q4 and full-year 2024 results on 12/03/24. For the quarter, revenue rose 3.1% to C$8.5 billion, while non-interest expenses fell 4.2% to C$5.3 billion. Provision for credit losses (“PCL”) declined by 18% year over year (“YOY”) to C$1.0 billion, weighing less on earnings compared to a year ago.

As a result, net income rose 25% to C$1.7 billion and diluted earnings per share (“EPS”) rose 23% to C$1.22. The bank’s PCL as a percentage of average net loans & acceptances was 0.54%, down from 0.65% a year ago, whereas the PCL on impaired loans as a percentage of average net loans & acceptances was 0.55%, up from 0.42% a year ago.

The fiscal year saw revenue rising 4.5% to C$33.7 billion. Non-interest expenses increased by 3.0% to C$19.7 billion, while PCL rose 18% to C$4.1 billion.

The PCL as a percentage of average net loans & acceptances was 0.53%, up from 0.44% a year ago, whereas the PCL on impaired loans as a percentage of average net loans & acceptances was 0.46%, up from 0.32% a year ago.

Click here to download our most recent Sure Analysis report on BNS (preview of page 1 of 3 shown below):

Dividend Dynamo #9: Canandaigua National Corporation (CNND)

  • 5-year annual expected business growth: 5.0%

Canandaigua National Corporation (CNC) is the parent company of The Canandaigua National Bank & Trust Company (CNB) and Canandaigua National Trust Company of Florida (CNTF), offering a wide range of financial services, including banking, lending, mortgage services, trust, investment management, and insurance.

With 23 branches across its service areas, CNC is focus on serving local communities by providing personalized financial solutions to individuals, businesses, and municipalities. CNC emphasizes community banking, focusing on reinvesting in the local economy through a diverse lending portfolio.

Moving forward, we expect CNC’s EPS to grow at a CAGR of 5%. Note that the company has increased its dividend every year since 2002, marking 22 years of consecutive annual dividend increases.

Click here to download our most recent Sure Analysis report on CNND (preview of page 1 of 3 shown below):

Dividend Dynamo #8: United Bancorp, Inc. (UBCP)

  • 5-year annual expected business growth: 6.0%

United Bancorp a financial holding company based in the United States, operating primarily through its wholly-owned subsidiary, United Bank.

The company offers a wide range of banking services including retail and commercial banking, mortgage lending, and investment services.

Some of its other solutions include checking and savings accounts, personal and business loans, as well as wealth management.

On August 22nd, 2024, United Bancorp raised its dividend by 1.4% to a quarterly rate of $0.1775. On a year-over-year basis, this was a 4.4% increase.

On November 6th, 2024, United Bancorp posted its Q3 results for the period ending September 30th, 2024. The company reported total interest income of $9.94 million, which was up 3.0% year-over-year.

This growth was primarily driven by a 13.9% rise in interest income on loans, despite a 32.9% decline in loan fee income and a 15.2% decrease in interest income from securities.

However, total interest expenses increased by about 23.4%, leading to a 6.5% decline in net interest income, which fell to $6.1 million.

Click here to download our most recent Sure Analysis report on UBCP (preview of page 1 of 3 shown below):

Dividend Dynamo #7: Edison International (EIX)

  • 5-year annual expected business growth: 6.7%

Edison International is a renewable energy company that is active in energy generation and distribution. It also operates an energy services and a technologies business. The company was founded in 1987 and is headquartered in Rosemead, CA.

On October 29, 2024, Edison International reported its financial results for the third quarter ended September 30, 2024.

The company delivered a GAAP net income of $516 million, or $1.33 per diluted share, marking a substantial increase from $155 million, or $0.40 per diluted share, in the same quarter last year.

On an adjusted basis, Edison achieved core earnings of $582 million, or $1.51 per diluted share, up from $531 million, or $1.38 per diluted share, in Q3 2023.

Revenue for the quarter was $5.20 billion, reflecting a 10.61% year-over-year growth and surpassing expectations by $192.39 million.

Click here to download our most recent Sure Analysis report on Edison International (EIX) (preview of page 1 of 3 shown below):


Dividend Dynamo #6: Magna International Inc. (MGA)

  • 5-year annual expected business growth: 7.0%

Magna International Inc. is dual-listed on the New York Stock Exchange and the Toronto Stock Exchange. The company began working with General Motors (GM) back in 1957.

Since then, it has become the largest automotive supplier in North America and the fourth-largest in the world. Magna has increased its dividend every year since 2010.

Magna reported its Q4 and full-year 2024 results on 02/14/2025. For the quarter, its sales were $10.6 billion – 2.0% higher versus a year ago – in-line with the global light vehicle production. Magna’s income from operations before income taxes rose 23% to $381 million.

Adjusted earnings before interest and taxes (“EBIT”) rose 23% to $689 million and adjusted earnings per share (“EPS”) of $1.69 rose 27% year over year (“YOY”).

The full-year results provide a bigger picture. Sales were essentially flat at $42.8 billion. Adjusted EBIT rose 4.1% to $2.3 billion. And the adjusted EPS declined 1.5% to $5.41. Magna increased its quarterly dividend by 2.1%, equating an annualized payout of $1.94.

Magna initiated its 2025 sales forecast at $38.6-$40.2 billion and adjusted EBIT margin at 5.3-5.8%.

Click here to download our most recent Sure Analysis report on MGA (preview of page 1 of 3 shown below):

Dividend Dynamo #5: AES Corp. (AES)

  • 5-year annual expected business growth: 7.0%

The AES (Applied Energy Services) Corporation was founded in 1981 as an energy consulting company. It now has businesses in 14 countries and a portfolio of approximately 160 generation facilities.

AES produces power through various fuel types, such as gas, renewables, coal, and oil/diesel. The company has more than 36,000 Gross MW in operation.

AES Corporation reported third quarter results on October 31st, 2024, for the period ending September 30th, 2024. Adjusted EPS rose 18% to $0.71 for Q3 2024.

The company constructed and acquired 2.8 GW of renewable energy year-to-date, and is on course to add 3.6 GW of new projects online in 2024.

Source: Investor Presentation

Leadership expects to achieve the high end of its 2024 guidance for adjusted EPS of $1.87 to $1.97 for the full fiscal year. Additionally, the company reaffirms it also still expects annual EPS growth of 7% to 9% from 2023 through 2027.

The company is actively engaged in developing and acquiring new energy projects.

It currently has a backlog of 12.7 GW of renewables. AES expects to complete the majority of these projects through 2027.

Click here to download our most recent Sure Analysis report on AES (preview of page 1 of 3 shown below):

Dividend Dynamo #4: Brookfield Infrastructure Partners LP (BIP)

  • 5-year annual expected business growth: 7.0%

Brookfield Infrastructure Partners L.P. is one of the largest global owners and operators of infrastructure networks, which includes operations in sectors such as energy, water, freight, passengers, and data.

Brookfield Infrastructure Partners is one of four publicly-traded listed partnerships that is operated by Brookfield Asset Management (BAM).

BIP has delivered 8% compound annual distribution growth over the past 10 years.

Source: Investor Presentation

BIP reported resilient results for Q4 2024 on 01/30/25. The diversified utility reported funds from operations of $646 million, up 3.9% year over year. FFO per unit was $0.82, up 3.8%.

For the full year, FFO per unit was $3.12, up 5.8% from the previous year. Normalized for the impact of foreign exchange, the FFOPU growth would have been 10%, which better reflects the business’s operational strength.

For the year, it achieved its target of $2 billion capital recycling proceeds. It also deployed +$1.1 billion across its backlog of organic growth projects and three tuck-in acquisitions, which should help contribute to growth. It also added ~$1.8 billion of new projects to its capital backlog.

Click here to download our most recent Sure Analysis report on Brookfield Infrastructure Partners (preview of page 1 of 3 shown below):

Dividend Dynamo #3: United Parcel Service (UPS)

  • 5-year annual expected business growth: 8.0%

United Parcel Service is a logistics and package delivery company that offers services including transportation, distribution, ground freight, ocean freight, insurance, and financing.

Its operations are split into three segments: US Domestic Package, International Package, and Supply Chain & Freight.

On January 30th, 2025, UPS reported fourth quarter 2024 results for the period ending December 31st, 2024. For the quarter, the company generated revenue of $25.3 billion, a 1.5% year-over-year increase.

Source: Investor Presentation

The U.S. Domestic segment (making up 68% of sales) saw a 2.2% revenue increase, with International also posting a 6.9% revenue increase, while Supply Chain Solutions saw a 9.1% decrease. Adjusted net income equaled $2.75 per share, up 11.3% year-over-year.

The company announced it is reducing its largest customer’s volume by over 50% by H2 2026, insourced 100% of its UPS SurePost product, and is redesigning its end-to-end process to deliver $1 billion in savings.

Click here to download our most recent Sure Analysis report on UPS (preview of page 1 of 3 shown below):

Dividend Dynamo #2: HA Sustainable Infrastructure Capital (HASI)

  • 5-year annual expected business growth: 9.0%

Hannon Armstrong is a U.S. public company that invests in climate change solutions, providing capital to leading companies in energy efficiency, renewable energy, and other sustainable infrastructure markets.

The company’s portfolio of assets is worth around $13.1 billion and is split between three market segments: Its Behind the Meter business (46% of assets) focuses on the installation of solar power, electric storage, and other heat and power systems.

The Grid-Connected segment (30% of assets) involves investments in grid-connected renewable energy projects, such as solar and off/on-shore wind projects, whose generated yield the company then sells on the wholesale energy markets.

Finally, occupying the rest of its portfolio (24% of assets), are the company’s Fuels, Transport, & Nature projects, enabling the use of natural resources, such as its projects to slow pollution runoff across the Chesapeake Bay region.

Source: Investor Presentation

On November 7th, 2024, Hannon Armstrong reported its Q3 results for the period ending September 30th, 2024. For the quarter, total revenues fell by 8.5% year-over-year to about $82 million.

The drop in revenues was mainly due to lower rental income due to asset sales as well as lower gains on assets sold compared to last year.

Adjusted EPS fell by 16% to $0.52 compared to the prior-year period. The drop was mainly due to lower revenues, offset partially by growth in adjusted net investment income due to a larger portfolio.

The company’s pipeline remained robust, including $5.5 billion of asset opportunities. Management affirmed its prior outlook, expecting to deliver adjusted EPS CAGR between 8% and 10% through 2026.

Click here to download our most recent Sure Analysis report on HASI (preview of page 1 of 3 shown below):

Dividend Dynamo #1: Whirlpool Corp. (WHR)

  • 5-year annual expected business growth: 11.0%

Whirlpool Corporation, founded in 1955 and headquartered in Benton Harbor, MI, is a leading home appliance company with top brands Whirlpool, KitchenAid, and Maytag.

Roughly half of the company’s sales are in North America, but Whirlpool does business around the world under twelve principal brand names. The company, which employs about 44,000 people, generated nearly $17 billion in sales in 2024.

Source: Investor Presentation

On January 29th, 2025, Whirpool reported fourth quarter 2024 results. Sales for the quarter totaled $4.14 billion, down 18.7% from fourth quarter 2023. Ongoing earnings per diluted share was $4.57 for the quarter, 19% higher than the previous year’s $3.85 per share.

Whirlpool issued its 2025 guidance, seeing ongoing earnings-per-share coming in at approximately $10.00 on revenue of $15.8 billion. Additionally, Whirlpool expects cash provided by operating activities to total roughly $1 billion, with $500 to $600 million in free cash flow.

Click here to download our most recent Sure Analysis report on WHR (preview of page 1 of 3 shown below):

Final Thoughts

High dividend stocks are naturally appealing to income investors, especially when the S&P 500 Index is only yielding roughly 1.3% on average.

Even better, these 10 dividend dynamos combine a high current yield, with the potential for long-term business growth. In this way, they could provide strong total returns through the combination of growth and yield.

Investors should continue to monitor each stock to make sure their fundamentals and growth remain on track, particularly among stocks with extremely high dividend yields.

Additional Reading

If you are interested in finding other high-yield securities, the following Sure Dividend resources may be useful:

High-Yield Individual Security Research

Other Sure Dividend Resources

Thanks for reading this article. Please send any feedback, corrections, or questions to [email protected].


Source link

How to Find Success in Today’s Volatile Stock Market


Another day, another crazy roller-coaster ride for the stock market…

This has been the trend since Halloween. 

That is, in November, the S&P 500 rose 5.73%, achieving one of its best months in a year on optimism about potential deregulation and tax cuts under the Trump administration.

Then, as investors began to fear that the U.S. Federal Reserve wouldn’t cut interest rates anymore, stocks crashed 2.5% in December. It turned out to be one of their worst months in a year. 

As we moved into 2025, stocks rebounded throughout January and early February thanks to renewed economic optimism… 

But they’ve since crashed over the past few weeks as uncertainty about tariffs, federal spending cuts, and an economic slowdown weighs heavy on Wall Street. Indeed, since Feb. 10, the S&P has slid nearly 1.2%. 

Stocks have swung violently higher and lower many times over the past several months. In that time, we’ve seen just 5% gains in the S&P 500 and a negative return from the small-cap Russell 2000

Is this intense volatility Wall Street’s ‘new normal’?

It may be… 

A Bumpy Ride Higher?

Don’t get me wrong; I still think stocks are going higher in 2025. 

Despite renewed concerns about inflation and a consumer spending slowdown, the economy still appears to be on stable footing. It should benefit from deregulation and maybe even tax cuts over the next few months. Plus, the AI Boom remains alive and well, which should continue to create growth through the economy. 

We’re also nearing the end of the fourth-quarter earnings season, and broadly speaking, it was a strong one.

As we mentioned in a recent issue on earnings, more than 75% of the companies in the S&P 500 (as of Feb. 18) have beaten Wall Street’s profit estimates, meaning they made more money last quarter than analysts expected. 

Meanwhile, the blended earnings growth rate is nearly 17%, which marks the index’s highest profit growth rate since 2021.

And trends are expected to stay strong for the foreseeable future. That is, next quarter, earnings are projected to rise about 8%, then another 9% in Q2. They are expected to rise almost 15% in the third quarter and about 13% in the fourth.

In other words, corporate earnings should keep rising for the rest of the year. Stock prices should follow suit. 

However… I don’t think it’ll be a smooth ride higher…  

Largely because of U.S. President Donald Trump.


Source link

Aussie weaker as US growth fears weigh – United States


Written by Steven Dooley, Head of Market Insights, and Shier Lee Lim, Lead FX and Macro Strategist

US bond yields, crypto lead losses 

The Australian dollar and other risk-sensitive currencies were weaker overnight as growth concerns around the US economy continued to weigh.

The US economy has been the clear leader over the last three years but a recent slowdown in key data has sparked fears the US might be facing a slowdown.

In markets, the shift has been most notable in US bond markets, with the US ten-year bond yield dropping from 4.63% to 4.30% in just two weeks.

Cryptocurrency markets have also tumbled with Bitcoin falling from USD106k to USD88k over the last month.

US shares have been less affected with the S&P 500 down only 3.3% from the recent highs but the so-called Magnificent Seven index of leading tech stocks is down 12.4%. since mid-December.

In FX markets, the AUD/USD fell 0.1% as it extended losses from last week’s two-month highs.

The NZD/USD fell 0.2%. The USD/SGD gained 0.2% while USD/CNH was flat.

Chart showing AUD/USD lower on growth fears

ECB minutes to test EUR ceiling

This Thursday, the minutes of the most recent European Central Bank meeting will be released.

The January ECB meeting went very smoothly; as anticipated, the guidance remained intact, and the deposit rate was lowered by 25 basis points.

Madam Lagarde did note that the ECB Governing Council thought the neutral rate was slightly higher than pre-pandemic.

After the early-February headline-driven whipsaw, EUR/USD faces resistance around the 1.053 Dec 78.6% retrace, 1.0533 Jan 27 high, and 1.0552 Sep 38.2% retrace.

Following the impulsive decline from the high of 1.1214 on September 25, the Nov-Feb price action now appears to be a possible base pattern, potentially leading to further EUR/USD gains.

In the AUD/EUR, the euro strength could see the AUD/EUR fall below 0.6000. For EUR/SGD wise, it will need to break the 50-day EMA of 1.4069 to be on an upward trend.

Chart showing EUR/USD faces few key Fibonacci resistance

BOT hold can’t save fragile THB

We anticipate that the Bank of Thailand will maintain its policy rate at 2.25% today. Since the Bank of Thailand stated that it wishes to maintain the small policy space. In Asia, we expected the BOT will maintain its policy rate at 2.25% today. Any effectiveness of a cut could be diminished during the period of uncertainty and while the MPC continues to assess global policy uncertainty, which is likely to take some time.

However, we anticipate that the BOT will sound dovish in its policy statement by highlighting negative risks to the economic forecast and reiterating its guidance that it is prepared to alter its policy, if needed, which was absent from the last two MPC statements.

In December, we anticipate dissenting votes for a 25bps cut from a unanimous “on hold” conclusion.

We predict a cut in April, but all of these variables should be viewed as dovish outcomes that pave the way for one. USD/THB is currently at its two-month low. The next key resistance for USDTHB to resume its upward trend will be to break the 50-day EMA of 33.95 and 200-day EMA of 34

Chart showing BOT's 2025 GDP growth prediction of 2.9%

Global bond yields slide on slowdown worries

Table: seven-day rolling currency trends and trading ranges  

Table: seven-day rolling currency trends and trading ranges

Key global risk events

Calendar: 24 February – 1 March  

Key global risk events calendar: 24 February – 1 March

All times AEDT

Have a question? [email protected]

*The FX rates published are provided by Convera’s Market Insights team for research purposes only. The rates have a unique source and may not align to any live exchange rates quoted on other sites. They are not an indication of actual buy/sell rates, or a financial offer.


Source link

Indonesia: Building The Future Of Southeast Asia


Traditionally dependent on hydrocarbons and minerals, Indonesia’s digital economy is now booming thanks to high internet penetration and a tech-savvy population. The country’s tropical climate and enormous geothermal resources also offer compelling opportunities for early investors in carbon-free energy.

Monopolies ‘Diminished’

Indonesia endured decades of miliary dictatorship following independence from Dutch colonists. And since the fall of strongman President Suharto’s regime in 1998, the country became a democracy. This was “unthinkable in the Suharto era,” Richard Borsuk, co-author of “Liem Sioe Liong’s Salim Group: The Business Pillar of Suharto’s Indonesia,” says.

“There’s also good fiscal management, a plus for investors,” he adds. “Overall business competition has increased and monopoly power has diminished.”

The downside? Investors used to Singapore’s “benign smoothness” should be patient with the long time it can take to get things done in Indonesia.

“The bureaucracy can be daunting,” Borsuk adds, also explaining that—in Indonesia, as in much of Asia—relationships are key. His solution? Choose partners carefully, and build connections with them.

Recent Election

Subianto campaigned by pledging “continuity” with the policies of his predecessor, Joko (Jokowi) Widodo. One of Subianto’s programs is to give children from poorer families good nutrition to help them grow up healthy. “This will be very expensive to provide nationwide, but Prabowo is going to push it hard,” Borsuk says.

Indonesia’s previous regime also initiated an ambitious and costly plan to move the capital from Jakarta to a new site on Borneo. It remains uncertain whether Prabowo will prioritize this project.

Shalini Kamal Sharma has been doing business in Indonesia since 2004. “Through our company Formula One Furniche, we supply customized [furniture, fixtures, and equipment] to hotels, resorts, and service apartments worldwide, with a strong focus on sustainability,” she explains. “Indonesia is a substantial and growing market for us.”

Indonesia’s hospitality real estate sector is currently $2.1 billion. It’ll get to $3.65 billion by 2030, with a compound annual growth rate exceeding 12%, analysts say.

Sharma points to the active role of Jakarta in encouraging inward investment. “The government—through BKPM [the Ministry of Investment’s investment coordinating board]—is highly responsive to the business community. We have been invited by BKPM to look at specific opportunities, which is a major change and very encouraging.”

BKPM is the primary agency that supports foreign investors and acts as a bridge between investors and the government. “They engage with foreign investors and, as we have learned, are quite proactive in assisting potential investors,” she says.

In a country once lambasted for its challenging bureaucracy, she points to major changes here too. “Getting products through customs has become far easier of late,” she notes.

A Country Of Superlatives

Joel Shen, a lawyer based in Jakarta and Singapore, who heads Withersworldwide’s technology practice in Asia, boasts that “Indonesia is a country of superlatives and is an attractive investment destination with a number of very clear advantages.”

Indonesia, notwithstanding a contraction in its middle class, “is expected to be the third-largest contributor to the global middle class over the next decade, after only India and China,” he says.

Besides being the largest economy in Southeast Asia, it’s the region’s only country in the G20, making it hard to ignore.

In 2023, Indonesia joined the Regional Comprehensive Economic Partnership, which includes all 10 ASEAN countries, plus Australia, China, Japan, New Zealand, and South Korea. “RCEP is the world’s largest free trade agreement (FTA), covering about 30% of global GDP and nearly one-third of the global population,” Shen says.

Indonesia also produces home-grown commodities: from palm oil, an ingredient in many fast-moving consumer goods (i.e., foods, cosmetics, soaps, and biofuels); to nickel, which is essential in the production of electric-vehicle batteries.

Coupled with its ongoing infrastructure development and reforms to improve business, “Indonesia presents numerous opportunities for investors,” Shen says.

The Digital Upside

Beyond demographics and natural resources, Indonesia’s economy is rapidly transforming digitally, fueled by mobile-first consumers, according to Shen.

Google, Temasek, and Bain & Company, in their 2024 e-Conomy Southeast Asia report, named Indonesia the fastest-growing large internet market.

“Investing in Indonesia has indeed become more accessible due to a combination of regulatory reforms and digitalization,” says Shen. The Omnibus Law on Job Creation, for example, simplifies business licensing, reduces restrictions on foreign ownership, and improves what had been onerous tax and labor regulations.

There’s also the Risk-Based Online Single Submission system, an online platform that makes it easier for low-risk foreign investors to incorporate Indonesian companies and obtain business licenses.

Tax holidays, tax allowances, and other benefits are also available to encourage investment in sectors and regions prioritized by the government.


Source link

10 Best Dividend Aristocrats You’ve Never Heard Of


Updated on February 26th, 2025 by Bob Ciura
Spreadsheet data updated daily

We recommend long-term investors focus on high-quality dividend stocks. To that end, we view the Dividend Aristocrats as among the best dividend stocks to buy-and-hold for the long run.

The Dividend Aristocrats have a long history of outperforming the market when it comes to risk-adjusted returns. There are currently 69 Dividend Aristocrats.

You can download an Excel spreadsheet of all 69 Dividend Aristocrats (with metrics that matter such as dividend yields and price-to-earnings ratios) by clicking the link below:


Disclaimer: Sure Dividend is not affiliated with S&P Global in any way. S&P Global owns and maintains The Dividend Aristocrats Index. The information in this article and downloadable spreadsheet is based on Sure Dividend’s own review, summary, and analysis of the S&P 500 Dividend Aristocrats ETF (NOBL) and other sources, and is meant to help individual investors better understand this ETF and the index upon which it is based. None of the information in this article or spreadsheet is official data from S&P Global. Consult S&P Global for official information.

This article begins with an overview of the Dividend Aristocrats list. Then, we list our top 10 Dividend Aristocrats you’ve never heard of.

The list is comprised of 10 Dividend Aristocrats, all of which have raised their dividends for over 25 years in a row, and are included in the S&P 500 Index.

In addition, these 10 Dividend Aristocrats tend to get much less coverage in the financial media, and have smaller followings than the largest Dividend Aristocrats.

Table of Contents

Dividend Aristocrats Overview

The requirements to be a Dividend Aristocrat are:

  • Be in the S&P 500
  • Have 25+ consecutive years of dividend increases
  • Meet certain minimum size & liquidity requirements

All Dividend Aristocrats are high-quality businesses based on their long dividend histories. A company cannot pay rising dividends for 25+ years without having a strong and durable competitive advantage.

But not all Dividend Aristocrats make equally good investments today. That’s where the spreadsheet in this article comes into play. You can use the Dividend Aristocrats spreadsheet to quickly find quality dividend investment ideas.

The list of all 69 Dividend Aristocrats is valuable because it gives you a concise list of all S&P 500 stocks with 25+ consecutive years of dividend increases (that also meet certain minimum size and liquidity requirements).

A sector breakdown of the Dividend Aristocrats Index is shown below:

The top 2 sectors by weight in the Dividend Aristocrats are Industrials and Consumer Staples. The Dividend Aristocrats Index is tilted toward Consumer Staples and Industrials relative to the S&P 500.

These 2 sectors make up over 40% of the Dividend Aristocrats Index, but less than 20% of the S&P 500.

The Dividend Aristocrats Index is also significantly underweight the Information Technology sector, with a ~3.5% allocation compared with over 20% allocation within the S&P 500.

The Dividend Aristocrat Index is filled with stable industry giants with market caps above $200 billion, such as Coca-Cola (KO), ExxonMobil (XOM), and Johnson & Johnson (JNJ).

However, there are smaller Dividend Aristocrats that are worth paying attention to. The following 10 Dividend Aristocrats have strong business models, durable competitive advantages, and long-term dividend growth potential.

Dividend Aristocrat You’ve Never Heard Of: FactSet Research Systems (FDS)

FactSet Research Systems is a financial data and analytics firm founded in 1978. It provides integrated financial information and analytical tools to the investment community in the Americas, Europe, the Middle East, Africa, and Asia-Pacific.

The company provides insight and information through research, analytics, trading workflow solutions, content and technology solutions, and wealth management.

Source: Investor Presentation

On December 19th, 2024, FactSet Research Systems announced Q1 2025 results, reporting non-GAAP EPS of $4.37 for the period, beating market consensus by $0.09 while revenue rose 4.9% to $568.7 million.

FactSet Research Systems kicked off fiscal 2025 with solid, yet measured growth in Q1, reporting GAAP revenues of $568.7 million, a 4.9% year-over-year increase.

The revenue boost was driven by strong performance across its wealth management, asset owner, and institutional client segments.

Organic Annual Subscription Value (ASV), a key performance metric, rose 4.5% to $2.25 billion, reflecting sustained demand for FactSet’s financial data and analytics solutions.

FactSet has grown its earnings-per-share by an average compound growth rate of 10.3% over the last 10 years. Its investments and improved product offerings could lead to significant margin expansion in the following years.

We have increased our EPS estimate for 2025 to $17.10, matching the midpoint of the management’s guidance, but we have maintained our 8.5% annual earnings growth forecast for the next five years.

Click here to download our most recent Sure Analysis report on FDS (preview of page 1 of 3 shown below):

Dividend Aristocrat You’ve Never Heard Of: Erie Indemnity (ERIE)

Erie Indemnity is an insurance company that has established itself in life insurance, auto, home, and commercial insurance. The company’s history dates to the 1920s.

Erie Indemnity reported its third quarter earnings results on October 31. Revenue totaled $999 million during the quarter, up 16% year-over-year.

Revenue growth was driven by higher management fee revenues (for policy issuance and renewal services), which rose by 19% year-over-year. Administrative services fee revenue grew 6%.

Erie Indemnity’s investment income was up substantially on a year-over-year basis during the quarter, which can be explained by tailwinds from higher interest rates.

Erie Indemnity generated GAAP earnings-per-share of $3.06 during the third quarter, which was up by 20% year-over-year.

Like other insurance companies, Erie Indemnity has a sizable float–cash that it has received through premiums that it invests. Therefore, its financial results are somewhat dependent on market rates.

We believe that Erie Indemnity should be able to grow its profits at a mid-single-digit rate over the next five years.

Growth will be driven by higher premium revenue, while further increases in investment income could have a positive impact on EPS growth as well.

Click here to download our most recent Sure Analysis report on ERIE (preview of page 1 of 3 shown below):

Dividend Aristocrat You’ve Never Heard Of: Eversource Energy (ES)

Eversource Energy is a diversified holding company with subsidiaries that provide regulated electric, gas, and water distribution service in the Northeast U.S.

FactSet, Erie Indemnity, and Eversource Energy are the three new Dividend Aristocrats for 2025.

The company’s utilities serve more than 4 million customers after acquiring NStar’s Massachusetts utilities in 2012, Aquarion in 2017, and Columbia Gas in 2020.

Eversource has delivered steady growth to shareholders for many years.

Source: Investor Presentation

On February 11th, 2025, Eversource Energy released its fourth-quarter and full-year 2024 results. For the quarter, the company reported net earnings of $72.5 million, a significant improvement from a net loss of $(1,288.5) million in the same quarter of last year, which reflected the impact of the company’s exit from offshore wind investments.

The company reported earnings per share of $0.20, compared with a loss per share of $(3.68) in the prior year. For the full year 2024, Eversource reported GAAP earnings of $811.7 million, or $2.27 per share, compared with a full-year 2023 loss of $(442.2) million, or $(1.26) per share.

On a non-GAAP recurring basis, the company earned $1,634.0 million, or $4.57 per share, representing a 5.3% increase from 2023.

Click here to download our most recent Sure Analysis report on ES (preview of page 1 of 3 shown below):


Dividend Aristocrat You’ve Never Heard Of: Air Products & Chemicals (ADP)

Air Products & Chemicals is one of the world’s largest producers and distributors of atmospheric and process gases, serving other businesses in the industrial, technology, energy, and materials sectors.

Air Products & Chemicals operates through three main business units: Industrial Gases – Americas, Industrial Gases EMEA, and Industrial Gases – Asia.

The company has a long track record of generating consistent growth.

Source: Investor Presentation

Air Products & Chemicals reported financial results for the fourth quarter of fiscal 2024 on November 7. The company generated revenues of $3.19 billion during the quarter, which was up 0.3% year-over-year, missing the analyst consensus estimate by $30 million.

Air Products & Chemicals was able to generate earnings-per-share of $3.56 during the fourth quarter, which was up 13% compared to the previous year’s period.

Click here to download our most recent Sure Analysis report on APD (preview of page 1 of 3 shown below):


Dividend Aristocrat You’ve Never Heard Of: Fastenal Co. (FAST)

Fastenal began in 1967 when Bob Kierlin and four friends pooled together $30,000 to open the first store. The original intent was to dispense nuts and bolts via vending machine, but that idea got off the ground after 20 years.

The company went public in 1987 and today provides fasteners, tools and supplies to its customers via 1,597 public branches, 1,986 active Onsite locations and over 123,000 managed inventory devices.

Source: Investor Presentation

In mid-January, Fastenal reported (1/17/25) results for the fourth quarter of fiscal 2024. It grew its net sales 4% over the prior year’s quarter thanks to growth in Onsite locations while prices remained flat.

Earnings-per-share remained flat at $0.46, missing the analysts’ consensus by $0.02. Fastenal has missed the analysts’ estimates only twice in the last 21 quarters.

It posted record earnings-per-share in 2022 and 2023 and remained close to its record earnings last year, as an increase in Onsite locations almost offset the effect of a soft manufacturing environment.

Click here to download our most recent Sure Analysis report on FAST (preview of page 1 of 3 shown below):


Dividend Aristocrat You’ve Never Heard Of: Brown & Brown (BRO)

Brown & Brown Inc. is a leading insurance brokerage firm that provides risk management solutions to both individuals and businesses, with a focus on property & casualty insurance. Brown & Brown has a notably high level of insider ownership.

Brown & Brown posted fourth quarter and full-year earnings on January 27th, 2025, and results were better than expected on both the top and bottom lines.

The company posted adjusted earnings-per-share of 86 cents for the quarter, beating estimates by nine cents. Revenue soared 15% year-over-year to $1.18 billion, besting expectations by $60 million.

Revenue was up 15.4% year-over-year, with 13.8% of that being organic revenue growth and the balance from acquisitions. Income before taxes came to $275 million, falling 23% year-over-year as margin fell from 23.2% from 34.7% of revenue.

Its competitive advantage comes from its willingness to execute small and frequent acquisitions. This growth-by-acquisition strategy gives the company an enduring opportunity to continue growing its business for the foreseeable future.

Click here to download our most recent Sure Analysis report on BRO (preview of page 1 of 3 shown below):

Dividend Aristocrat You’ve Never Heard Of: C.H. Robinson Worldwide (CHRW)

Charles Henry Robinson founded C.H. Robinson Worldwide in the early 1900s. The company is now an American Fortune 500 provider of multimodal transportation services and third-party logistics.

The company’s services are freight transportation, transportation management, brokerage, and warehousing. CHRW also offers truckload, air freight, intermodal, and ocean transportation.

On October 30st, 2024, C.H. Robinson Worldwide reported results for the third quarter for Fiscal Year (FY)2024. The company reported strong financial results for the third quarter of 2024, ending September 30.

The company achieved a significant 15.5% increase in gross profits, totaling $723.8 million, and a 58.7% rise in income from operations to $180.1 million.

Adjusted operating margin grew by 660 basis points to 24.5%, with adjusted earnings per share increasing 45.5% to $1.28. These results were driven by disciplined volume growth, improvements in operating leverage, and enhanced profitability across divisions.

Click here to download our most recent Sure Analysis report on CHRW (preview of page 1 of 3 shown below):


Dividend Aristocrat You’ve Never Heard Of: Albemarle (ALB)

Albemarle is the largest producer of lithium and second largest producer of bromine in the world. The two products account for nearly two-thirds of annual sales. Albemarle produces lithium from its salt brine deposits in the U.S. and Chile.

The company has two joint ventures in Australia that also produce lithium. Albemarle’s Chile assets offer a very low-cost source of lithium. The company operates in nearly 100 countries.

On February 12th, 2025, Albemarle announced fourth quarter and full year results. For the quarter, revenue fell 48% to $1.23 billion and was $110 million less than expected.

Source: Investor Presentation

Adjusted earnings-per-share of -$1.09 compared very unfavorably to $1.85 in the prior year and was $0.42 below estimates.

For the year, revenue declined 44% to $5.4 billion while adjusted earnings-per-share was -$2.34.

Results were impacted by asset write-offs and weaker average prices for lithium. For the quarter, revenue for Energy Storage was down 63.2% to $616.8 million.

This segment was impact by weaker volumes (-10%) and lower prices (-53%). Revenues for Specialties were lower by 2.0% to $332.9 million as volume (+3%) was offset by a decrease in pricing (-5%).

Click here to download our most recent Sure Analysis report on ALB (preview of page 1 of 3 shown below):


Dividend Aristocrat You’ve Never Heard Of: Nordson Corporation (NDSN)

Nordson was founded in 1954 in Amherst, Ohio by brothers Eric and Evan Nord, but the company can trace its roots back to 1909 with the U.S. Automatic Company.

Today the company has operations in over 35 countries and engineers, manufactures, and markets products used for dispensing adhesives, coatings, sealants, biomaterials, plastics, and other materials, with applications ranging from diapers and straws to cell phones and aerospace.

Source: Investor Presentation

On August 14th, 2024, Nordson increased its dividend by 15% to $0.78 per share quarterly, marking 61 years of increases.

On December 11th, 2024, Nordson reported fourth quarter results for the period ending October 31st, 2024. For the quarter, the company reported sales of $744 million, 4% higher compared to $719 million in Q4 2023, which was driven by a positive acquisition impact, and offset by organic decrease of 3%.

Industrial Precision saw sales decrease by 3%, while the Medical and Fluid Solutions and Advanced Technology Solutions segments had sales increases of 19% and 5%, respectively. The company generated adjusted earnings per share of $2.78, a 3% increase compared to the same prior-year quarter.

Click here to download our most recent Sure Analysis report on NDSN (preview of page 1 of 3 shown below):

Dividend Aristocrat You’ve Never Heard Of: Expeditors International of Washington (EXPD)

Expeditors is a global logistics company headquartered in Seattle, Washington. The company was founded in 1979 as a single-office ocean forwarder in Seattle.

Its services include the consolidation or forwarding of air and ocean freight, customs brokerage, vendor consolidation, cargo insurance, time definite transportation services, order management, warehousing and distribution, and customized logistics solutions.

Currently, the company has over 250 locations and ~17,500 employees worldwide. In 2023, the company reported $17.1 billion in revenue. The company has increased its dividend for 29 consecutive years.

On November 5th, 2024, EXPD reported third-quarter results for Fiscal Year (FY)2024. The company reported strong third-quarter 2024 results, with earnings per share (EPS) rising 41% to $1.63, and net earnings increasing 34% to $230 million compared to Q3 2023.

Operating income grew 40% to $302 million, supported by a 37% revenue increase to $3 billion. The company achieved significant growth in airfreight tonnage (+19%) and ocean container volumes (+12%), driven by proactive freight handling amid geopolitical disruptions and holiday shipping preparation.

Click here to download our most recent Sure Analysis report on EXPD (preview of page 1 of 3 shown below):

Additional Reading

The Dividend Aristocrats are among the best dividend growth stocks to buy and hold for the long run. But the Dividend Aristocrats list is not the only way to quickly screen for stocks that regularly pay rising dividends.

We have compiled a reading list for additional dividend growth stock investing ideas:

Thanks for reading this article. Please send any feedback, corrections, or questions to [email protected].


Source link

The S&P is About to Breakout…or Break Down


A technical look at the S&P … the crypto pain-train rolls on … at least the 10-year Treasury yield is down … tomorrow’s big event with Keith Kaplan of TradeSmith

The S&P is about to make an exaggerated move.

Early clues suggest the direction will be “up,” but “down” is very much in play.

If the move is higher, we’re likely in for a rebound that our hypergrowth expert Luke Lango plans on buying. It could be a 3%+ surge back to all-time highs and beyond.

But if the move is lower, the S&P could fall another 3% to 5% by mid-March.

Behind this binary is the S&P’s 100-day moving average, an important technical support level

Yesterday, the S&P fell to this level, bounced slightly, and it’s sitting barely above it as I write Wednesday mid-morning.

For newer Digest readers, a moving average (MA) is a line on a price chart that shows the average price of an asset over some stated period. Moving averages provide investors and traders helpful perspective on market momentum.

These MA lines are important because they often trigger “buy” and “sell” decisions from the quantitative trading algorithms that drive so many professional portfolios these days.

So, if the S&P begins breaking either “up” or “down” from a key MA – like the 100-day MA – those quant programs are likely to amplify the move as they join in the buying or selling.

As I’ll show you below, the S&P has just bounced off its 100-day MA (the purple line) and is trying to retake its 50-day MA (in red).

(The 200-day MA is in blue. More on that shortly.)

Chart showing the S&P has just bounced off its 100-day MA (the purple line) and is trying to retake its 50-day MA (in red).

Source: TradingView

If we pull back to get a longer timeline, you’ll see that the 100-day MA has been the strongest support “backbone” of the S&P’s climb since late 2023.

With one exception, each time the S&P has fallen to this level, the 100-day MA has served as a springboard, bouncing it higher.

Chart showing the 100-day MA has been the strongest support “backbone” of the S&P’s climb since late 2023.

Source: TradingView

Beginning with the potential for a continuation of this bounce-and-rally, let’s jump to Luke. From his Innovation Investor Daily Notes earlier this week:

Since late 2023, the S&P 500’s big technical support line has been the 100-day moving average (MA).

In that time – about 15 months – the S&P 500 has only lost its 100-day once (August 2024), and when it did, the market briefly fell below that level, only to rebound sharply within days.

That means the 100-day moving average has essentially been the “bottom” for the stock market in all of its selloffs since late 2023. And that MA is just below where we trade today…

If we [hold here] and bounce… that would be a very bullish technical signal.

That’s why, [Monday] morning, I told my team to get their Buy Lists ready.

If the S&P’s bounce fizzles and it slips below the 100-day MA, it’s likely to fall roughly 3% or 5%

Falling 3% represents a pullback to 5,800 – about halfway between the S&P’s 100- and 200-day MAs. It’s also where the S&P found support in January.

If we look at the last time the S&P lost its 100-day MA (which Luke referenced), it reversed north about halfway between these two MAs at the big, round number of 5,200.

Such big, round numbers carry extra weight with traders. That’s why I’ve flagged a similar big, round number (5,800) that’s also about halfway between these MAs.

A drop of 5% would take the S&P all the way to its 200-day MA. This hasn’t happened since October of 2023.

What clues might give us a heads-up about upcoming direction?

The S&P’s Relative Strength Index (RSI) and Moving Average Convergence/Divergence Indicator (MACD) are both trading at levels from which rebounds have occurred over the last year.

The RSI has already U-turned and is headed higher. The MACD (which moves slower) hasn’t turned north yet but is inflecting, something called “bullish convergence.”

Chart showing the S&P’s Relative Strength Index (RSI) and Moving Average Convergence/Divergence Indicator (MACD) are both trading at levels from which rebounds have occurred over the last year.

Source: TradingView

Put it altogether and we’re giving the edge to a continuation of this bounce…yet it comes with an enormous asterisk (read on for what that is) …

In the meantime, get your buy list ready…and your stop-losses identified.

Speaking of buying versus following your stop-losses…

Bitcoin and altcoins are dropping fast.

This means one of two things:

  • If you’re a short-term trader who bought a couple months ago, check your stop losses and protect your capital.
  • If you’re a long-term believer who’s been adding to your position over time, get some dry powder ready to deploy.

As I write, Bitcoin trades beneath $88,000. Yesterday, it notched a three-month low.

Behind the decline are two primary contributors:

  • A broad “risk off” sentiment, which has gripped Wall Street recently, has disproportionately affected Bitcoin (the poster child for risk).
  • A lack of short-term catalysts to get crypto investors bullish.

On that second note, here’s CNBC:

Bitcoin kicked off the year in rally mode, fueled by optimism about the positive changes the new Trump administration was expected to make for the crypto industry.

However, since the President issued his widely anticipated executive order on crypto at the end of January – the contents of which were well received by the industry despite its tamer than hoped for language on a strategic bitcoin reserve – the market has had little to look forward to.

Below, we look at Bitcoin’s chart, including its RSI and MACD indicators referenced above

Bitcoin’s RSI level (circled in red) is 28. This is officially “oversold” territory, as well as its lowest level since August.

Similarly, Bitcoin’s MACD (also circled in red) is deeply negative, signifying oversold conditions. It too is trading at its lowest level since last summer.

Chart showing Bitcoin’s RSI level (circled in red) is 28. This is officially “oversold” territory, as well as its lowest level since August. Similarly, Bitcoin’s MACD (also circled in red) is deeply negative, signifying oversold conditions. It too is trading at its lowest level since last summer.

Source: TradingView

The silver lining is that these depressed levels heighten the odds of a mean reversion rally.

That said, you never want to try to catch a falling knife. So, if you’re looking to add to your Bitcoin position, the safer move would be to wait until there’s more obvious strength in these technical charts.

After all, the bottom could be closer to $70,000 – $75,000.

We’ll continue monitoring and will report back.

The falling 10-year Treasury yield is good news

As regular Digest readers know, the 10-year Treasury yield is single most important number in the global financial market. The higher it climbs, the more pressure it puts on most stock prices (and Bitcoin’s price) because a higher yield means a higher discount rate, which lowers the current valuation of a stock.

This week, as scared investors rotated out of stocks into bonds, all that buying pressure pushed prices higher…which drove yields lower.

Yesterday, the 10-year Treasury yield touched 4.28%, its lowest level since December. It’s only slightly higher at 4.30% as I write. And if legendary investor Louis Navellier is right, it will be heading even lower when the Fed cuts rates more than expected later this year.

From Louis’ Growth Investor Flash Alert podcast:

The 10-year Treasury yield is down under 4.3%, so that’s very bullish.

So, now everybody’s expecting at least two Fed rate cuts. You’re going to have four this year, folks, because things are so bad in Europe that the central banks there are going to be cutting at least four to five more times, in addition to the rate cuts they’ve already had this year.

In past podcasts, Louis has clarified that global central banks often move in parallel fashion. So, Louis believes outsized cuts from the ECB is likely to put pressure on the Fed to make similar cuts.

Now, as you’ll see below, this is not what Wall Street currently predicts.

The CME Group’s FedWatch Tool puts the heaviest odds (33.2%) on just two quarter-point rate cuts by December.

Chart showing the CME Group’s FedWatch Tool puts the heaviest odds (33.2%) on just two quarter-point rate cuts by December.

Source: CME Group

So, four quarter-point cuts would certainly surprise Wall Street.

The question is “would that be a good or bad surprise?”

After all, while one interpretation is bullish…

“Four quarter-point rate-cuts? Wow, this will juice the economy and take pressure off stock valuations! Time to buy stocks.”

But a second interpretation is bearish…

“Four quarter-point rate-cuts? Wow, how bad is the economy that the Fed is slashing rates 100 basis points despite the lingering threat of reinflation? Time to sell stocks.”

We’ll be watching.

Returning to that asterisk from above…

How did Nvidia earnings come in?

Depending on when you read this, Nvidia may have already reported earnings after the closing bell.

Did they beat? Is guidance bullish?

If so, coming full circle to the top of today’s Digest, we’re likely in for a continuation of the bounce off the 100-day MA tomorrow.

But if earnings disappoint, we’re likely losing the 100-day MA.

Now, even if Nvidia stumbles and the market falls in the morning, Keith Kaplan, the CEO of our corporate partner, TradeSmith, believes a melt-up is coming over the next 12 months. And that would mean a pullback tomorrow could present some fantastic buying opportunities.

From Keith:

The markets today are frothy, to be sure, but our indicators are still very much bullish.

So, I’m staying fully invested, but I’m much more regimented than I’ve ever been when it comes to investing.

As we’ve been covering here in the Digest over the last week, tomorrow evening at 8 PM Eastern, Keith is holding a live event called The Last Meltup.

He’ll be explaining why he sees stocks moving higher over the coming months, as well as a suite of investment tools we’ve profiled this week that have helped Keith be “much more regimented,” as he just noted.

As to the possibility of a melt-up, TradeSmith uses algorithms to spot repeating patterns in decades worth of stock market data. And today, it’s flagging a rare pattern that hasn’t been seen in 30 years.

It’s only been seen twice before going back to 1900 – in 1966 and 1925. And it signals a type of melt-up that creates hyper-exaggerated gains (though brutal losses when the fireworks are over).

The last time this happened, you could have made 9,731% from a leading software company… 28,894% from a robotic visionary… 70,626% from an internet services company… and 91,863% from a consumer electronics stock.

But on the other side of those gains was a market freefall that you wanted to avoid.

Keith will cover all this tomorrow, illustrating how to benefit from the ride up while sidestepping the worst of the elevator shaft down.

We’ll keep you updated on all these stories here in the Digest.

Have a good evening,

Jeff Remsburg


Source link