Archives May 2025

The New I Bond Rate Is Out. And It’s Great News.


Key Takeaways

  • The U.S. Treasury announced today that I bonds purchased between May and October this year will earn 3.98% for their first six months—a big boost vs. the previous rate of 3.11%.
  • If you already own I bonds, you also get good news: your next six-month rate will be rising almost a full percentage point.
  • Today’s rate announcement takes into account inflation rates through March. If inflation rises in the coming months due to tariff impacts, the next I bond rate could be even higher.
  • See our tables below to find out how much your particular bond will pay, including when your new higher rate will kick in.

The full article continues below these offers from our partners.

Today’s Rate for New I Bond Purchases

I bond rates change twice a year based on the inflation trend of the previous six months—which is why they’re called I bonds. But the rate is actually made up of two parts. One is fixed for the life of your I bond—assigned at the time of your purchase—while the other component is indexed to inflation and adjusts every May and November.

The U.S. Treasury today announced its May 1 rate, unveiling a slightly lower fixed-rate component than the previous period (1.10% vs. 1.20%), but a higher inflation component, coming in at 2.86% (vs. 1.90% six months ago). Combining the two results in a new composite rate of 3.98% for I bonds purchased any time in the six-month period from May 1 to Oct. 31 of this year. (The detailed calculation for the new composite rate is actually [fixed rate + (2 x semiannual inflation rate) + (fixed rate x semiannual inflation rate)].)

If you buy a new I bond by Oct. 31, you’ll earn 3.98% for your first half year of interest payments. After that, your return will depend on the Nov. 1 rate announcement, which in turn will be determined by future inflation rates. If inflation rises, so too will I bond rates, and vice versa. (See our discussion below about what might be coming for future inflation and I bond rates.)

New and Improved Rates for Existing I Bonds

No matter whether you buy new I bonds tomorrow or already hold I bonds, the same inflation component of 2.86% will be incorporated into your next six-month interest rate. But your return will vary based on when you bought your bond, as that’s when your permanent fixed-rate component is assigned to the bond. Remember: The fixed portion of your rate is just that—it never changes for the life of an individual bond.

At the Nov. 1 rate announcement, the inflation factor was 1.90%. That means today’s new six-month return, based on a rising inflation trend this past half year, will be almost a full percentage point higher than your previous rate (i.e., 2.86% inflation component today minus 1.90% inflation component in November).

To see what the new rate will be on existing I bonds going back to May 2020, look up the issue month of your bond and consult the table below. Then see the next table to find out when your new rate will kick in.

Newly Announced Rates for Recent I Bond Issues
I Bond Issue Date Fixed-Rate Component Assigned for Life of the Bond  New Inflation Component New Composite Rate* Previous 6-Month Rate
New purchases May–Oct 2025 1.10% 2.86% 3.98% N/A
Nov 2024–Apr 2025 1.20% 2.86% 4.08% 3.11%
May-Oct 2024 1.30% 2.86% 4.18% 3.21%
Nov 2023–Apr 2024 1.30% 2.86% 4.18% 3.21%
May–Oct 2023 0.90% 2.86% 3.77% 2.81%
Nov 2022–Apr 2023 0.40% 2.86% 3.27% 2.30%
May–Oct 2022 0.00% 2.86% 2.86% 1.90%
Nov 2021–Apr 2022 0.00% 2.86% 2.86% 1.90%
May–Oct 2021 0.00% 2.86% 2.86% 1.90%
Nov 2020–Apr 2021 0.00% 2.86% 2.86% 1.90%
May–Oct 2020 0.00% 2.86% 2.86% 1.90%

Figuring out when your new rate above will begin depends on the specific issue month of your existing bond. For instance, if you bought your I bond in May—of any year—you’ll start earning your new rate today, on May 1. But if you bought in, say, September, your current rate won’t change to today’s new rate until Sept. 1.

When I Bond Rates Will Change for Each Bond Issue Month
 I Bond Issue Month When Your Rate Will Change Each Year 
January July 1 and Jan. 1
February Aug. 1 and Feb. 1
March Sept. 1 and March 1
April Oct. 1 and April 1
May Nov. 1 and May 1
June Dec. 1 and June 1
July Jan. 1 and July 1
August Feb. 1 and Aug. 1
September March 1 and Sept. 1
October April 1 and Oct. 1
November May 1 and Nov. 1
December June 1 and Dec. 1

Why Future I Bond Rates Could Be Headed Higher

The U.S. Treasury’s calculation of the last six months’ inflation trend covered readings from October 2024 through March 2025. That means the last inflation figure included did not yet reflect impacts from President Trump’s dramatic tariff announcement on April 2, nor the impacts seen throughout last month as the on-again, off-again tariff policy has evolved.

Many economists expect the tariffs will push inflation rates higher. If that proves true and extends for several months, Treasury’s next six-month inflation calculation for I bonds could move up again in November. And that in turn would push rates even higher for both new and existing I bonds.

Daily Rankings of the Best CDs and Savings Accounts

We update these rankings every business day to give you the best deposit rates available:

How We Find the Best Savings Rates

Every business day, Investopedia tracks the rate data of more than 200 banks and credit unions that offer CDs and savings accounts to customers nationwide and determines daily rankings of the top-paying accounts. To qualify for our lists, the institution must be federally insured (FDIC for banks, NCUA for credit unions), and the account’s minimum initial deposit must not exceed $25,000. It also cannot specify a maximum deposit amount that’s below $5,000.

Banks must be available in at least 40 states to qualify as nationally available. And while some credit unions require you to donate to a specific charity or association to become a member if you don’t meet other eligibility criteria (e.g., you don’t live in a certain area or work in a certain kind of job), we exclude credit unions whose donation requirement is $40 or more. For more about how we choose the best rates, read our full methodology.


Source link

Royal Canadian Mint Earns Dual Honors at 2025 MDC


The Royal Canadian Mint is delighted to have twice earned global recognition for its coin manufacturing excellence and innovation by winning the Best Commemorative Silver Coin and the Best Collaboration coin awards of the 2025 Mint Directors Conference (MDC).

2024 $50 Fine Silver Coin - Year of the Dragon
2024 $50 Fine Silver Coin – Year of the Dragon

The Mint was first recognized for its 2024 $50 Pure Silver Coin – Year of the Dragon, a new technical achievement that enhances the relief of a stunning Wood Dragon design to an impressive height of 4.7 mm on the reverse and created a rear view of the dragon in an equally impressive obverse relief. As well, our partnership with the Department of Chemistry at Montreal’s McGill University, to develop a more environmentally responsible gold refining process, was recognized as the global minting industry’s best collaboration.

The 2025 MDC is host to the prestigious Coin Awards, recognizing industry achievements in the design, production, packaging, and distribution of commemorative and circulating coins worldwide.

“The Royal Canadian Mint is passionate about innovating to keep demonstrating the excellence and artistry of our world-famous coin products, as well as the sustainability of our processes,” said Marie Lemay, President and CEO of the Royal Canadian Mint. “To be recognized in two award categories by the Mint Directors Conference judges is a tremendous peer endorsement of our commitment to finding new ways to delight our customers while finding more caring and sustainable ways to continue leading the global minting community.”

Designed by Canadian artist Simon Ng, our award-winning pure silver coin celebrates the Year of the Wood Dragon through an elaborate Extraordinarily High Relief (EHR) engraving of a dragon, the fifth sign in the Chinese Zodiac. Framed by a laser-engraved pattern that represents the wood element, the dragon is shown moving among the clouds of a night sky illuminated by the moon, its tail coiled to form the shape of lucky number 8. A rear view of that same scene is rendered in EHR on the obverse. Above the obverse engraving appears the effigy of Queen Elizabeth II by Susanna Blunt, accompanied by a special device of four pearls symbolizing her four different effigies to have graced Canadian coins, as well as the double date of her reign.

The goal of the Mint’s work with McGill University is to transform gold refining by replacing the longstanding Miller Chlorination process, which relies on the injection of chlorine gas to separate impurities from molten gold. Our collaboration has, at a lab scale, resulted in a process that virtually eliminates chlorine gas by introducing an acoustic mechanochemical process to catalyze a chemical reaction with a mild reagent. The process, which yields pure gold in soluble form is non-toxic and less energy-intensive, and is safer for people and the environment.

This innovation builds on previous work done by the Mint in 2019 to reduce chlorine use in its gold refining operations. At that time, the Mint introduced acid-less separation (ALS) technology, that reduced the use of chlorine gas by more than 50% in the Ottawa refinery.

About the Royal Canadian Mint

The Royal Canadian Mint is the Crown corporation responsible for the minting and distribution of Canada’s circulation coins. The Mint is one of the largest and most versatile mints in the world, producing award-winning collector coins, market-leading bullion products, as well as Canada’s prestigious military and civilian honours. As an established London and COMEX Good Delivery refiner, the Mint also offers a full spectrum of best-in-class gold and silver refining services. As an organization that strives to take better care of the environment, to cultivate safe and inclusive workplaces and to make a positive impact on the communities where it operates, the Mint integrates environmental, social and governance practices in every aspect of its operations.


Source link

Watch These Bitcoin Price Levels as $100,000 Back in Sight


Key Takeaways

  • Bitcoin has surged to its highest point since February and is back within reach of the psychological $100,000 level.
  • In a win for the bulls, the pioneer cryptocurrency staged a breakout above a pennant pattern Thursday, setting the stage for a continuation move higher.
  • Investors should watch crucial overhead levels on bitcoin’s chart around $100,000 and $107,000, while also eyeing key support near $92,000 and $85,000.

Bitcoin (BTCUSD) has surged to its highest point in more than two months, putting it back within reach of the psychological $100,000 level. 

The digital asset rallied Thursday after reports surfaced that investment bank Morgan Stanley is looking into adding spot cryptocurrency trading to its E*Trade platform sometime next year. Sentiment also received a boost after Strategy (MSTR), the world’s largest corporate holder of bitcoin, said it plans to acquire more bitcoin through a $21 billion equity offering.

Bitcoin is up about 30% from its early-April low as investors have sought to diversify their portfolios amid uncertainty surrounding the Trump administration’s trade policies and their potential impact on the economy. Amid recent market turmoil, bitcoin and stocks have occasionally moved in opposite directions, evidence to some investors that the cryptocurrency is finally showing its worth as a safe haven.

The legacy cryptocurrency was at $97,000 recently, still below its record high of around $109,000 in January but up from last month’s low below $75,000.

Below, we take a closer look at bitcoin’s chart and apply technical analysis to identify crucial price levels worth watching out for.

Pennant Pattern Breakout

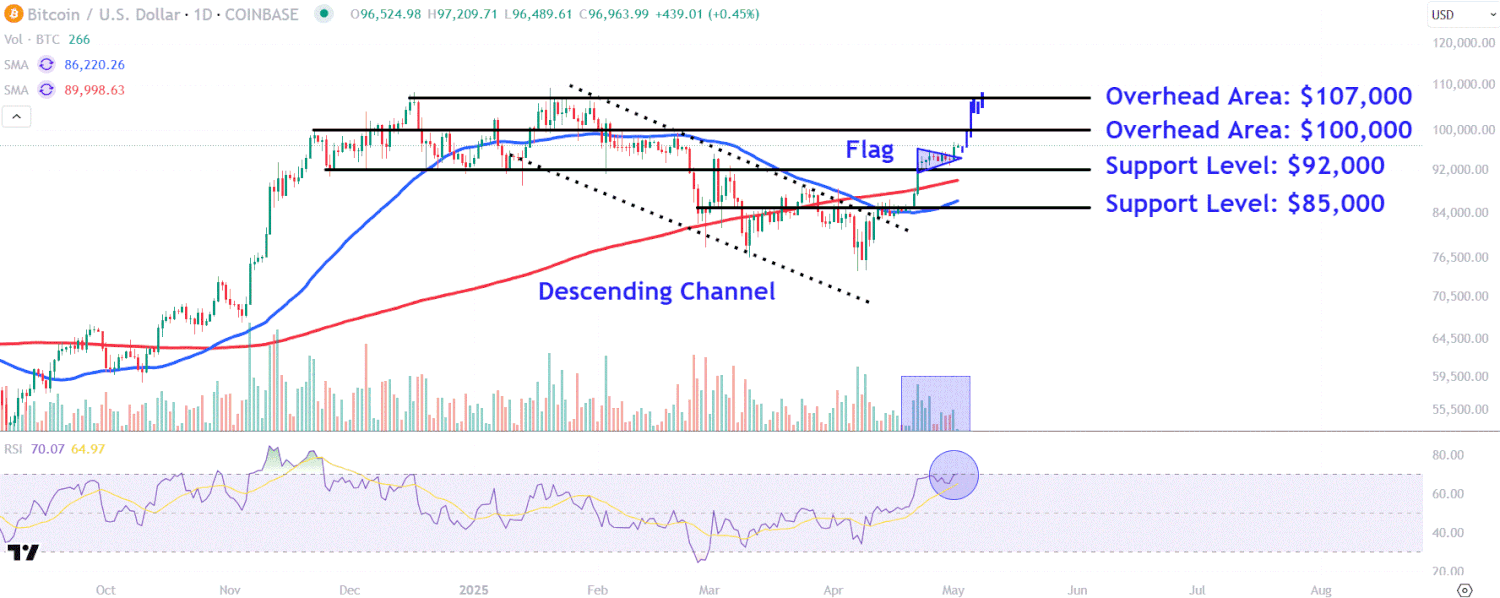
After breaking out from a a descending channel last month, bitcoin’s price rallied sharply before consolidating in a narrow pennant pattern.

In a win for the bulls, the pioneer cryptocurrency staged a breakout above the pennant’s top trendline Thursday, setting the stage for a continuation move higher. Moreover, the relative strength index confirms bullish price momentum, with the indicator edging toward overbought territory. 

However, it’s worth pointing out that trading volumes remain below average during bitcoin’s recent bullish price action, suggesting larger market participants may remain on the sidelines.

Let’s identify two crucial overhead areas on bitcoin’s chart that investors may be watching and also locate key support levels worth eyeing during future pullbacks.

Crucial Overhead Areas to Watch

The first overhead area to watch sits at $100,000. This crucial location would likely provide resistance near the round number and a horizontal line that links a range of trading activity on the chart between November and February.

A more bullish move could see bitcoin’s price test overhead resistance around $107,000. Investors who have accumulated the cryptocurrency at lower prices may decide to lock in profits at this level near the prominent December and January swing highs. This region also roughly aligns with a projected bars pattern upside target that takes the impulsive move higher that preceded the pennant and repositions it from the pattern’s breakout point.

Key Support Levels Worth Eyeing

During pullbacks, investors should initially eye the $92,000 level. Retracements to this area may attract buying interest near the low of the pennant pattern, which also aligns with several peaks and troughs on the chart stretching back to last November.

Finally, a breakdown below this key technical level opens the door for a drop to $85,000. Investors may seek entry points in this area near the February low and a period of sideways drift on the chart prior from bitcoin’s breakout from the descending channel last month.

The comments, opinions, and analyses expressed on Investopedia are for informational purposes only. Read our warranty and liability disclaimer for more info.

As of the date this article was written, the author does not own any of the above securities.


Source link

Apple Delivers Better-Than-Expected iPhone Sales, Announces $100B Buyback


Apple (AAPL) reported fiscal second-quarter revenue and earnings that surpassed analysts’ expectations, with higher-than-expected iPhone sales.

The iPhone maker reported revenue of $95.4 billion, up 5% year-over-year and above the analyst consensus from Visible Alpha. Net income of $24.78 billion, or $1.65 per share, compared to $23.64 billion, or $1.53 per share, a year earlier, topping Wall Street’s estimates. 

The gains came as Apple’s iPhone sales climbed 2% to $46.84 billion, ahead of projections, while Mac sales rose 7% to $7.95 billion, and iPad sales jumped 15% to $6.4 billion. The company’s services revenue improved 12% to $26.65, just under expectations of $26.71 billion.

Apple also said its board authorized a $100 billion share repurchase program and increased its dividend by 4% to 26 cents per share.

However, shares slipped in extended trading Thursday as CEO Tim Cook told investors during the company’s earnings call that tariffs, if kept at their current levels, would increase Apple’s costs by about $900 million in the current quarter running through June. Cook said he expects Apple’s total revenue to grow by low- to mid-single digits in the current quarter, compared to Street projections of about 4%.

Cook warned the impact of tariffs could change, given the company is “uncertain of potential future actions.” The majority of iPhones sold in the U.S. this quarter will come from India rather than China, Cook said, with iPad, Mac, Apple Watch, and other products coming mostly from Vietnam. 

The results come as several analysts have warned the company could be particularly hurt by trade tensions with China, where Apple until recently manufactured an estimated 90% of its products. President Donald Trump has said he expects tariffs on China “will come down substantially” but not drop to zero. To help mitigate some risk, Apple is reportedly planning to move the assembly of all iPhones it sells in the U.S. to India by the end of 2026. 

Apple shares slid about 4% in after-hours trading. The stock was down 15% for 2025 through Thursday’s close.

This article has been updated since it was first published to include additional information and reflect more recent share price values.


Source link

Amazon’s Earnings Top Expectations, But Soft Outlook Disappoints


Amazon (AMZN) reported first-quarter earnings that topped analysts’ expectations, but its outlook disappointed. 

The e-commerce and cloud services giant reported quarterly revenue of $155.7 billion, up 9% year-over-year and above the analyst consensus from Visible Alpha. Net income of $17.1 billion, or $1.59 per share, compared to $10.4 billion, or 98 cents per share, a year earlier, topping Wall Street’s estimates.

“To some extent, we’ve seen some heightened buying in certain categories that may indicate stocking up in advance of any potential tariff impact,” CEO Andy Jassy said.

Online store sales grew 6% to $57.41 billion, beating estimates, while revenue from Amazon Web Services increased 17% to $29.27 billion, slightly below projections of $29.38 billion.

Looking ahead, Amazon forecast second-quarter revenue of $159 billion to $164 billion, roughly in line at the midpoint with the $161.27 billion called for by Wall Street. However, Amazon’s projected operating income of $13 billion to $17.5 billion was largely below the analyst consensus.

CFO Brian Olsavsky said the company issued a wider outlook than it would have otherwise, amid uncertainty about consumer demand in the face of President Trump’s shifting tariff policies.

“It’s hard to tell what’s going to happen with tariffs right now,” Jassy said, adding “there’s maybe never been a more important time in recent memory than trying to keep prices low, which we’re heads down pretty maniacally focused on.”

The CEO said Amazon has taken several steps to keep prices low, including forward buys of inventory, and diversifying its supply chain.

Amazon shares fell about 3% in after-hours trading. The stock was down 13% for 2025 through Thursday’s close.

This article has been updated since it was first published to include additional information and reflect more recent share price values.


Source link

Two Ways to Prepare for the Great Retail Squeeze – Before May 7 Hits 


Expect a “W-shaped” recovery as markets begin to face “unsustainable” Chinese tariffs…

Tom Yeung here with today’s Smart Money

In February 2020, photos began circulating of deserted locations in China.  

Empty subway stations… 

Desolate malls… 

There was not a soul to be seen in downtown Beijing, Hong Kong, or Shanghai, as the picture below shows. 

Source

A month later, American pandemic lockdowns began. 

Today, similar images of desolation are coming toward our shores. But instead of empty subway stations and malls, it’s store shelves that will be barren…

Source

That’s because America is quietly running out of Chinese goods. 

On Wednesday, the National Bureau of Statistics revealed that Chinese export orders for April had plunged to their lowest level since the Covid-19 pandemic.  

Container ship arrivals to the Port of Los Angeles are scheduled to decrease 36% later this month. And retailers will eventually burn through the pre-tariff stockpiles they’ve hoarded. 

So, in today’s Smart Money, let’s take a look at what the continued trade war with China means for us as consumers… and, importantly, as investors.  

I’ll also share the date that could spark massive market panic. It’s a lot sooner than you might think. 

The Trade War’s Impact 

Over the next several months, retailers will run out of cheaply imported inventory. Products we take for granted will disappear, and many unexpected items will suddenly become far harder to find.  

The first to vanish will be toys and seasonal kids’ goods, given their relatively quick turnover and reliance on Chinese manufacturers. We could see this impact as soon as next month. 

The next will be fast fashion and low-cost home goods. Then, apparel… footwear… electronic components… household appliances… and so on. Each new month will bring another knife twist to American supply chains, simply because no other country (not even the U.S.) can replace the manufacturing capacity of China on such short notice. 

Of course, I’m only talking hypothetically.  

That’s because President Donald Trump still seems to care about public opinion and stock prices. He backed off full “Liberation Day” tariffs after a major Wall Street selloff, and will almost certainly lighten up on Chinese tariffs once retail panic begins. After all, the president did not win the race to the White House by promising empty store shelves. 

However, that still means a retail panic must first happen.  

Over the past decade, we’ve gotten a good look at how our president operates. He loves to make grand deals. He loves to negotiate. And he loves to look strong to his constituents. 

And that’s worrying because Trump is clashing swords with a leader who also wants to appear strong to his own people. 

That means it’s extremely unlikely we’ll see a sudden “grand deal” with China to bring all tariffs to the 25% to 30% range – the sweet spot where taxes are high enough to incentivize re-shoring, and low enough to keep trade moving. Neither side wants to look weak. 

Instead, the next several months will likely see a second dip before both sides come to the table. Even then, we may only see a hodgepodge of tariff cuts, leaving importers without the confidence to make big orders or rebuild supply chains outside China. That will eventually lead to low inventories, less consumption, and a “W-shaped” recovery. 

So, how should investors prepare for an upcoming “everything shortage”? 

Two Steps to Arm for a Trade War 

First, you must check your portfolio for China-dependent companies and reduce exposure where you can. For instance, with… 

  • Retailers. Firms like Amazon.com Inc. (AMZN) and Target Corp. (TGT) import anywhere from 30% to 70% of their total inventory from China. Raising prices to offset tariffs could prove ruinous for their reputations, so they have no choice but to eat the costs and accept lower (or negative) profits. 
  • Apparel. Many clothing sellers have surprisingly concentrated supply chains. UGG owner Decker Outdoors Corp. (DECK), for example, sources its entire sheepskin inventory from two Chinese tanneries. 

The next step will be to protect yourself from the second dip of a “W-shaped” recovery. President Trump will likely delay reducing tariffs until something goes wrong, so we’ll probably see a pullback as retail panic sets in.  

That means cutting back on the riskiest of risky bets like short-dated call options… zero-profit startups… even major cryptocurrencies. 

But after that, you need to prepare for a recovery through buying the high-quality winners we’ve long talked about in this newsletter.  

And the good news is the second leg of the “W-shaped” recovery could happen as soon as next Wednesday, May 7. According to my InvestorPlace colleague Luke Lango, a big event that day could trigger a flood of cash – roughly $7 trillion – to rush back into U.S. stocks. This catalyst could change the entire market and create a summer “panic” like we’ve not seen since 1997. 

This is why he is holding a special 2025 Summer Panic Summit tonight at 7 p.m. Eastern. At this event, Luke will explain why he believes this catalyst on May 7 will be a game-changer. Plus, he’ll share a new set of stocks that he believes are primed to lead the next wave of growth.  

The event starts in just a few hours, so click here now to reserve your spot for the 2025 Summer Panic Summit before it begins. You won’t want to miss what Luke has to say.  

Until next week,  

Tom Yeung  

Markets Analyst, InvestorPlace 


Source link

Japanese yen slides after BoJ; US jobs loom – United States


Written by Steven Dooley, Head of Market Insights, and Shier Lee Lim, Lead FX and Macro Strategist

USD gains for third-straight session

The greenback was strongly higher for the third session in a row as the US dollar continued to extend a rebound from three-year lows.

The US dollar gained despite a run of poor economic data with Wednesday seeing an unexpected drop in March-quarter GDP while Thursday saw a jump in weekly unemployment claims, up from 223k last week to 241k this week.

The AUD/USD fell 0.3% as the pair continues to find key resistance above 0.6400. Australia goes to the polls in the national election on the weekend.

The NZD/USD was down 0.5% with this pair now down 2.1% from recent highs.

In Asia, the USD/SGD surged higher ahead of the Singapore election with the USD/SGD up 0.5%.

The USD/CNH gained 0.1%.

Chart showing USD/SGD support seen at 1.300

JPY lower as BoJ holds

The US dollar’s move in Asia was mostly driven by yesterday’s Bank of Japan decision.

The US dollar was higher while the Japanese yen fell sharply after the BOJ decided to keep interest rates on hold at 0.50%.

The JPY’s weakness was clearly seen in the AUD/JPY pair with the Aussie jumping to a one-month high versus the Japanese yen.

The Singapore dollar also hit one-month highs versus the Japanese yen.

Chart showing IS government bond yields and the USD/JPY exchange rate

US jobs in focus

The highlight tonight will be the US jobs report, due at 10.30pm AEST, with markets looking closely for any signs of cracks in the US labour market.

According to Bloomberg, the market is looking for a lower, 138k result after last month’s higher than expected 228k.

The unemployment rate is forecast to stay steady at 4.2%.

However, shifts in the labour market are historically slow to take effect. As a result, a surprisingly positive result could see the USD extend recent gains tonight.

Chart showing monthly change in Non-Farm Payrolls (NFP) millions

USD gains ahead of jobs

Table: seven-day rolling currency trends and trading ranges  

Table: seven-day rolling currency trends and trading ranges

Key global risk events

Calendar: 29 April – 3 May

Key global risk events calendar: 29 April – 3 May

Have a question? [email protected]

*The FX rates published are provided by Convera’s Market Insights team for research purposes only. The rates have a unique source and may not align to any live exchange rates quoted on other sites. They are not an indication of actual buy/sell rates, or a financial offer.

Convera live - Register now


Source link

Tariffs To Take a Bite Out of Apple’s Results


Apple (AAPL) CEO Tim Cook said the Trump administration’s tariffs, if they remain at their current levels, will cost Apple about $900 million in the current quarter that runs through June. 

During the company’s quarterly earnings call Thursday, Cook said a majority of iPhones sold in the U.S. this quarter will come from India, rather than China, with iPad, Mac, Apple Watch, and other products coming mostly from Vietnam.

The comments come amid concerns the company could be particularly hurt by trade tensions with China, where Apple manufactured an estimated 90% of its products until recently. Most Apple products are exempt from President Trump’s 125% “reciprocal” tariffs on Chinese goods, but still affected by the 20% import tax the White House put in place earlier in the year to combat fentanyl trafficking, Cook noted.

Cook also warned the impact of tariffs to Apple’s results could change, given the company is “uncertain of potential future actions” the administration could take. Trump has said he expects tariffs on China “will come down substantially” in trade negotiations but not drop to zero. 

Apple reported fiscal second-quarter revenue and earnings that surpassed analysts’ expectations, with higher-than-expected iPhone sales.

Shares of Apple fell about 4% in extended trading. The stock was down 15% for 2025 through Thursday’s close.


Source link

Robotics Will Be a $5 Trillion Market – Get Invested


Last call for tonight’s robotics event with Luke Lango … agentic AI is already arriving … did Beijing just crack the door open to talks? … perspective on volatility

In recent Digests, I’ve been highlighting tonight’s humanoids/robotics investment event with our technology expert, Luke Lango.

If you’re still unsure about the scope of this opportunity, here’s the title of one of CNBC’s stories on Tuesday:

“Morgan Stanley says humanoid robots will be a $5 trillion market by 2050. How to play it”

The numbers in the article are eye-opening. From CNBC:

Wall Street continues to double down on its forecasts of a multi-trillion dollar global market for humanoid robots, suggesting it will grow to be significantly larger than the global auto industry by the next couple of decades.

New estimates from Morgan Stanley analysts forecast $4.7 trillion in global humanoid revenue by 2050, which the firm said is double the total revenue of the 20 largest automakers in 2024…

Analysts estimate that global humanoid adoption will accelerate and reach roughly 1 billion units by 2050, the investment bank said.

Elon Musk, Tesla’s CEO, shares this same perspective. Last year, he predicted that Tesla’s humanoid Optimus will “overwhelmingly be the value of [Tesla].”

Here’s more of what he said about humanoids on Tesla’s Q2 2024 earnings call:

  • Long-term, Optimus has the potential to generate $10 trillion in revenue
  • It won’t be many years before Tesla is making 100 million robots a year
  • Musk sees a path for Tesla to be the most valuable company in the world, possibly bigger than the next five companies combined, overwhelmingly due to autonomous vehicles and autonomous humanoid robots.

To add context to Morgan Stanley’s $4.7 trillion market size prediction, in 2024, the market cap of the entire global pharmaceuticals industry was roughly $1.7 trillion.

Humanoids are going to dwarf that.

And how about global defense/military spending? According to CNN, that clocks in at $2.7 trillion.

So, these next-gen robots will nearly double that.

***What we’re seeing right now with robotics/humanoids has shades of the earliest days of the internet boom

And though this technology will take years to reach full bloom, the early investment gains have already begun. Luke believes they’re about to accelerate:

If history is any guide, the next 24 months could be even bigger than the last 24 — just as 1998 and 1999 outshone 1995 and 1996 during the Dot-Com Boom.

In fact, my team and I have been tracking the price action of stocks in the AI Boom that started in 2023, relative to the price action of stocks in the Dot-Com Boom, from 1995 to the peak in 1999.

The price trajectories match almost perfectly.

We haven’t seen a setup like this in nearly 30 years, when internet leaders saw gains of 800%, 2,800%, and even 3,000%…

Luke isn’t pulling those numbers from thin air. He’s referring to the gains seen by Cisco, Viavi Solutions, and Qualcomm between 1997 and 1999 (though there are abundant other examples he could have used).

Circling back to tonight, get ready to cover lots of ground: the historical parallels to the 90s… why the AI boom is far from over… why humanoids/robotics are critical for investor portfolios in the years ahead… why May 7th could mark a mad dash back into the market that Luke wants to front-run… and details about a group of seven small-cap stocks that are poised to benefit from the humanoid boom.

It’s not too late to join. By clicking here, you’ll be instantly registered to attend, and we’ll see you at 7 PM Eastern.

***Ready for AI to do your shopping?

On Tuesday, Bloomberg reported that Mastercard is working with Microsoft so that AI agents can shop for consumers online, even make payments for them.

Here’s Bloomberg:

Under the new program, a shopper could prompt an AI agent — Microsoft’s Copilot, for example — to search for a pair of yellow running shoes in a particular size.

The agent would then search and offer the customer options, and then be able to make the purchase while also recommending the best way to pay.

The AI agent won’t have complete autonomy to buy without the consumer’s input. But it’ll basically tee everything up and await that final green light.

But agentic AI isn’t only on the cusp of transforming shopping.

Here’s The Wall Street Journal from February, discussing AI agents and healthcare:

Grace, Max and Tom…are artificial-intelligence agents: bots that execute tasks end to end.

Already, AI agents can automate the ordering of groceries and filing of expense reports, and now venture-backed companies are designing them for healthcare tasks such as enrolling participants in clinical trials, ensuring proper care after hospitalization and helping doctors quickly learn medical histories when seeing patients for the first time.

And how about AI agent “tutors” that help your child with those pesky math problems?

Here’s PurelyStartup.com:

47% of students fail to grasp algebraic concepts in their first attempt. That statistic isn’t just a number—it represents millions of frustrated students, overwhelmed teachers, and countless lost learning opportunities. 

Some schools are already embracing AI teaching assistants to tackle this challenge…in what’s becoming education’s most transformative shift.

These AI agents for education don’t just explain concepts differently—they adapt to each student’s learning style, provide instant feedback, and offer unlimited patience. 

There are plenty more examples of AI agents impacting different corners of our economy, but you get the idea.

The bottom line is that this technology is racing toward us right now. And these cutting-edge bots are the frontrunners of the full-blown humanoids that aren’t too far behind.

Consider the scope of how this will change your life – and the world around you.

From an investment perspective, we’re effectively at Day 1.

Circling back to Luke and how he recommends investors position themselves, here’s your last reminder to join him tonight (here’s that one-click instant sign-up link again).

***The trade war is already bruising China – but is Beijing softening?

Switching gears, yesterday, we learned that China’s manufacturing activity has nosedived in the wake of the trade war.

China’s Purchasing Managers’ Index fell to 49 (a reading below 50 signals a contraction). And new export orders fell to their lowest since December 2022.

Will it result in trade war concessions?

Here’s The Wall Street Journal:

[The weak data] adds to pressure on Chinese leader Xi Jinping to reach a deal on trade with Trump—though for now the clear message from Beijing is one of resolute defiance in the teeth of what it describes as U.S. bullying.

Earlier this week, we dove into Beijing’s “defiance,” highlighting how Chinese culture places a major emphasis on “saving face.” We saw an example a few days ago when the Chinese Ministry of Foreign Affairs posted a video to social media saying, “China won’t kneel down.”

But are we seeing green shoots?

Yesterday, Chinese state media said there would be “no harm” in having trade talks with the White House. This hints at a softening of Beijing’s position.

In a social media post, Yuyuan Tantian, which is an account affiliated with state media, said:

If the US wishes to engage with China, there’s no harm in it for China at this stage…

If it is talks, the door is wide open. If it is a fight, we’ll see it through to the end.

Seems like an effective tightrope walk of “saving face” while also signaling a willingness to find a deal.

We’re encouraged, but let’s be cautious about reading too much into it. On that note, here’s the WSJ again:

Xi has signaled that Beijing is prepared for a long battle over trade…

[And though various exemptions have been made on both sides] substantive talks on trade between Washington and Beijing don’t appear to be happening.

***Important perspective on recent volatility

As I write Thursday, the market is soaring (mostly the Nasdaq) due to strong earnings from Microsoft and Meta.

But given the volatility we’ve seen over the last two months, tomorrow could bring a “down” day that erases all these gains and more.

So, let’s end today by contextualizing this volatility.

First, a disclaimer: We each have a unique investment path. We come to today’s market with different ages, investment goals, incomes, net worths, investment timeframes, and so on. So, please do only what’s best for you and your specific investment situation.

But if you have a handful of years left for your stock portfolio to develop, Thomas Yeung offers important perspective.

For newer Digest readers, Thomas is Eric Fry’s lead analyst. In his Investment Report Weekly Update from Tuesday, Thomas began by explaining why we aren’t out of the woods with the trade war, and the potential for empty shelves in the coming months.

But it’s how Thomas ended his update that’s important for long-term investors to remember (equally so for investors who are buying into humanoids/robotics today).

I’ll let him take us out today:

Four years from now, no one will be thinking about tariffs.

Instead, we’ll be talking about artificial intelligence, robotics, and perhaps even how the chaotic rollout of import taxes were good for forcing firms to re-onshore production. 

So, don’t let [a stuttering, uneven] recovery shake you from the market.

Have a good evening,

Jeff Remsburg


Source link

M&A Booms Globally, But Tariffs Freeze US Deals


While cross-border dealmaking accelerates in Asia, Europe, and the Middle East, US M&A faces mounting headwinds from tariffs, recession fears, and regulatory pushback.

M&A activity got off to a strong start in 2025, with global deal value surpassing $1.2 trillion through April, according to Dealogic. However, more is being spent on less, considering the number of transactions is at a two-decade low. Only 6,955 deals were announced in the first quarter; that’s down 16% from the fourth quarter of 2024.

Mounting recession fears, renewed trade tensions, and shifting political winds are weighing heavily on corporate dealmakers and private equity firms—particularly in the US, where valuations remain flat.

“Deals got done in Q1 but it has been slow and will probably get slower as the year progresses. I have been asking for updated 2025 projections but there is uncertainty in the markets and how the tariffs will play out, and a hesitation to provide those 2025 projections,” says David Acharya, managing partner at Acharya Capital Partners. “I have been hearing similar comments from my peers—senior investment partners with investment committee responsibilities.”

Consider the numbers. As of May 1, Dealogic shows US M&A value is at $575.6 billion. That’s down 1% compared to this time last year. Other regions are on the opposite trajectory: Japan, $42 billion (up 133%); Asia, $251.4 billion (73%); Canada, $52.4 billion (54%); Middle East/Africa, $31.4 billion (51%); and Europe, $257.8 billion (7%).

For the numbers to be where they are, investment banks don’t have many mega deals to boast about. In March, Google’s parent company, Alphabet, purchased cybersecurity startup Wiz for about $32 billion. There was also the $16.4 billion agreement between Constellation and Calpine Corp., as well as the $22.8-billion investment from China’s Ministry of Finance into four state-owned banks. In Europe, Austria’s OMV cut a deal with Abu Dhabi National Oil Co. to merge their respective polyolefins businesses; the combined entity proceeded to buy NOVA Chemicals Corp for $13.4 billion.

Technology, finance, health care, utilities, and oil and gas remain the most vibrant sectors across the globe. Technology and finance both exceeded last year’s three-month period in terms of dollars spent.

“In the US, M&A volume has decreased on a year-on-year basis, while most other markets in Asia and Europe have gone up,” Takashi Toyokawa of Ignosi Partners, says. “I’d expect this trend to continue over the next couple of quarters until there’s some level of certainty in the US.”

For the first quarter, the US Commerce Department announced that the economy shrank for the first time in three years. The 0.3% contraction was fueled by businesses scrambling to strategize in response to President Donald Trump’s confusing trade policy.

“While we’re seeing that deals that have been in the works since last year are still getting across the finish line, the uncertainty driven by the imposition of tariffs in the US and increase in long-term interest rates, which in turn has led to market volatility, has definitely caused potential acquirers to think twice before doing deals,” Toyokawa adds.

The current scenario is in stark contrast to what big banks were expecting at the end of 2024 and the start of 2025.

“The pace of mergers and acquisitions around the world gained momentum [in 2024], and there are signs that deal-making will accelerate in 2025,” Stephan Feldgoise and Mark Sorrell, Goldman Sachs’ M&A co-heads, said in a joint statement back in December.

JPMorgan Chase CEO Jamie Dimon was also bullish. Just days before Trump’s inauguration, the bank boss remarked: “Businesses are more optimistic about the economy, and they are encouraged by expectations for a more pro-growth agenda and improved collaboration between government and business.”

Not anymore. According to The Wall Street Journal, Dimon recently told investors at IMF meetings that a recession is the best-case outcome.

Hopes that a second Trump term would bring looser M&A regulations have also been dashed. The Department of Justice and Federal Trade Commission are proving just as tough as they were during Trump’s first term, as well as under former President Joe Biden. Recent lawsuits blocking Hewlett Packard Enterprise’s $14.3 billion acquisition of Juniper Networks and GTCR’s $611 million Surmodics buyout show that even under Trump, antitrust enforcers aren’t easing up.

The will-they-won’t-they dynamic between U.S. Steel and Tokyo-based Nippon Steel isn’t serving as a useful gauge for how the White House plans on handling M&A regulations, particularly when it’s a cross-border proposal. Under Biden, the deal was blocked due to what the former administration considered national security risks. Trump opposed it last year, but has been indecisive on the matter.

“The market was thinking there would be relief from the harsh anti-merger stance from the Biden administration, not open season on M&A,” Accelerate Fintech’s Julian Klymochko says. “Safe to say, that hasn’t happened.”

Whether M&A pros find that early-year optimism again remains to be seen. After all, hopes were high that pent-up demand, ample capital, and a business-friendly presidential administration would fuel a wave of consolidations.

Instead, dealmaking momentum has stalled, weighed down by rising market volatility and growing economic uncertainty, Andrew Lucano, co-chair of the M&A practice at law firm Seyfarth Shaw, explained.

“Recent US trade policies have introduced significant unpredictability, triggering market swings and prompting caution among deal participants, especially those with exposure to tariff risk,” Lucano says. “Uncertainty has always been one of the greatest inhibitors of dealmaking, and that’s exactly where we are right now. As a result, many players are adopting a ‘wait and see’ approach, at least in the near term, as they assess the full impact of tariffs and any potential retaliatory measures.”


Source link