Archives May 2025

When The Fed Will Finally Act


Jobs data beats expectations … Trump demands lower rates again … when Louis Navellier sees rates coming … weakening consumer data … a win on the China front?

This morning, the U.S. payrolls report came in stronger than expected.

The U.S. economy added 177,000 jobs in April, above the expectation of 133,000 jobs. This kept the overall unemployment rate at 4.2%.

Meanwhile, average hourly earnings climbed 0.2%. This was just below the 0.3% forecast. Similarly, the annual rate of 3.8% was below the 3.9% expectation.

The quick takeaway is that the economy remains steady and reasonably strong.

I write “reasonably” because we should factor in yesterday’s softer weekly jobless claims, which weren’t counted in today’s jobs numbers.

That report showed that initial unemployment claims posted an unexpected increase. First-time filings for unemployment insurance clocked in at 241,000, up 18,000 from the prior period and above the estimate of 225,000.

Now, some analysts are suggesting part of the increase might be attributable to spring break for public schools. But even so, continuing unemployment claims suggest growing weakness.

Here’s CNBC:

Continuing claims, which run a week behind and provide a broader view of layoff trends, rose to 1.92 million, up 83,000 to the highest level since Nov. 13, 2021.

Overall, even with those continuing claims numbers, we’re interpreting the last two days of jobs data as a win for the economy.

But for Fed watchers, is that good or bad?

This morning’s data don’t paint the picture of an economy in dire need of interest rate cuts.

And as we’ve highlighted in prior Digests, Federal Reserve Chairman Jerome Powell likely remains scarred by his characterization of inflation as “transitory” back in 2021. That inaccurate call opened the door to the worst inflation in four decades as well as merciless attacks on his judgement. My guess is that Powell is gun-shy about cutting rates too soon today, cracking open the door to another bout of inflation.

President Trump is not shy…

From the President on Truth Social this morning:

Just like I said, and we’re only in a TRANSITION STAGE, just getting started!!!

Consumers have been waiting for years to see pricing come down. NO INFLATION, THE FED SHOULD LOWER ITS RATE!!!

One must wonder whether this relentless pressure from Trump is ultimately counterproductive. His public demands for lower interest rates could actually harden Powell’s resolve, as the Fed Chair may be unwilling to appear influenced by the President or politically weak.

Given that the current data doesn’t demand an urgent rate cut, Powell might opt to hold off another month – if only to assert the Fed’s independence.

Optics aside, if legendary investor Louis Navellier gets his way, Powell and the Federal Reserve will be riding to the rescue next week

Let’s begin with Louis’ Flash Alert in Growth Investor yesterday:

There’s a growing sense of optimism because on Fox Business yesterday, Scott Bessent said the Fed should be cutting rates.

And that’s because the two-year Treasury yield is at its lowest level since last September. And it’s so far below the federal funds rate, there’s really three rate cuts the Fed should make. 

And here’s this morning’s update after the jobs report:

Treasury yields rolled slightly in the wake of the payroll report. Yields are definitely at least 50 basis points below the fed funds rate.

If you look at the two-year Treasury note, they need to cut – they’re above market rates and they’re being restrictive.

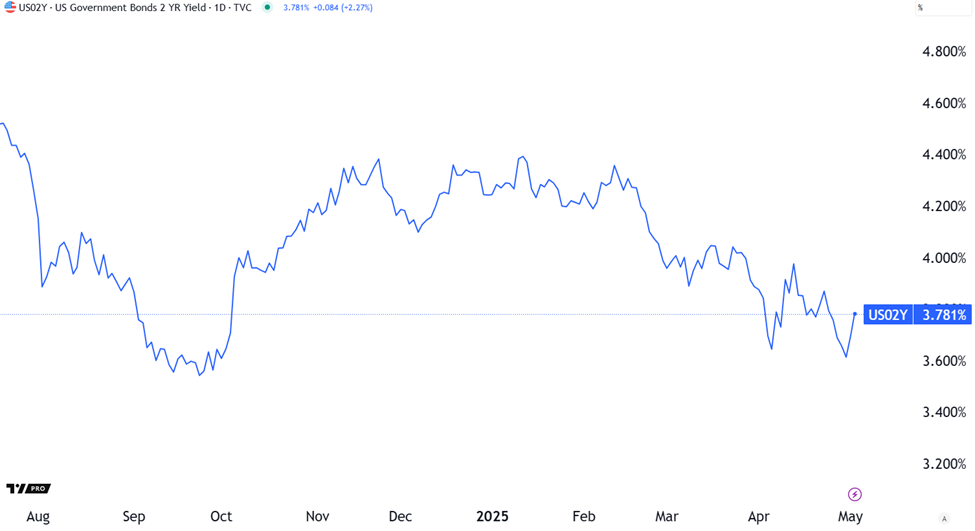
For a visual on Louis’ point, below is the 2-year Treasury yield.

Unlike the 10-year Treasury yield, which has been volatile in 2025, the 2-year yield has been on a relatively smoother decline since January.

And as Louis highlighted, earlier this week, it notched its lowest level since last fall. But it has rolled slightly based on the jobs data.

Chart showing the 2-year Treasury yield falling to lows not seen since last fall

Source: TradingView

Over the years, Louis has repeatedly said that the Fed doesn’t like to fight market rates. So, with the 2-year yield at 3.78% while the fed funds target rate sits at a range of 4.25% – 4.50%, it suggests lower rates ahead.

Back to Louis for how low and when – and some choice words about the Fed:

I’m predicting four rate cuts this year – largely due to the global collapse in interest rates in Europe…

We’re going to get a Fed rate cut in May. If we don’t, [the Fed members are] clinically insane – they’re not looking at the data. And the cause for them to cut will get louder and louder cause market rates will have collapsed.

We do have some people on the Fed that aren’t qualified, but they tend to move in consensus and they should follow market rates – that’s kind of a no-brainer, for lack of a better word.

I think the main message I have is that as soon as the Fed starts cutting, everybody realizes the Fed is going to be cutting, everything’s going to be fine.

While we await “fine,” let’s keep an eye on data from global outplacement firm Challenger, Gray & Christmas showing signs of weakness

Yesterday, Challenger, Gray & Christmas released its April jobs report.

First the good news: Planned job cuts dropped 62% to 105,441 last month.

As to the bad news, layoffs surged 63% compared to last year. Notably, April’s number came in at the highest reading for the month in five years.

And while the temptation is to blame this on DOGE and assume the cuts are limited to federal workers, that’s inaccurate. Here’s Andrew Challenger:

Though the Government cuts are front and center, we saw job cuts across sectors last month.

Generally, companies are citing the economy and new technology.

Employers are slow to hire and limiting hiring plans as they wait and see what will happen with trade, supply chain, and consumer spending.

The bottom line from the Challenger, Gray & Christmas report is that here in 2025, employers have announced 602,493 layoffs, the highest year-to-date total since 2020. This number is 87% higher than the 322,043 cuts announced this time last year.

Meanwhile, disappointing sales from fast-food giant McDonald’s also points toward a weakening consumer

McDonald’s is often seen as a key indicator of consumer spending and sentiment, particularly among lower-income customers. And its latest financial results suggest that these consumers are feeling uneasy. Or as McDonald’s CEO Chris Kempczinski put it:

Consumers today are grappling with uncertainty.

Yesterday, McDonald’s executives reported that U.S. same-store sales dropped 3.6% in Q1, marking the worst decline since Covid lockdowns kneecapped traffic. It was also the second consecutive quarter of same-store sales declines.

Back to Kempczinski:

In the U.S., overall [quick-service restaurant] industry traffic from the low-income consumer cohort was down nearly double digits versus the prior year quarter.

Unlike a few months ago, QSR traffic from middle-income consumers fell nearly as much, a clear indication that the economic pressure on traffic has broadened.

In recent days, we’ve heard similar commentary from executives at Chipotle, PepsiCo., and Starbucks.

From Chipotle CEO Scott Boatwright:

Saving money because of concerns around the economy was the overwhelming reason consumers were reducing the frequency of restaurant visits.

And here’s PepsiCo CFO Jamie Caulfield:

Relative to where we were three months ago, we probably aren’t feeling as good about the consumer now.

And Starbucks CEO Brian Niccol just referred to today’s economy as a “tough consumer environment.”

One final data point – though not related to fast food, it does reflect the financial health of lower-income Americans.

From Fortune:

Credit card data shows consumers are under increasing pressure, just as President Donald Trump’s tariffs are poised to significantly raise costs on everyday consumers.

Over 11% of Americans with accounts at the country’s largest banks only made the minimum payment on their credit card bills in the fourth quarter of 2024, a record since the Federal Reserve Bank of Philadelphia began tracking the number 12 years ago.

Bottom line: While we enjoy this recent market rally, and applaud the payroll data, let’s not overlook these real-world signs of weakness.

There’s a hint of good news on the trade war front

This morning, a spokesperson for China’s ministry of commerce said that Beijing was considering the possibility of tariff negotiations with the United States.

It was consistent with the need to “save face” that’s important to China, which we’ve highlighted in recent days.

From that spokesperson:

US officials have repeatedly expressed their willingness to negotiate with China on tariffs…

China’s position is consistent. If we fight, we will fight to the end; if we talk, the door is open…

If the US wants to talk, it should show its sincerity and be prepared to correct its wrong practices and cancel unilateral tariffs.

Meanwhile, The Wall Street Journal reports that China is now considering ways to address the Trump administration’s demands that China curb its role in fentanyl pouring into the U.S.

From the WSJ:

Chinese leader Xi Jinping’s security czar, Wang Xiaohong, in recent days has been inquiring about what the Trump team wants China to do when it comes to the chemical ingredients used to make fentanyl, the people said.

Chinese companies produce large quantities of the chemicals known as “precursors,” which are sold over the internet, flowing from China to criminal groups in Mexico and elsewhere that produce fentanyl and traffic it into the U.S

The discussions remain fluid, the people cautioned, while adding that Beijing would like to see some softening of stance from President Trump on his trade offensive against China as well.

While not exactly a warm invitation to trade talks, it’s better than a cold refusal.

For now, we’ll take that as a win.

Before we sign off, let’s circle back to the Challenger, Gray & Christmas jobs report

Earlier, I highlighted a quote from Andrew Challenger in which he subtly echoed a theme I’ve been hammering on in recent weeks. Did you catch it?

Here’s the quote again:

Though the Government cuts are front and center, we saw job cuts across sectors last month.

Generally, companies are citing the economy and new technology.

Employers are slow to hire and limiting hiring plans as they wait and see what will happen with trade, supply chain, and consumer spending.

Rephrasing, one of the two reasons given by management for jobs cuts across a range of sectors is…

“New technology.”

My guess is that’s a reference to some version of robotics and the next iteration of AI advancements.

On that note, if you missed last night’s event with Luke Lango about investing in robotics and humanoids today, you can catch a free replay here.

Here’s Luke:

Steel mills, chip fabs, and assembly lines buzzing with “Made in the U.S.A.” labels: The president has promised all of this in a bid to get America’s factories booming.

There’s just one teensy problem…

You can’t rebuild American manufacturing without robots…

That’s why the next great fortune won’t come from chatbots or cloud software. It will come from physical AI—the robotic arms, vision sensors, and autonomous movers that transform concrete slabs into fully automated factories.

Last night, Luke dove into all these details and more, also highlighting his favorite robotics plays today. He also explains why he’s betting on an event next week that will pop the $7 trillion “cash bubble” parked in money-market funds today. Luke believes this will unleash a massive rotation back into stocks.

Here’s that link again to the free replay.

We’ll keep you updated on all these stories here in the Digest.

Have a good evening,

Jeff Remsburg


Source link

Best Long-Term Care Insurance


Why You Should Trust Us

Investopedia’s financial product reviews are based on unbiased research and analysis by our staff. This list of top long-term care insurance companies is based on data from 11 companies, evaluating coverage, financial strength, customer complaints, and other features to help you choose the best provider. Investopedia has been a trusted source of financial information since 1999 and has reviewed long-term care insurance companies since 2020.


How We Chose the Best Long-Term Care Insurance Companies

Investopedia’s list of the best long-term care insurance companies is based on research of 11 companies. Each company had to meet Investopedia’s standards for online transparency and financial strength to be included.

We collected 32 data points from each company from company web pages, media representatives, rating agencies (AM Best and the National Association of Insurance Commissioners), and customer service calls. The research took place from April 2 to April 24, 2025.

Staff editors and research analysts then scored each company using a weighted quantitative model based on eight major categories. We weighted the categories as follows: 

  • Coverage limits: 38%
  • Financial strength: 15%
  • Customer complaints: 10%
  • Types of care covered: 10%
  • Online claims: 10%
  • Riders: 9%
  • Discounts: 4%
  • Standalone policy availability: 4%


Source link

What We Learned From the 4 Big Tech Earnings This Week


Let’s be honest, folks. Out of the 500 companies in the S&P 500, only a few really can really swing the market with an earnings report or a product announcement.

For example, we’re in the heart of earnings season right now. And with 180 S&P 500 companies on deck to report earnings this week, there were only four of those “big deal” companies that both Wall Street and I had our eyes on: Apple Inc. (AAPL), Amazon.com Inc. (AMZN), Meta Platforms, Inc. (META) and Microsoft Corporation (MSFT).

Since these companies make up four of the “Magnificent Seven” stocks, we’re talking about a lot of influence on the market. The other three are Alphabet Inc. (GOOGL), NVIDIA Corporation (NVDA) and Tesla, Inc. (TSLA). (We covered Alphabet’s and Tesla’s earnings in a Market 360 last week – and NVIDIA will announce earnings on May 28.)

These stocks have been the powerhouses that have typically driven the S&P 500 during earnings season. In fact, they currently account for about 30% of the S&P 500 and nearly half of the NASDAQ 100’s market cap, so naturally, these stocks can impact the broader market’s performance.

Now, the first few months of the year were not friendly to this group of stocks. Just look at the chart below…

With all seven companies down in 2025, these earnings reports will give critical insight into what has been plaguing them – whether there are any signs of hope for a turnaround. So, in today’s Market 360, let’s dig into the four big earnings announcements this week and review the market’s reaction. We’ll also take some time to look at what my stock grading system says about each company – and how you find the best stocks for this earnings season and beyond.

Meta Platforms, Inc.

After Wednesday’s market close, Meta Platforms announced a strong first quarter.

Earnings climbed nearly 37% to $6.43 per share, up from $4.71 a year ago. Revenue rose almost 16% to $42.31 billion. Analysts expected $5.21 earnings per share on $41.36 billion in revenue, so profits came in more than 23% higher, and sales beat forecasts by about 2%.

A big part of the boost came from ads. Meta’s ad impressions – how often people saw ads on Facebook, Instagram, and other platforms – rose 5% from a year ago. And the average price per ad went up 10%. More users are also logging on. Daily active people rose 6% to 3.43 billion.

CEO Mark Zuckerberg also touched on the trade tensions during the earnings call. He said the company is in a good spot to handle any bumps in the economy.

For the second quarter, Meta forecasts revenue between $42.5 billion and $45.5 billion. The company is doubling down on its AI investments, too. It now plans to spend between $64 billion and $72 billion in 2025 – more than its earlier estimate of $60 to $65 billion. Most of that money will go toward building new data centers to power its growing suite of AI tools.

Microsoft Corporation

On Wednesday, Microsoft said its revenue hit $70.1 billion – up 13% from last year and ahead of the $68.44 billion analysts expected. Earnings came in at $3.46 per share, beating the $3.22 that Wall Street was looking for. That’s an 18% jump from a year ago.

The cloud business was the star of the show. Its Intelligent Cloud revenue totaled $26.8 billion. Within that, server products and cloud services revenue increased 22%. and Azure Cloud – Microsoft’s cloud platform – did even better, climbing 33%.

While other companies are sounding the alarm about tariffs, Microsoft didn’t dwell on it. But the big question is… are those big bets on AI paying off?

Well, AI services added 7 points to Azure’s 33% growth last quarter – the biggest boost yet. Microsoft is also rolling out AI tools like Copilot across its apps, and demand from big customers is picking up fast.

Microsoft is going all-in on artificial intelligence. Earlier this year, CEO Satya Nadella said the company plans to invest $80 billion in data centers during fiscal 2025. And this past quarter, capital spending came in at $16.75 billion, up nearly 53%.

The company also issued guidance for revenue between $73.2 billion and $74.3 billion for the next quarter, above the consensus estimate of $72.3 billion.

Amazon.com, Inc.

On Thursday after the bell, Amazon reported results that fell short of expectations.

Earnings increased 62% year-over-year to $1.59 per share. Analysts were expecting $1.36 per share. Revenue rose 9% to $155.67 billion, topping estimates for $155.12 billion.

But after digging a little deeper, Amazon’s cloud computing unit, Amazon Web Services (AWS), disappointed Wall Street. This closely watched (and highly profitable) segment brought in $29.27 billion in revenue, a growth of 17%, but just shy of expectations of $29.42 billion.

I should note that Amazon also said it’s launching a new agentic AI group. This group will build software for AI-powered tools called “agents.”

You’re going to be hearing a lot more about AI agents soon, folks. These are programs that can act on their own to complete tasks instead of just answering questions like a chatbot. For example, an AI agent could read your emails, summarize them, schedule a meeting and then send invites – all without being told what to do for each step.

Now, Amazon projected revenue between $159 billion and $164 billion and operating income between $13 billion and $17.5 billion. Both of those were slightly below analyst estimates. The company is also navigating tariff-related challenges, with CEO Andy Jassy emphasizing efforts to maintain low prices and adapt to potential impacts.

Apple, Inc.

Apple earned $1.65 per share in its second quarter of fiscal year 2025. That’s up 8% from a year ago and slightly ahead of analyst estimates for $1.63. Revenue came in at $95.36 billion, up 5%, and just above analyst’s expectations for $94.75 billion.

Digging a little deeper, iPhone sales rose about 2% year-over-year to $46.8 billion, topping forecasts. Mac and iPad sales also both beat estimates, bringing in $7.9 billion and $6.4 billion, respectively.

Apple’s increasingly important Services business continues to soar, bringing in $26.6 billion, up 12% and just shy of expectations for $26.7 billion in revenue.

As for the elephant in the room: tariffs. When asked about potential impacts, CEO Tim Cook kept things vague. Apple didn’t offer specific revenue or earnings guidance for the June quarter, either. But Cook did warn the company expects a $900 million hit from tariffs – a signal that trade tensions are starting to show up in the numbers. To help offset that, Apple is moving more iPhone production to India and expects most U.S.-sold units will be made there by 2026.

Closing Thoughts

Now, following these earnings, Meta and Microsoft opened 7.8% and 9.1% higher, respectively, on Thursday. Meanwhile, on Friday, following their lackluster numbers, Amazon was roughly flat, while Apple was down by about 3.75%.

Overall, it was a mixed bag for these Big Tech companies. But I think there are two key takeaways here. First, the impact of tariffs on these companies is compound and complex. These reports cover the period before Trump effectively challenged China to a trade war, so we should continue monitoring things. Second, the AI Boom is still on, folks. In fact, it continues to gain steam.

So, are any of these four stocks good buys right now? Let’s take a look at what my stock grading system has to say…

Apple and Meta receive a B-rating, which makes them a Buy. However, Amazon and Microsoft earn a C-rating, which makes them a Hold. I should also note that both have weak ratings for their Quantitative Grades, which tells us that institutional buying pressure is dwindling in both.

In other words, my system is telling us that Apple and Meta are worth considering, while investors should be cautious about Amazon and Microsoft.

What My System Is Flagging Now

Now, each of these companies has had a hand in some of the incredible innovations we’ve seen over the past few years. And each one of them has created a fortune for investors.

Thanks to my system, I’ve had a front-row seat. In fact, it identified each one of these companies before they became mega-cap household names.

And now, my proprietary system is lighting up in a whole new way. It’s pointing to a powerful economic shift unlike anything I’ve seen in my four decades on Wall Street.

You see, an unprecedented economic force is reshaping America’s financial landscape at breathtaking speed.

On the good side, it’s creating extraordinary wealth opportunities. On the bad side, it’s causing a systemic elimination of careers once considered “secure.”

And this transformation isn’t just affecting a single industry or sector – it’s fundamentally altering the very foundation of our economy.

That’s why I’ve prepared this brand new video that explains exactly what’s happening, why it matters to you and, most importantly, what specific actions you need to take now to ensure you’re positioned on the right side of this historic wealth divide.

I strongly encourage you to take some time out of your day and watch this immediately.

Click here to watch my special briefing now.

Sincerely,

An image of a cursive signature in black text.An image of a cursive signature in black text.

Louis Navellier

Editor, Market 360

The Editor hereby discloses that as of the date of this email, the Editor, directly or indirectly, owns the following securities that are the subject of the commentary, analysis, opinions, advice, or recommendations in, or which are otherwise mentioned in, the essay set forth below:

NVIDIA Corporation (NVDA)


Source link

Strong Earnings Helped Tech Stocks Shake Off Tariff Worries to Log an Upbeat Week


It was a good week for tech stocks.

The S&P 500’s tech sector index climbed 1% Friday to log a nearly 4% weekly gain after some of America’s biggest tech companies reported better-than-expected earnings. Several of those companies also stood by their AI ambitions, sustaining optimism about the emerging technology even as worries about the economy in the face of shifting tariff policies and tightening trade restrictions loomed. 

Meta (META) showed what analysts called “tangible business results” from its AI efforts, and the stock climbed, adding almost 9% since the company reported earnings late Wednesday. Microsoft (MSFT), which also reported Wednesday, gained 10% after posting strong results, its growth fueled by demand for cloud computing and AI.

Amazon (AMZN) and Apple (AAPL) followed with earnings that topped Street estimates after the closing bell Thursday. Worries about tariffs weighed on enthusiasm for the stocks, with Amazon shares little changed Friday and Apple dropping close to 4% after CEO Tim Cook warned the iPhone maker would take a $900 million hit from tariffs in the current quarter. 

Still, it was a strong week for most members of the Magnificent Seven, with the Roundhill Magnificent Seven ETF (MAGS) adding over 3%. Stocks got a boost Friday after Chinese officials signaled interest in ending the trade war with the U.S., with the S&P 500 rising 1.5% to erase all of its post-“Liberation Day” losses. (Read Investopedia’s full coverage of today’s trading here.)

The big tech earnings parade isn’t over yet: The last of the Magnificent Seven to report this season is Nvidia (NVDA), which is scheduled to release its quarterly financial results May 28.


Source link

Upcoming Collections Could Make Student Loan Borrowers’ Financial Situation Even Worse


KEY TAKEAWAYS

  • According to the Department of Education, 5 million borrowers have defaulted on their federal student loans, and 4 million are delinquent.
  • The Department of Education plans to resume wage garnishment on defaulted borrowers this summer, making it harder for borrowers to make other payments.
  • Collections and lowered credit scores will make taking out new debt harder and more expensive for defaulted student loan borrowers.

The millions of student loan borrowers struggling to make payments could soon face a predicament as collection efforts resume.

The Department of Education said 5 million borrowers have defaulted on their federal student loans, and expects 4 million more to default in the next few months. Starting May 5, the department plans to resume the collection of defaulted loans, eventually leading to involuntary wage garnishment for some borrowers.

Over the last five years, pandemic-era pauses, court cases related to the Saving on a Valuable Education repayment plan, and a change of administrations have caused tumult and confusion for many student loan borrowers. Now, looming collections have some borrowers distressed.

“I’m not against paying my loans back, I took them out and went to school. But without affordable repayment options or programs, it just seems really suffocating for a large amount of borrowers,” one user with student loans posted on Reddit.

Collections Will Likely Make it Harder for Borrowers to Pay Other Debts

Borrowers who have not paid for at least 270 days could see up to 15% of their income, tax refund, or federal benefits withheld and sent to their loan holder starting this summer. And that could have repercussions on other parts of student loan borrowers’ financial lives.

American consumers are already struggling to pay their debt. In a recent study by digital finance company Achieve, one in three consumers said their debt is unmanageable, and 36% said they can’t pay all their bills on time.

“Many borrowers may have taken on more debt than they can manage during the moratorium, and student debt may now sit lower in the payment hierarchy,” wrote Shandor Whitcher, a Moody’s Analytics economist, in a blog post.

Paying off additional bills can be harder for student loan borrowers who have other debt and have part of their income cut from wage garnishments. According to Achieve, 37% of student loan borrowers who reported missing a payment on any type of debt said they did so because they ran out of money.

Credit Hits Can Make New Debt More Expensive

The average FICO score fell in February, mainly driven by about 2.7 million delinquent student loan borrowers whose missed payments were reported to credit bureaus for the first time in five years.

Research from the Federal Reserve Bank of New York estimates that more than 9 million borrowers hold delinquent student loan debt and could see their scores fall as much as 171 points.

Borrowers with lower credit scores typically have more debt and are more likely to say their debt is unmanageable than those with higher scores, according to Achieve. In addition, missed payments stay on a borrower’s report for seven years, leading to reduced credit limits, increased interest rates on new loans, and less access to credit.

“While [the average credit score fell] only two points right now, it’s going to continue to get worse,” said Jack Wallace, director of government and lender relations at Yrefy, a private student loan company.

Defaulted borrowers can consolidate their loans or enter a rehabilitation program to avoid the adverse effects of wage garnishments and collections. Delinquent borrowers have a few more options before they are put into default status, including signing up for lower payments under an income-driven repayment plan or applying for forbearance.


Source link

Brace Yourself for More Stock Market Turmoil Ahead


Editor’s note: “Brace Yourself for More Stock Market Turmoil Ahead” was previously published with the title “Painful Stock Market Chaos: You Ain’t Seen Nothin’ Yet” in April 2025. It has since been updated to include the most relevant information available.

If you’ve felt confused, frustrated, or downright sick to your stomach watching the stock market this year, you’re not alone. This has been one of the ugliest, most volatile, and whiplash-inducing starts to a year that Wall Street has ever seen…

Indeed, since January, we’ve endured:

  • A 10% correction in the S&P 500 within 20 trading days (between February and March)
  • An even more violent 10% drop in just two days in early April – something that’s only happened five other times in the past 100 years, all during moments of crisis like the Great Depression, Black Monday, and 2008’s Great Recession
  • One of the biggest single-day rallies ever when markets exploded higher on a hint of tariff relief
    • On April 10, the Dow Jones Industrial Average popped 7.9%, its biggest single-day gain since March 2020. The S&P 500 surged 9.5%, its biggest single-day gain since 2008. And the Nasdaq soared 12.2%, notching its second-best day ever.
  • A post-winning-streak slump to begin the first-quarter earnings season, with all three major indices closing in the red.
  • And most recently, the market soared in one of the most impressive upward thrusts in history. After closing higher for the fourth straight day, the Nasdaq was up 6.7%, the S&P popped 4.6%, and the Dow rose 2.5%, triggering some ultra-rare and ultra-bullish technical buy signals…

In fact, while the market recovered over the past few trading days, just last week, it was tracking for its third-worst year on record after dropping more than 12% in the first 74 trading days. 

The only years that had worse starts? 1932 and ‘39 – when the U.S. was crawling through the Great Depression. 

Things got that bad this year.

And if you’re wondering what caused this mess in the first place, well, you probably already know the answer…

Liberation Day.”

How ‘Liberation Day’ Unleashed Stock Market Mayhem

It may have a positive implication, but “Liberation Day” offered no reason to celebrate.

That was the day that U.S. President Trump detonated an economic bomb of sorts, igniting one of the most aggressive, sweeping trade wars in our history. 

He enforced tariffs on nearly every U.S. trading partner that were so big, many thought they would completely freeze global trade. 

Consumer confidence cratered. Treasury yields surged. Widespread panic ran rampant on Wall Street. 

Since then, chaos has been the norm:

  • China fired back, imposing tariffs on 128 products it imports from America, including a 25% tariff to aluminum, airplanes, cars, pork, and soybeans, as well as a 15% tariff to fruit, nuts, and steel piping
  • Trump responded by hiking tariffs on China even more to 125%
  • Then the White House paused tariffs levied against our trading partners – excluding China – while still hiking Chinese tariffs even more
  • The U.S. then exempted electronics from those ultra-high China tariffs, with talk of possible auto part exemptions as well
  • All the while, the White House claims that the U.S. is having great talks with other trading partners but without any tangible trade deals to show for it
  • And while trade tensions do seem to be simmering down, the White House is apparently opening probes to potentially launch a new set of tariffs on semiconductors and pharmaceuticals

It feels more like we’re watching a political soap opera instead of a functioning market.

Everyone – from billion-dollar hedge fund managers to Main Street investors – is flying blind.

But here’s the thing…

As painful as it’s been… and as confusing and volatile as it still is…

This may be nothing compared to what’s coming.


Source link

Watch These Amazon Stock Price Levels After Company Issues Soft Outlook


Key Takeaways

  • Amazon shares wavered between losses and gains Friday after the e-commerce and cloud computing giant issued a cautious outlook amid uncertainty about the economy
  • Since bottoming out last month, Amazon shares have consolidated within a rising wedge. More recently, the price has rallied toward the wedge’s top trendline and 50-day moving average, a move that has coincided with the relative strength index crossing back into bullish territory.
  • Investors should monitor key support levels on Amazon’s chart around $170 and $152, while also watching important resistance levels near $199 and $216.

Amazon (AMZN) wavered between gains and losses Friday after the e-commerce and cloud computing giant issued a cautious outlook amid uncertainty about the economy, offsetting strong quarterly results.

During the company’s earnings call, CEO Andy Jassy told analysts the company hasn’t seen any significant impact from tariffs denting consumer demand or sellers setting product pricing, but cautioned that may change. He also said that Amazon has remained proactive to keep prices low.

Amazon shares had lost 13% since the start of the year through Thursday’s close and dropped 22% from their record high established in early February, weighed down by concerns that the company could get caught in the crosshairs of a protracted U.S.- China trade war. The stock was up about 1% at $192 in early-afternoon trading Friday, recovering from losses earlier in the session.

Below, we break down the technicals on Amazon’s chart and point out key post-earnings price levels worth monitoring.

Rising Wedge in Focus

Since bottoming out last month, Amazon shares have consolidated within a rising wedge. More recently, the price has rallied toward the wedge’s top trendline and 50-day moving average (MA), a move that has coincided with the relative strength index (RSI) crossing back into bullish territory.

Let’s identify several key support and resistance levels on Amazon’s chart that will likely gain investors’ attention.

Key Support Levels to Monitor

A decisive breakdown below the rising wedge pattern’s lower trendline could see the shares drop to around $170. This area on the chart would likely provide support near the late-April low and the trough of a minor pullback to the 200-day MA last August.

Selling below this level brings lower support at $152 into play. Bargain hunters could seek buying opportunities at a location near last year’s early August sell-off low. This region also roughly aligns with a projected bars pattern downside target that extracts the trend lower that preceded the rising wedge and repositions it from the pattern’s top trendline, speculating where the shares may be headed if a continuation move lower plays out.

Important Resistance Levels to Watch

A breakout above the rising wedge pattern’s top trendline would likely see the stock test overhead resistance near $199. The shares may run into selling pressure in this area near a horizontal line that connects a range of corresponding trading activity on the chart extending back to early July last year.

Finally, a more bullish move higher in Amazon shares could propel a move up to $216. Investors who bought at lower levels may see this as high probability area to place sell orders near the stock’s November peak and January trough.

The comments, opinions, and analyses expressed on Investopedia are for informational purposes only. Read our warranty and liability disclaimer for more info.

As of the date this article was written, the author does not own any of the above securities.


Source link

Airbnb Says Economic Uncertainties Are Causing Softer US Travel Demand


Key Takeaways

  • Airbnb reported softer U.S. demand, which it blamed on economic uncertainties.
  • The travel rental site sees current-quarter average daily rate to be flat, and adjusted EBITDA margin to be flat or down slightly.
  • First-quarter profit and sales were above estimates.

Airbnb (ABNB) shares pulled back slightly Friday, a day after the vacation rental site warned that economic conditions were leading consumers to pull back on travel spending.

In a letter to shareholders along with its first-quarter results, the company said, “In the U.S., we’ve seen relatively softer results, which we believe has been largely driven by broader economic uncertainties.” Airbnb explained it now expects its second-quarter average daily rate (ADR) to be “approximately flat year-over-year,” and adjusted EBITDA margin “to be flat to down slightly.”

In the first quarter, the company reported earnings per share of $0.24, with revenue up 6% to $2.27 billion. Both were slightly above Visible Alpha forecasts.

Airbnb noted that the rise in revenue was primarily because of “solid growth in nights stayed.” Nights and experiences booked gained 8% to 143.1 million.

Shares of Airbnb are down about 6% in 2025.

TradingView


Source link

Trade winds shift; US assets cheer – United States


  • The first 100 days of Trump 2.0 have been explosive, with unprecedented moves across financial markets. April was an historic month of U-turns and flip-flopping on policy by the Trump administration, but recently, the more subdued tone on trade wars has supported risk appetite once again.
  • China said it is evaluating US officials’ willingness to negotiate trade talks, giving a spark of hope for de-escalating the trade war between the world’s largest two economies.
  • Market volatility has eased back from multi-year high and US stocks have rebounded impressively. The S&P 500 extended its rally, posting its strongest eight-day winning streak since November 2020.
  • Ultimately, markets appear to be shrugging off trade war concerns for now, buoyed by optimism that negotiations may ease tensions, plus resilient corporate earnings.
  • In the macro sphere, data has been mixed. The US economy contracted by 0.3% in the first quarter of 2025, marking its first decline since early 2022. Consumer confidence fell to a 5-year low, but the ISM manufacturing PMI was less downbeat than expected.
  • Still, growing fears of tariffs triggering a global economic slowdown have led to more monetary easing being priced in by markets. No change from the Fed is expected next week, but at least three cuts are priced in by year-end.
  • In FX, the more positive risk environment and easing market volatility have reduced more of the risk premium from the USD. The dollar index has modestly rebounded from 3-year lows, but the structural outlooks remains bearish.
Chart: Volatility well off peaks as U.S. administration backpedals.

Global Macro
Wave of macro data points to global slowdown

US Q1 GDP contraction. The US economy contracted by 0.3% in the first quarter of 2025, slightly more than expected, marking its first decline since early 2022. This follows the 2.4% growth recorded in the previous quarter, underscoring a sharp reversal in momentum. A key driver of the slowdown was a staggering 41.3% surge in imports, as businesses rushed to stockpile goods ahead of anticipated tariff hikes. This widened the trade gap, with net exports dragging down GDP by nearly 5 percentage points, the largest impact on record. Government spending also contributed to the downturn, subtracting 0.25% from overall growth, its first negative impact since 2022. Additionally, private expenditure saw a significant decline, as businesses and investors navigated heightened uncertainty throughout the quarter.

PCE and job market. Fed’s preferred measure of inflation for the month of march, came slightly higher than expected, but cooled off. PCE prices in the US increased 2.3% year-on-year in March 2025, the lowest in five months but above market expectations of 2.2%. In February, PCE prices was revised upwardly to 2.7%. On the other hand, weekly jobless claims climbed to their highest level since Feb 2025. Both data points could be read as bad news for the Fed, as stagflation worries mount.

China PMI slows. Manufacturing activity saw a sharper-than-expected drop in April, entering contraction territory, with services growth also falling short. Concerns over the economic fallout from trade tensions persist, as it’s unclear if Beijing and Washington are actively negotiating. For now, Chinese authorities are taking a cautious approach, opting for measured responses rather than aggressive stimulus.

Focus shift. With the US administration reversing course on tariffs last week, markets have refocused on trade impacts on global growth. The sharp decline in commodity prices underscores widespread expectations of an economic slowdown, though the extent and duration remain uncertain. Macro sentiment has weighed more on global debt and commodities than equities. While volatility has eased, uncertainty continues to linger.

Chart: US economy shrinks on import surge.

Week ahead
Central Bank decisions and PMIs in focus

Central bank decisions take center stage. The week features two major central bank meetings, with the Federal Reserve’s FOMC decision on Wednesday and the Bank of England’s policy announcement on Thursday. The Fed is widely expected to maintain its target range at 4.25%-4.5%, while markets anticipate a potential 25bps cut from the Bank of England to 4.25% from the current 4.5%. These decisions will be crucial for currency markets, as investors gauge the diverging monetary policy paths of major economies.

Global PMI readings dominate the calendar. The week begins with final April PMI figures across major economies, offering insights into business activity trends. Monday features US services and composite PMI final readings, followed by China’s Caixin services PMI on Tuesday. European PMIs will be released throughout Tuesday, including final figures from France, Germany, and the broader Eurozone, alongside the UK’s services PMI. Japan’s PMI data follows on Wednesday, with the UK construction PMI completing the global PMI picture.

Industrial production data to gauge manufacturing health. Several key economies report manufacturing output figures, starting with France on Tuesday (consensus +0.3% MoM). Germany follows with factory orders on Wednesday (expected +2.1% MoM) and industrial production on Thursday (forecast +1.0% MoM). The UK rounds out the week with manufacturing and industrial production readings on Friday, providing a comprehensive view of global manufacturing conditions amid ongoing economic uncertainties.

Labor market and trade data provide growth insights. The US trade deficit is expected to narrow slightly to $119.5 billion (from $122.7 billion) when reported Tuesday. Canada’s employment figures cap the week on Friday, with forecasts showing a 25,000 job gain following the previous month’s 32,600 decline. The unemployment rate is anticipated to hold steady at 6.7%. These reports will offer valuable context on North American economic resilience as central banks weigh policy adjustments.

Table: Key global risk events calendar.

FX Views
Risk appetite offers dollar reprieve

USD Risk premium reduced for now. The US dollar index posted its worst monthly performance since late 2022 and has dropped over 9% from its 2025 peak in January. But the mood music on trade has improved slightly of late, which has allowed the US dollar to claw back (albeit modestly) some of its recent losses. Despite US GDP contracting in Q1, and consumer confidence dropping to a 5-year low, the ISM manufacturing report wasn’t as bad as expected. Meanwhile, the slightly more positive risk environment and easing market volatility have reduced more of the risk premium from the dollar’s price. That said, the underlying issue has not gone away. The dollar’s challenges stem less from losing its “exorbitant privilege” and safe-haven status, and more from the looming threat of a sharp US economic slowdown tied to trade disruptions and uncertainty. Dollar price action remains poor for now and a further downturn in core US data could lead to an acceleration of the de-dollarization trend. Then there’s the Fed’s meeting next week, which will reveal whether market expectations for swift rate cuts are justified.

EUR Losing shine, but positive structural shifts. Last month proved to be the best ever April for EUR/USD since the inception of the euro back in 1999, but a new bullish trigger for the euro is needed. The rebound in risk appetite, retreating volatility, month-end flows and hopes that the peak of trade war uncertainty is behind us have weighed on the euro for the week or so. This is despite evidence of contrasting economic signals from the US and Europe. Still, the pair remains circa 9% higher year-to-date, well above long-term moving averages, supported by a more-promising euro-area fiscal and structural domestic outlook as well as the structurally weaker dollar case. The deflationary impact of tariffs on the Eurozone opens the door to more ECB rate cuts, which could limit EUR upside, but what appears to be a more favourable cyclical channel might prove more important for the common currency over the long-term. Indeed, as markets adjust to structural shifts, expectations for EUR/USD reaching $1.20 this year are gaining traction.

Chart: A record-breaking April for the euro.

GBP Mixed fortunes. GBP/USD scored its biggest monthly gain since November 2023, but GBP/EUR suffered its biggest monthly decline since December 2022 amidst the rapid rotation of flows from the dollar into the euro following Trump’s tariff announcements. This week has been a mixed one for the pound, up most against EUR, NZD and JPY, the latter more than 1% after that dovish Bank of Japan meeting. But GBP/USD is largely unchanged at around $1.33, whilst versus the NOK and AUD, sterling is down on the week. Global risk sentiment continues to dictate sterling’s price action, but the dovish repricing of Bank of England easing bets is limiting its gains. Traders are now pricing in four more quarter-point interest rate cuts from BoE this year ahead of next week’s meeting where a rate cut is fully priced in. GBP/USD could fall slightly below $1.32 and still be above its 21-day moving average in a sign that the uptrend remains intact and with the 14-day relative strength index approaching neutral levels, this type of consolidation/retracement is healthy before attempting another leg higher.

CHF All eyes on SNB’s response. Despite the rebound in global risk appetite this week, the Swiss franc has snapped a 2-week losing streak versus the EUR and USD and posted its best monthly performance versus the buck (+6.6%) since 2015. Without a broader improvement in global risk sentiment, the Swiss franc’s safe-haven status continues to challenge the Swiss National Bank. The sharp rise in the franc is being monitored closely by the SNB as it risks pushing inflation into negative territory. With Swiss inflation already at just 0.3%, tightening financial conditions could amplify deflation risks, presenting a challenging policy dilemma. Two-year yields have dipped back into negative territory, and swaps markets are now fully pricing in a quarter-point rate cut for June. For now, FX intervention seems unlikely to avoid rekindling tensions with the US administration, which previously labeled Switzerland a currency manipulator during Trump’s first term.

Chart: Easing equity volatility supports sterling-euro uplift.

CAD Breakout below 1.38 fails. The Canadian dollar has found solid support from broader dollar weakness throughout April, gaining around 4% against the greenback, its strongest monthly gain against the US dollar since April 2015. This week, USD/CAD tested a key support level at 1.377, the lowest since October 2024, following optimistic comments from President Trump on renewed trade talks with newly elected Prime Minister Mark Carney. However, CAD struggled to hold below 1.38 as weaker-than-expected macro data weighed on sentiment, reinforcing a bleak outlook for the remainder of the year. The PMI manufacturing index fell to 45.3 in February, marking its third consecutive decline and the weakest reading since May 2020, signaling ongoing stress in factory activity. 

The weekly chart shows firm support at the 90-week SMA at 1.379. Over the past two weeks, CAD has fluctuated between a high of 1.3905 and a six-month low of 1.377, establishing key resistance and support zones to monitor in the days ahead. A ‘death cross’ has emerged on daily candles, with the 20-day SMA crossing below the 200-day SMA, indicating a bearish trend. However, price action is expected to remain range-bound, gravitating toward the 1.393 level, especially if dollar weakness fades and renewed demand for the greenback picks up in the coming days. 

AUD Inflation surprise fails to derail RBA cut expectations. Australia’s Q1 headline CPI came in at 2.4% year-over-year, slightly above the 2.3% consensus, while the critical trimmed mean measure (which RBA closely monitors) reached 2.9%, exceeding expectations of 2.8%. Despite these upside surprises, markets remain convinced the RBA will proceed with a 25bps rate cut in May, with 26bps of easing already priced in. Technically, AUD/USD continues testing the critical 200-day EMA resistance at 0.6408, a level that has historically capped advances. The next key support for the pair rests at 21-day EMA of 0.6351. Watch for upcoming Judo Bank services PMI and building approvals data, which could influence near-term price action. A solid services print might temporarily delay RBA easing expectations, potentially providing additional short-term support for the currency.

Chart: CAD records best month since April 2015.

CNY Manufacturing weakness emerges as Yuan stabilizesChina’s economy is showing initial impacts from tariff concerns, with April’s official manufacturing PMI disappointing at 49.0, significantly below the 49.7 forecast and previous 50.5 reading. The non-manufacturing PMI also underwhelmed at 50.4, missing expectations of 50.6. Particularly concerning was the manufacturing export orders component, which plummeted from 49.0 to 44.7, highlighting growing external pressures. USD/CNH has corrected over 2% from its daily April 8 peak of 7.4290. The pair now approaches key technical support at the 200-day EMA (7.2537), potentially offering an attractive entry point for USD buyers anticipating the longer-term uptrend to resume. Market focus will shift to upcoming Caixin Services PMI, trade balance, and new loans data. The trade figures will be particularly scrutinized for evidence of export resilience amid growing global protectionist measures and signs of manufacturing weakness already evident in the PMI data.

JPY BoJ caution triggers sharp Yen selloff. Markets interpreted the BoJ’s latest communication as surprisingly dovish, triggering an outsized reaction despite Governor Ueda’s moderately hawkish press conference tone. This disconnect highlights the uncertainty phase markets are navigating, particularly with ongoing US-Japan trade negotiations creating additional complexity. USDJPY’s sharp move higher complicates the picture, as the US administration generally prefers yen strength. This tension might reinvigorate speculation for an earlier rate hike, especially considering Japan’s deeply negative real rates amid the BoJ’s still highly accommodative stance. Technically, USDJPY has broken through the important 144.00 resistance level that capped gains throughout late April, clearing out accumulated JPY long positions. The pair now targets 147.00, with immediate support established at 143.50. This technical breakout appears driven by the BoJ’s downward revisions to growth and inflation forecasts rather than a fundamental shift in policy trajectory. Key upcoming data includes the BoJ monetary policy meeting minutes, au Jibun Bank services PMI, household spending, and foreign reserves reports.

Chart: USD/CNH corrected over 2% from its April 8 peak of 7.4290.

MXN Peso trades at 5-year average. The Mexican Peso has held steady, trading near 19.5, its five-year average, and staying below 20 despite mixed local and US macroeconomic data. While first-quarter growth has been sluggish, agricultural activity has helped the Peso avoid slipping into a technical recession.

Challenges remain, like weaker commodity prices, a slowing outlook from its key trading partner to the north, and expectations of further Banxico rate cuts that could reduce carry appeal. Still, the short-term outlook looks brighter as President Sheinbaum’s trade successes with the US and her calm approach to tariff tensions have helped shift sentiment. This week, Mexico and the US reached two key agreements: one to deliver more water from the Rio Grande basin to Texas farmers, addressing concerns over a decades-old water-sharing pact, and another to tackle the New World screwworm pest, avoiding restrictions on US livestock imports.

The Peso’s recent gains could ease inflation worries, while slower growth may help keep broader price pressures in check. Trump’s softened stance on key policies has also boosted sentiment, with the Peso trading stronger in the near term. President Sheinbaum enjoys high approval ratings, with 67% of Mexicans viewing her leadership positively—outpacing her predecessor. Despite hurdles like tariffs and recession risks, optimism persists, with over half of Mexicans expecting economic improvement in the next six months and confidence high in Sheinbaum’s ability to negotiate better trade deals.

Chart: Mexico dodges recession thanks to agriculture growth.

Have a question? [email protected]

*The FX rates published are provided by Convera’s Market Insights team for research purposes only. The rates have a unique source and may not align to any live exchange rates quoted on other sites. They are not an indication of actual buy/sell rates, or a financial offer.


Source link

How to Pass Down Real Estate Across Borders Without Tax Nightmares


Passing down real estate to loved ones gets more complex when the property lies across international borders. Unlike domestic transfers, international real estate transfers involve navigating different legal systems, tax obligations, and reporting requirements.

Luckily, there are legal structures and tax strategies that can minimize the complications and ensure that your property passes smoothly to your heirs.

Key Takeaways

  • Transferring real estate across borders requires navigating different legal systems, tax laws, and reporting obligations.
  • Tax implications can vary depending on the location of the property and the residency or nationality of both the owner and the beneficiaries.
  • Some jurisdictions have tax treaties to prevent the same property from being taxed twice.
  • You may be able to reduce your tax obligations by transferring assets to a business or trust.

Understanding International Estate Planning

Estate planning becomes more complex when foreign real estate is involved, as multiple legal systems and tax rules come into play. Each country may have its own inheritance laws, estate laws, and reporting requirements, which can create confusion and financial strain for heirs.

International planning helps coordinate cross-border issues to ensure your wishes are respected while minimizing legal and tax burdens for your loved ones. With a well-structured plan, you can streamline the transfer process and protect global assets for future generations.

Key Tax Considerations in Cross-Border Real Estate Transfers

Before transferring real estate internationally, it’s important to consider several key tax implications, which can vary depending on the location of the property as well as the residency and nationality of both the owner and the beneficiaries.

“The most common tax challenges people face when transferring real estate across international borders is making sure they do not trigger a taxable event or miss reporting obligations with significant IRS penalties,” said Jasmine DiLucci, tax lawyer, CPA, and founder of DiLucci CPA Firm.

If the deceased was a U.S. citizen or resident, their worldwide assets, including foreign real estate, are subject to U.S. estate taxes if the estate exceeds the exemption amount of $13.99 million in 2025. Whether the property is used for rental income also impacts tax and reporting obligations.

“If the real estate is a personal home with no rental income or bank accounts, then the tax and reporting implications are not significant. But if the real estate is a rental property, then there will be tax and reporting consequences,” DiLucci added.

Additionally, if the real estate is transferred during the person’s lifetime, gift taxes may apply. The person gifting the real estate is generally responsible for paying any applicable gift tax.
But in some cases, the recipient may agree to pay it through a special arrangement.

“US real estate owned by a non-resident or foreign national transferred through inheritance or gift usually creates a taxable event for real estate since foreign nationals do not have the same estate tax exemption afforded to U.S. residents,” DiLucci noted.

However, certain gifts are exempt from taxation.

For example, in 2025, the annual exclusion for gifts is $19,000 per recipient. This means that donors can give away gifts worth up to $19,000 without paying the gift tax.

$13.99 Million

The estate tax exemption, as of 2025. If you give more than this amount over your lifetime, the excess will be subject to the estate tax. However, spouses can combine their exclusions.

Legal Systems and Their Impact on Estate Planning

The legal system in a given country plays an important role in how estates are planned and executed. Broadly, legal systems fall into two categories: common law and civil law.

  • Common law systems, such as those in the U.S., U.K., and Canada, typically allow more freedom in determining how assets are distributed, often relying heavily on wills and trusts.
  • Civil law systems, such as those in France, Greece, and Spain, may impose forced heirship rules, where certain portions of an estate go to specific heirs, regardless of the decedent’s wishes.

Understanding which legal framework applies is necessary to crafting an estate plan that aligns with the local laws while still reflecting the individual’s intentions.

Role of Tax Treaties in Mitigating Double Taxation

Tax treaties between the U.S. and other countries help prevent your heirs from being taxed twice when they inherit foreign real estate. These agreements usually give the country where the property is located the sole right to tax it, but they may also allow a credit so you’re not taxed again in the U.S. on the same property.

“Utilizing the taxes paid in the other country to offset any potential US tax liability is the key driver to reduce double taxation,” DiLucci said.

Imagine a U.S. citizen inherits a house in France from a parent who lived there. France imposes an inheritance tax on the property, which the heir must pay before taking ownership. Normally, the U.S. would also include the value of that house in the deceased’s estate for U.S. tax purposes. However, because the U.S. and France have a tax treaty, the heir can apply a credit for the French inheritance tax paid, reducing or potentially eliminating the U.S. estate tax on the same property.

Strategies for Minimizing Tax Implications

Several strategies can be leveraged to reduce the tax implications of international real estate transfers, including:

Gifting: Transferring ownership to heirs while living can potentially reduce tax liabilities.

Business Ownership Holding property through a business structure, such as a corporation, can simplify the transfer process, as well as offer tax benefits and protect the asset.

Joint Ownership: Adding an individual as co-owner of the property can help avoid probate and estate taxes.

“When transferring real estate internationally, available tax strategies will be based on factors such as income level, asset value, country where the property is located, and whether the person is a US citizen or resident. The location of the real estate is significant since a tax treaty may relieve certain tax implications when transferring by inheritance or gift,” said DiLucci.

Important

Placing assets in a trust can simplify real estate planning but create additional reporting requirements.

Utilizing Trusts for Cross-Border Real Estate Transfers

Trusts are one of the most effective tools for managing international real estate planning. A trust allows an individual, the grantor, to place assets under the control of a trustee for the benefit of the beneficiaries. In cross-border scenarios, trust can help:

  • Avoid probate in multiple jurisdictions
  • Reduce exposure to estate and inheritance taxes
  • Maintain control over how and when assets are distributed

“While trusts can provide benefits, they usually create additional reporting obligations and, in many instances, do not provide a respective tax benefit if not planned correctly,” said DiLucci.

The Bottom Line

Cross-border real estate transfers aren’t as simple as when you’re dealing with non-U.S. properties. Whether you’re planning to pass down a vacation home abroad or your primary residence, it’s important to know the laws and requirements for reporting and taxes. This allows for proper international estate planning, which allows families to preserve wealth, honor their legacy, and ensure that their loved ones are protected across borders.


Source link