Archives April 2025

UAE’s Bold Bid to Lead the Blockchain Revolution in 2025 & Beyond


After years of building out the infrastructure and regulatory environment necessary to attain such a status, the UAE, in particular the Emirate of Dubai, really began to emerge as a major cryptocurrency hub in 2025.

Dubai began laying down the groundwork back in 2018, with the establishment of the Dubai Blockchain Centre. At the time, Bitcoin and other major cryptocurrencies were just starting to enter what was coined “crypto winter.” There was high uncertainty over whether this major gamble would pay off.

Flash forward to now, however, and it’s clear that Dubai’s big bet was a prescient move in hindsight. Major cryptocurrency firms like Binance have established operations, becoming licensed operators in the jurisdiction. The crypto leader has even been putting on one of their flagship events in Dubai called Binance Blockchain Week. This event brings together industry titans to celebrate the crypto ecosystem. Binance CMO Rachel Conlan explains the significance of this event, “Binance Blockchain Week is about so much more than just Binance. It’s a celebration of the entire crypto ecosystem and the incredible power of community. This event really shows how crypto is bringing people together from all over the world.”

Conlan continued, “We’re excited to be releasing this docuseries today, which captures the heart and soul of our shared vision for a decentralized future. Binance Blockchain Week has grown significantly since we first organized it back in 2019, and it is humbling to see the event grow alongside our community numbers. Through it all, our mission remains the same: to unite people and provide a welcoming platform for everyone to learn about crypto and blockchain technology.”

Now positioned as the Middle East’s crypto center, Dubai and the UAE seek to further build on this success, through further growth of the country’s retail and institutional cryptocurrency trading volumes, as well as through the integration of blockchain technology into areas beyond finance.

Dubai’s Rise as a Major Crypto and Web3 Hub

With Dubai’s forward-thinking cryptocurrency infrastructure investment attracting major firms, resulting in their establishment of regional offices in the Emirate, it’s no surprise that this in turn has resulted in a massive increase in cryptocurrency trading volume taking place within the UAE.

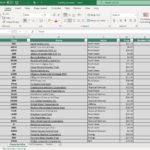
As detailed in Chainalysis’Geography of Crypto Report 2024, a total of $34 billion worth of crypto transactions occurred between July 2023 and July 2024, representing a 42% increase compared to the preceding twelve-month period. Capital from retail and institutional investors alike are pouring into Dubai-based cryptocurrency trading firms. Decentralized finance (DeFi) platforms located in the UAE are also attracting significant capital inflows.

Per the same report from Chainalysis, just in Q2 2024 alone, DeFi platforms received over $3 billion in value, and during the twelve months ending June 2024, decentralized exchanges (DEXs) experienced a 74% increase in total value received, with this figure rising from $6 billion to $11.3 billion.

With the UAE being one of the few countries considered to offer  “regulatory clarity,” Dubai is not only becoming a major hub for DeFi and cryptocurrency trading; it’s becoming a major hub for Web3 startups and talent as well. Web3 entrepreneurs from overseas, in particular from India, have established and/or moved their operations to this jurisdiction.

Capitalizing on Additional Blockchain Use Cases

Dubai and the UAE’s embracing of the blockchain revolution goes beyond just creating a favorable environment for cryptocurrency firms and Web3 startups to operate. The federal monarchy, especially its largest Emirate, are integrating blockchain technology into the rest of the country’s overall economy.

This of course includes integration into other areas of the financial sector. For example, thanks to the UAE’s clear regulatory framework regarding their use, stablecoins have become a major medium of exchange for a variety of transaction types, including real estate transactions as well as cross-border remittances.

More recent regulatory progress points to further integration between traditional and decentralized finance. Looking beyond the financial services sector, it should also be noted that Dubai Customs has already started to utilize blockchain technology for the purpose of improving efficiency at Dubai’s ports, smoothing out supply chain friction, all while improving compliance and reducing issues like counterfeiting and fraud.

Only time will tell, but Dubai’s successful integration of blockchain into both its financial and shipping sectors could be the prelude to further integration efforts that in turn enable the UAE economy to maximize growth.

What Lies Ahead for UAE’s Crypto Sector in 2025 and Beyond

As recent economic and political events drive further inflow of capital into the cryptocurrency asset class, crypto transaction volumes and assets under management will likely continue to climb among the trading and DeFi firms who have set up shop in Dubai.

Although other jurisdictions, including the United States, are starting to reach “regulatory clarity” status, barring rapid changes in the regulatory and taxation regimes of nearby India and other major economies, Dubai and the UAE remain well-positioned to continue attracting overseas companies and talent.

The UAE and Dubai have seen respective efforts produce the desired results, namely the establishment of this area as one of the epicenters of cryptocurrency. From here, both the federation and its largest Emirate have the opportunity to further capitalize on the rise of blockchain technology, through the integration of it into other areas of the economy, as seen in both the financial services and supply chain sectors.


Source link

Monthly Dividend Stock In Focus: SL Green Realty Corp


Updated on April 1st, 2025 by Nathan Parsh

Many investors find high-yielding stocks appealing because of the income they produce. This is why Real Estate Investment Trusts, or REITs, are so popular among dividend growth investors. REITs are required to pass along the majority of their income in the form of dividends.

SL Green Realty Corp (SLG) is a good example of a high-yielding REIT. The stock currently pays a 5.3% yield and pays a monthly dividend. There are currently fewer than 80 monthly dividend stocks.

You can download our full list of monthly dividend stocks (along with price-to-earnings ratios, dividend yields, and payout ratios) by clicking the link below:


The currently high dividend yield offers a substantial boost to expected total returns, making SLG an appealing investment option for income investors.

This article will analyze the investment prospects of SL Green in further detail.

Business Overview

SL Green Realty is an integrated that is focused on acquiring, managing, and maximizing the value of Manhattan commercial properties. It is Manhattan’s largest office landlord, with a market capitalization of $4.2 billion, and currently owns 54 buildings totaling 31 million square feet.

On January 23rd, 2025, SLG reported financial results for the fourth quarter of fiscal year 2024.

Nevertheless, due to a large gain ($0.36 per share) from debt extinguishment, funds from operations (FFO) per share more than doubled over the prior year’s quarter, from a depressed level of $0.72 to $1.81. This beat analysts’ estimates by $0.34. That said, its same-store net operating income dropped 2.7% over the prior year’s quarter.

The pandemic severely hit SLG, which has led many tenants to adopt a work-from-home model.

Office space occupancy in New York remains near historic lows, creating an unprecedented tenant-friendly environment. The exceptionally high FFO per share of $8.11 in 2024 resulted from some non-recurring gains. We project that FFO will decline significantly to $5.40 in 2025.

The trust’s occupancy rate edged up sequentially from 90.1% to 92.5% in Q4. Overall, occupancy rates are well below their pre-pandemic high.

Source: Investor Presentation

Office REITs have been hit especially hard in this environment as employees are working more from home relative to pre-pandemic levels, which has hurt demand for office REITs. This will be something investors will want to monitor as higher occupancy rates generally lead to improved fundamentals.

Growth Prospects

SLG benefits from long-term rental rate growth in Manhattan, one of the most popular commercial areas in the world. The REIT pursues growth by acquiring attractive properties and raising rental rates in its existing properties.

It also signs multi-year contracts (7-15 years) with its tenants to secure reliable cash flows. However, due to the ongoing downturn in the office REIT industry, SLG has seen its funds from operations per share grow at just 2.7% over the last decade.

Due to the pandemic’s impact on its business, the REIT’s funds from operations decreased in the three years prior to 2024. The pandemic has subsided, but the REIT has not begun to recover from the work-from-home trend yet.

Due to a high comparison base formed by the non-recurring gain from debt extinguishment this year, we expect FFO per share to increase at an annual rate of just 1% over the next five years.

Dividend and Valuation Analysis

SLG pays dividends monthly. At a current monthly rate of $0.2575 per share, SL Green has an annualized dividend payout of $3.09 per share, representing a 5.3% current yield.

While the dividend has been reduced recently, it looks sustainable at the current level, even considering interest rate headwinds and the still ongoing headwinds from increased working from home for this office REIT.

We expect SL Green to produce $5.40 of funds from operations per share in 2025, giving the stock a projected dividend payout ratio of 57% for the year. This is a relatively low payout ratio for a REIT. The trust has seemed to manage its business well, and management is experienced.

SLG has a decent balance sheet and a healthy BBB credit rating. It can also maintain its 5%+ dividend, which is well covered by cash flows. Thus, SLG is suitable for income-oriented investors who can patiently wait for the REIT’s recovery from the pandemic.

On the other hand, we note that SLG issued a large amount of debt to buy new properties last year and carries $4.2 billion of long-term debt on its balance sheet, which is more than 100% of the stock’s current market capitalization. We will continue to monitor the debt situation closely.

Final Thoughts

SL Green is a high-yielding REIT that is facing headwinds to its business. The COVID-19 pandemic caused increased working from home, which remains a headwind for Manhattan office occupancy rates.

On the other hand, SL Green also has some long-term growth potential given that it is concentrated in a high-demand area of New York City and since it continues to upgrade its portfolio over time via regular transactions.

The high dividend yield could allow for highly compelling total returns going forward. However, SL Green can’t be described as an especially low-risk stock due to the aforementioned headwinds for its business.

Don’t miss the resources below for more monthly dividend stock investing research.

And see the resources below for more compelling investment ideas for dividend growth stocks and/or high-yield investment securities.

Thanks for reading this article. Please send any feedback, corrections, or questions to [email protected].


Source link

Liberation or trepidation? – United States


Written by the Market Insights Team

US President Trump will unveil sweeping tariffs against US trading partners today. It isn’t a binary event though, a range of tariff policies could be announced, and the repercussions could prove hard to predict long after. Trump expects to bring “liberation” for the US economy, but amidst the spike in trade policy uncertainty, signs of slower growth, upward pressure on inflation and souring risk sentiment dominate. The 4% drop in US equities and the US dollar this year point to a more pessimistic outlook.

Does an awful April await the dollar?

George Vessey – Lead FX & Macro Strategist

Over the last 20 years, April has been the US dollar’s worst month of the year, averaging a negative return of -0.5%. Though seasonality trends will play second fiddle to trade wars, the broader economic and geopolitical landscape doesn’t bode well for the buck either.

The world waits on tenterhooks ahead of the White House’s announcement on a new set of tariffs on imported goods, which have the potential to reshape global trade and disrupt economic activity. The “blurred visibility’’ approach from Trump on tariffs brings a huge amount of unpredictability – and as a result, it’s difficult for companies to plan ahead with spending and hiring decisions. If the haphazard manner in which the White House has imposed its levies continues, it would likely aggravate the situation and potentially impede economic activity. Indeed, yesterday’s data offered a mix of weaker activity data, cooling labour market signals and surging price pressures.

The ISM manufacturing PMI fell to 49 in March from 50.3 previously, below forecasts of 49.5. The reading pointed to the first contraction in factory activity in three months. The details were also ugly. New orders, employment and production all contracted too, whilst price pressures soared to the highest since June 2022. All this suggests that tariff fears are hurting the US manufacturing sector and consistent with early stages of stagflation. This is negative for risk assets.

Nervous investors are hoping for more clarity on tariff policy, but there’s a chance that uncertainty extends beyond today, which is likely why FX traders are in a wait-and-see mode. Currency markets have been relatively calm over the past few days and implied volatility gauges somewhat subdued in light of circumstances. We think an escalating tariff narrative could provide dollar respite early on due to global risk aversion boosting safe haven flows, but rising US growth scares will come back to haunt the buck. A downtrend would also correlate with the dollar’s path during Trump’s first term. Back then, the dollar index depreciated around 15% from peak to trough during 2017-2018.

What we do know is that the Trump administration is aiming for a challenging trifecta: a weaker USD, lower yields, and a robust stock market. Historically, achieving this rare combination requires highly disinflationary policies to push yields and the USD lower, alongside a supportive Federal Reserve to bolster equity market sentiment. However, the current policy mix – marked by geopolitical shifts, tariffs, and macroeconomic uncertainty – may succeed in weakening the USD and lowering yields, but risks undermining economic growth and stock market performance in the process. This delicate balance highlights the complexities of navigating such ambitious goals without triggering broader financial instability.

Chart of US trade policy uncertainty

Betting on euro strength despite tariff threat

George Vessey – Lead FX & Macro Strategist

European risk assets have been performing relatively well since Trump’s election, with EUR/USD up around 4% and the Euro Stoxx 50 up 8%. The German equity benchmark is up a whopping 13% – turbocharged by the historic German fiscal package. In the run-up to Trump’s announcement today, sentiment has turned more pessimistic though and the European Union said it’s ready to retaliate if necessary if reciprocal tariffs are imposed.

Tariffs risk reigniting inflationary pressures in the short term. Longer-term though, a trade war may weaken growth, turning into a disinflationary force for Germany and the eurozone. Germany’s 10-year Bund yield has fallen to a four-week low below 2.7%, reflecting investor caution amid escalating tensions. Money markets currently price an 77% chance of an ECB rate cut in April, but policymakers remain divided. More policy easing could weigh on the euro via falling relative yield spreads, but given the huge fiscal stimulus plans, the impact on growth and therefore need for aggressive monetary easing may be constrained.

This could be why FX options traders are still more optimistic on the euro’s outlook further down the line. So-called risk reversals, a closely watched barometer of positioning, show investors are the most bullish on the euro over the next month since late 2020. That’s despite the fact the common currency is already enjoying its best start to a year since 2016 and also suggests markets are wagering that a trade war will be more detrimental to the US than Europe.

Chart of EURUSD risk reversals

Sterling looks sturdy

George Vessey – Lead FX & Macro Strategist

In contrast to the US dollar, seasonality plays in sterling’s favour. The pound has delivered the best average monthly returns versus the dollar in the past 20 years in April, and this is thanks in part to UK fiscal year-end flows and portfolio rebalancing. GBP/USD has consolidated around the $1.29 handle for the past four weeks, with no reversal signal identified on the charts yet. As long as the pair holds above the 200-day moving average (currently around $1.28), the path of least resistance should remain to the topside. The pair is up 7% from year-to-date lows of $1.21 and less than 4% away from its 2024 high.

As the pound starts April with support from favourable rate differentials and optimism around seasonality trends, there are doubts emerging that the UK will sidestep the worst of Trump’s looming tariff barrage. The Trump administration has not confirmed which countries will be hit, although it has trailed today’s announcement as a sweeping one. This has somewhat dashed hopes that the UK might float under the radar, though negotiating some sort of deal remains plausible, especially thanks to relatively modest bilateral trade with the US.

For this reason, sterling is being dubbed a tariff hedge of sorts. If Trump’s tariff plans roil global markets, sterling won’t be immune, but it seems to have a few supports that can act as a shield. In a full-blown risk-off move, the dollar tends to dominate, but any rebound in the safe haven could be short-lived if the focus shifts back to US recession fears.

Chart of GBPUSD

FX in wait-and-see mode

Table: 7-day currency trends and trading ranges

Table of FX rates

Key global risk events

Calendar: March 31- April 4

Table of risk events

All times are in BST

Have a question? [email protected]

*The FX rates published are provided by Convera’s Market Insights team for research purposes only. The rates have a unique source and may not align to any live exchange rates quoted on other sites. They are not an indication of actual buy/sell rates, or a financial offer.


Source link

Solana Fights to Prove Itself After Massive Crash, While XRP Gains Toward $3.50 and New $0.20 Coin Pushes for $11


​Solana faces intense scrutiny as its price lingers below $125, weighed down by FTX-linked liquidations. Over 5.5 million SOL tokens remain at risk of flooding the market, stalling recovery efforts. Meanwhile, XRP shows resilience, inching toward $3.50 as analysts spot bullish signals. In this shifting crypto market, Rexas Finance (RXS) captures attention with its $0.20 presale token, poised for a potential surge to $11 post-launch.  

Solana Grapples With Liquidation Fallout

Solana’s market position weakens as FTX and Alameda Research offload assets. Recent transfers of $23 million in SOL tokens to multiple wallets hint at impending sales, mirroring patterns from November 2023 when 8 million SOL unstaking triggered a $1 billion sell-off. Technical charts reveal resistance near $131, with analysts warning of a possible dip to $112 if bearish trends persist. While broader markets rebound, Solana’s ties to distressed entities keep investors cautious, delaying any sustained upward movement.  

XRP Builds Momentum Toward $3.50

XRP stabilizes near $1.89, sparking debates over its bottom. Analysts note a bullish divergence on the Relative Strength Index (RSI), echoing a 2022 pattern that preceded a rally. Despite macroeconomic pressures, the token’s RSI climbed from 32.72 to 43.34 during recent dips, suggesting weakening downward momentum. Traders now eye $3.50 as a realistic target if buying volume accelerates, though immediate hurdles remain.  

Rexas Finance Redefines Asset Ownership

While Solana and XRP navigate volatility, Rexas Finance disrupts the crypto market with a presale nearing $47.5 million. The ERC-20 token, RXS, bridges blockchain and real-world assets like real estate and gold—industries worth over $100 trillion combined. By enabling fractional ownership, Rexas allows global investors to buy stakes in properties or commodities with one click. Imagine owning a share of a Tokyo high-rise or a Parisian vineyard from your smartphone, earning passive income without geographic limits. Rexas Finance eliminates barriers between physical assets and blockchain through its Token Builder. This tool lets users convert real estate, art, or commodities into tradeable tokens effortlessly. The Launchpad further empowers creators, offering a platform to fund projects by issuing asset-backed tokens. Combined with Quickmint Bot and AI Shield—tools for instant token creation and fraud detection—Rexas positions itself as a one-stop solution for secure, accessible asset tokenization.

RXS Presale Nears Final Stage With Major Incentives

Rexas Finance prioritizes community growth over venture capital, reserving 50% of its 1 billion tokens for public presale. Early investors saw prices jump 6.6x from $0.03 to $0.20, with 91.47% of allocated tokens already sold. A confirmed $0.25 listing price in 2025 hints at immediate gains, while analysts project a climb to $10+—a 50x return—driven by RXS’s real-world utility. Adding urgency, the ongoing $1 million giveaway awards 20 entrants $50,000 each, fueling investor frenzy.  Further, one entity acquired 1,250,000 RXS ($250k), marking one of the largest RXS transactions this week. Whale activity at this scale often correlates with bullish sentiment.  

Secure, Visible, and Ready for Growth

Listed on major websites, RXS gains exposure to 100 million monthly users, enhancing credibility and liquidity. A CertiK audit ensures smart contract security, addressing investor safety concerns. With plans to debut on three top-tier exchanges, Rexas merges innovation with trust, setting the stage for rapid adoption.  

Final Call for Presale Participation

As Solana battles sell-offs and XRP eyes recovery, Rexas Finance emerges as the standout opportunity. Its presale, now in its final stage, offers a last chance to buy RXS at $0.20 before the 2025 launch. For those seeking transformative gains in a volatile crypto market, Rexas represents more than a token—it’s a gateway to the future of asset ownership. Invest now, or watch this revolution unfold from the sidelines.

For more information about Rexas Finance (RXS) visit the links below:

Website: https://rexas.com

Win $1 Million Giveaway: https://bit.ly/Rexas1M

Whitepaper: https://rexas.com/rexas-whitepaper.pdf

Twitter/X: https://x.com/rexasfinance

Telegram: https://t.me/rexasfinance

Disclaimer: The views and opinions presented in this article do not necessarily reflect the views of CoinCheckup. The content of this article should not be considered as investment advice. Always do your own research before deciding to buy, sell or transfer any crypto assets. Past returns do not always guarantee future profits.


Source link

Monthly Dividend Stock In Focus: Main Street Capital


Updated on April 1st, 2025 by Nathan Parsh

Business Development Companies – or BDCs, for short – can be a great source of current yield for income investors.

Main Street Capital Corporation (MAIN) is a great example of this. MAIN stock has a current dividend yield of 5.2%, but the yield grows to 7.3% when factoring in the company’s special dividends.

Better yet, Main Street Capital stock pays monthly dividends.

You can download our full Excel spreadsheet of all 76 monthly dividend stocks (along with metrics that matter, like dividend yield and payout ratio) by clicking on the link below:


The stock’s high dividend yield and monthly payments make it a solid choice for income investors.

Main Street Capital’s business appears to be on solid footing. This article will discuss the investment prospects of Main Street Capital Corporation in detail.

Business Overview

Main Street Capital Corporation is a Business Development Company (BDC). Our full list is here.

The company operates as a debt and equity investor for lower middle market companies (those with $10-$150 million of annual revenues) seeking to transform their capital structures.

BDCs can invest in both debt and equity, which gives them an advantage over companies that invest in private debt or private equity alone.

Main Street Capital Corporation also invests in the private debt of middle-market companies (not lower middle-market companies) and has a budding asset management advisory business.

Source: Investor Presentation

Both transaction type and geography highly diversify holdings. By transaction type, the BDC acquires most of its deals via recapitalization and leveraged buyouts.

Main Street Capital Corporation also has a very high degree of industry diversification.

At the end of Q4 2024, Main Street had interests in 84 lower-middle-market companies (valued at $2.5 billion), 15 middle-market companies ($155 million), and 91 private loan investments ($1.9 billion).

Growth Prospects

Main Street Capital Corporation’s growth prospects come from its unique strategy of driving investment returns. In turn, the BDC sustains its high monthly dividend payout, and grows it over time.

On November 4th, 2024, Main Street Capital announced a 2.0% dividend increase to $0.25 per share paid monthly. The current annualized dividend payout is $3.00 per share.

On February 27th, 2025, Main Street Capital reported fourth-quarter and full-year results. The quarter’s net investment income increased to 0.2% to $90.4 million, compared to $90.1 million in Q4 2023. Net investment income per share of $1.02 declined 5% year-over-year.

Distributable net investment income per share totaled $1.08, which was down 4% from $1.12 in Q4 2023. Main Street’s net asset value ended the quarter at $29.20, an 8.4% increase from the end of the previous year.

Main Street has established a solid record in the past decade, with a nine-year and five-year net investment income per share CAGR of 7.2% and 10.3%, respectively.

We expect MAIN to grow its net investment income per share by 1% per year over the next five years.

Dividend Analysis

MAIN pays a monthly dividend. The company has also paid substantial supplemental dividends on various occasions. The most recent example was a supplemental payout of $0.30 per share that was declared on February 25th, 2025.

These are one-time special dividends, but we expect the company to continue this tradition of special dividends when distributable NII per share significantly exceeds its monthly dividend payouts.

The supplemental dividends have been a result of generating realized gains from Main Street’s equity investments.

Source: Investor Presentation

The dividend appears secure. For example, based on NII-per-share the company easily covered its dividend every year since 2021.

We expect MAIN to generate NII per share of $4.00 in 2025. With a forward annualized dividend payout of $3.00 per share, MAIN has an expected dividend payout ratio of approximately 75% for this year.

Its regular dividend growth and occasional special dividends imply that its dividend is in good shape.

To avoid corporate income tax as a BDC, Main Street must distribute at least 90% of its taxable income, leaving little wiggle room to fund growth.

While this strategy has worked extremely well since the last recession, we do caution that this method of funding becomes substantially less attractive (and more expensive) in weaker economic periods.

The main threat to the dividend is a recession, which would force many borrowers to default and cause interest rates on floating-rate loans to plummet.

As a result, earnings per share would likely decline rapidly, forcing the company to right-size its dividend. For now, however, the dividend appears to be safe.

Final Thoughts

Although Main Street Capital Corporation is off the radar for most dividend growth investors, this BDC has a strong history of delivering substantial shareholder returns.

The firm’s strong track record of superior investment management and expertise in the lower middle market segment gives it a strong competitive advantage in the private equity and debt industry.

Further, Main Street Capital Corporation is a shareholder-friendly BDC with a high yield and monthly payouts.

Further Reading: 20 Highest-Yielding BDCs

Don’t miss the resources below for more monthly dividend stock investing research.

And see the resources below for more compelling investment ideas for dividend growth stocks and/or high-yield investment securities.

Thanks for reading this article. Please send any feedback, corrections, or questions to [email protected].


Source link

The Truth About Liberation Day


Trump’s goal with tariffs … is it working? … the stock market has turned “manic” … Goldman slashes its earnings forecast … your final day to get Louis’ AI picks

The hysterical financial media has promoted the narrative that these tariffs will be catastrophic for the U.S. economy – and that President Trump is hellbent on destruction.

Nothing could be further from the truth.

So says legendary investor Louis Navellier.

Let’s begin today by separating fact from fiction regarding President Trump’s trade war and tomorrow’s much-anticipated “Liberation Day.”

If “destruction” isn’t driving Trump’s tariff plans, what is?

Back to Louis:

This is all about leverage, plain and simple…

At the heart of it, Trump’s tariff strategy is two-fold:

  1. Level the playing field– “What they charge us, we charge them.”
  2. Encourage onshoringto avoid tariffs altogether.

Both goals are designed to strengthen the U.S. economy – and both are already working.

As one example of tariffs achieving their intended effect, Louis points toward Vietnam and the auto industry

Vietnam has the third-largest U.S. trade surplus after China and Mexico. And Louis notes that Trump tariffs are already achieving the desired outcome:

[Vietnam] has already responded.

It announced it would lower tariffs on certain U.S. products like liquefied natural gas and vehicles – a clear sign that countries are preparing to negotiate rather than retaliate…

This illustrates the “lowering their tariffs” part of the dual goal; let’s continue with the auto industry to highlight the “onshoring” aspect.

Back to Louis:

The EU is still hell-bent on net zero. So that’s why they want all-electric cars by 2035.

Well, if you’re sitting in Germany right now, you’re not making hardly any money, if any, on electric cars. All your money is made on cars with engines.

And Trump’s inviting you to come to America. He’s already said this, and he’ll give you the work visas for all your workers, and your electricity will be a quarter of the cost it is in Germany, and all these states will be throwing incentives at you to move, and you already have plants in America.

So, why don’t you just pick up and move? That’s what’s going on.

Of course, Trump’s tariff strategy isn’t limited to cars.

Louis notes that, altogether, $1.2 trillion in technology onshoring has already been announced. If pharmaceutical and auto companies follow suit, Louis believes that we could see several trillion dollars in new domestic investment.

Louis urges investors to resist the temptation to join the herd in panicking

We know what we’re supposed to do when market conditions turn nasty. We’ve heard the quotes like Warren Buffett’s, “be greedy only when others are fearful.”

But when you’re seeing your portfolio drop 5%… 8%… 14%… watching that translate into losses of thousands (or hundreds of thousands) of dollars, cool-headed logic is often overcome by emotion.

In moments like these, it’s helpful to take a page out of Louis’ playbook and shift our focus from portfolio values to earnings.

From Louis:

Remember, markets are manic. Wall Street has ignored a lot of great AI news lately.

On March 10, for instance, Taiwan Semiconductor Manufacturing Co. Ltd. (TSM) reported that February revenues had surged 43.1% to 260 billion Taiwan dollars.

This is a historically strong forward indicator for chip-designing firms like Arm Holdings plc (ARM) and NVIDIA Corporation (NVDA).

Now, forgetting ARM and NVDA for the moment, look at TSM.

Since that March 10th announcement, TSM has fallen 2%. This is a continuation of its broader 25% pullback since late-January.

Chart showing since March 10, TSM has fallen 2%. This is a continuation of its broader 25% pullback since late-January.

Source: TradingView

This could be a great long-term entry point.

As to Nvidia, regular Digest readers know that this is one of Louis’ favorite stocks.

He put his Growth Investor subscribers into it back in 2019. They’re sitting on open gains of 2,436% as I write Tuesday morning.

Despite its continued earnings/revenue strength over recent quarters, the stock has fallen 27% since the first week of January.

Chart showing NVDA falling 27% since the first week of January.

Source: TradingView

Remember, Louis has called Nvidia his “stock of the decade.” Might a 27% discount be something to consider?

Here’s Louis’ overall take:

[Despite AI earnings growth], investors have only focused on the negatives lately (mainly tariffs). The media only adds fuel to the fire in situations like this, because every setback in talks, and every ensuing pullback, is covered like it’s a full-blown crisis.

This has sent the prices of many world-class AI stocks into correction territory. As a result, we’re now facing a grossly oversold stock market where phenomenal companies like NVIDIA are trading at incredible discounts.

Stock markets are not rational calculating machines. Again, markets are manic.

“Manic market” or not, this does not mean that investors have a green light to go on an indiscriminate buying spree

I was on a call this morning with a handful of analysts from InvestorPlace and our corporate affiliate TradeSmith. The takeaway? This is a stock picker’s market.

While there are plenty of overhyped, overvalued stocks to avoid, some fantastic buying opportunities are available for investors who know where to look – and Louis is looking (and buying) today.

I’ll circle back to those details in a moment. But first, let’s look at why a broad “buy the dip” mentality is dangerous today.

In short, we’re at risk of bearish sentiment eventually broadening into bearish earnings.

In recent Digests, we’ve been highlighting the push and pull on a stock price that comes from two sources: earnings and sentiment.

In the short term, sentiment drives a stock’s price movement, but in the long term, earnings win the day.

Today, bearish sentiment has weighed on stock prices even though earnings forecasts are bullish.

So, if trade wars (and other market overhangs) affect sentiment only, then – eventually – today’s bearish sentiment will turn bullish, and stocks will roar higher as bullish earnings retake the spotlight.

Our hypergrowth/technology expert Luke Lango made this point in yesterday’s Digest:

If the trade war doesn’t heat up… and the economy doesn’t slow… then those earnings estimates will only keep pushing higher… and the current valuation discount will make no sense…

So, AI stocks should rebound strongly.

But if trade wars result not only in today’s bearish sentiment, but also in tomorrow’s weaker earnings, then Wall Street will have to recalculate stock prices across the board.

Not only would those calculations include today’s lower sentiment multiples (and likely, even lower ones), but they’ll also have to include new, lower earnings per share numbers.

That could be brutal for stocks.

To illustrate, over the weekend, Goldman Sachs released a research note updating their market projections. In a worst-case recession scenario, they see stocks falling ~50%.

This leaves us with a rough binary…

If we begin to see evidence that sentiment is turning bullish, that’s a buy signal for great stocks in this “stock picker’s” market.

But if we begin to see a strong case that earnings are weakening, that’s a “take caution” signal.

Well, circling back to Goldman, they just lowered their expectations for where the S&P will finish the year (now projecting a loss). And a big reason for this is earnings.

From Chief U.S. Equity Strategist David Kostin:

These estimates incorporate downward revisions to both earnings growth and valuations, reflecting a weaker base case economic growth backdrop, higher uncertainty, and higher recession risk.

Goldman lowered its 2025 price target for the S&P from 6,200 to 5,700.

Though that target is a little over 1% higher than the S&P’s price as I write, it’s about 4% lower than where we started the year.

Such a tepid broad market forecast amplifies the importance of investing only in fundamentally strong stocks. These companies tend to fall less in bearish markets and rebound faster/higher in bullish markets. Or, as Louis often puts it:

Fundamentally superior stocks bounce like fresh tennis balls.

And this brings us back to what Louis is investing in today, and what he recommends for investors:

With things still volatile and uncertain right now, how should you invest?

The answer is simple: Buy fundamentally superior stocks that bounce!

These are the stocks that hold up when the market gets choppy – and sprint ahead when things turn around.

For an illustration of such stocks, let’s rewind to last week

As we’ve been profiling here in the Digest, Louis, along with our other experts, Eric Fry and Luke Lango held a roundtable discussion centered on AI.

They provided a roadmap for how to invest right now, highlighting a small portfolio of elite AI stocks that they believe will be tomorrow’s market leaders. “Fundamental strength” is a core attribute.

Here’s Louis with earnings data on their top AI plays:

Of the 11 AI Revolution Portfolio companies that reported earnings last month, nine beat expectations, and another met forecasts.

As a group, these 11 firms posted 18% revenue growth and 24% earnings growth, and they are set to increase profits by another 77% by 2026. 

In comparison, the S&P 500 grew earnings 7.1% in the first quarter, while revenue increased 4.2%.

These are phenomenal numbers and serve as a reminder that great investment themes will outlast any market wobble. 

If you missed last week’s presentation, you can catch a free replay right here. Please note, it’ll only be available through tomorrow.

Wrapping up…

All eyes are on “Liberation Day” tomorrow.

Fortunately, Louis (and Luke) believe that while the market pain may not end tomorrow, we’ll begin the tariff clarification process that will result in the return of bullish conditions.

Back to Louis:

The fact is, once the April 2 “Liberation Day” deadline passes and the rules of the road are better understood, much of the uncertainty plaguing the market should fade away.

Clarity, optimism and strong corporate earnings – along with lower interest rates on the horizon – could give stocks the push they need to move higher.

We’ll report back tomorrow when Liberation Day details emerge.

Have a good evening,

Jeff Remsburg


Source link

FX markets on edge ahead of “at least 20%” tariff announcement – United States


Written by Steven Dooley, Head of Market Insights, and Shier Lee Lim, Lead FX and Macro Strategist

Markets inch higher ahead of US tariff announcement

Global markets edged higher overnight ahead of what is likely to be a massive 24 hours with US president Donald Trump planning to announce a new wave of tariffs overnight.

President Trump has marked 2 April as the key date for an announcement around reciprocal tariffs. Of course, the announcement, due Thursday morning APAC time, might be delayed, shifted or more positive than expected. 

In recent days, media reports have suggested the focus will be on a country-by-country basis with tariffs of at least 20% reported overnight.

While equity markets and risk-sensitive currencies like the Australian dollar have been mostly weaker over the last fortnight, we saw a small rebound overnight, led by a 0.4% gain in the US’s S&P 500.

The AUD/USD gained 0.6% as it climbed from one-month lows while NZD/USD gained 0.5% as it also rebounded from one-month lows. In Asia, the USD mostly gained, with the USD/SGD up 0.1% and USD/CNH up 0.3%.

Chart showing Canadian uncertainty is now double peak Covid

RBA holds steady, citing inflation uncertainty

No joy for Australian mortgage holders yesterday, with the Reserve Bank of Australia maintaining the cash rate at 4.10% on Tuesday as expected.

The central bank highlighted that labour markets remain tight despite February’s job losses. It also pointed to heightened global uncertainty, noting that US tariffs are affecting confidence—an impact that could intensify if tariffs expand or other countries retaliate.

The RBA stated that inflation could move in either direction.

AUD/USD reaction was muted after the RBA’s decision and press conference but the AUD/USD ended higher on the day in line with gains in global markets.

That said, the AUD/USD, AUD/CNY, AUD/EUR are all near the lower end of their 30-day trading range, signaling ongoing selling pressure in these markets.

For AUD/NZD, it is in the middle of the 30-day trading range, but AUD buyers may also look to capitalize on the pair.

Chart showing RBA on hold as expected

Japanese yen higher as Tankan Survey indicates May BoJ live

Looking to Japan, the Tankan manufacturing index in Q1 was 12 compared to 14 before, while the non-manufacturing index was 35 compared to 33 previously.

While activity slowed, the results of the survey indicate a higher inflation expectation for all company categories, which supports the argument that the May BoJ will be live.

JPY has strengthened against USD circa 5% YTD, and it is the top three performing G10 FX YTD.

USD remains supported as Fed maintains “moderately restrictive” stance, with FOMC members emphasizing caution on rate cuts due to upside inflation risks.

Looking forward, USD/JPY may look to breach next resistance levels of 50-day EMA of 150.78 and 200-day EMA of 151.44.

Similarly for SGD/JPY, a move higher could potentially breach the next resistance levels of 50-day EMA of 112.42 and 200-day EMA of 113.05.

Chart showing JPY has strengthened vs USD

USD higher in Asia ahead of “Liberation Day”

Table: seven-day rolling currency trends and trading ranges  

Table: seven-day rolling currency trends and trading ranges

Key global risk events

Calendar: 31 March – 4 April

Key global risk events calendar: 31 March – 4 April

All times AEDT

Have a question? [email protected]

*The FX rates published are provided by Convera’s Market Insights team for research purposes only. The rates have a unique source and may not align to any live exchange rates quoted on other sites. They are not an indication of actual buy/sell rates, or a financial offer.


Source link

Monthly Dividend Stock In Focus: Orchid Island Capital


Updated on April 1st, 2025 by Nathan Parsh

Investors are likely familiar with the standard real estate investment trusts, or REITs. Most REITs own physical real estate, lease the properties to tenants, and derive rental income, which is used to pay dividends.

However, investors may not be as familiar with a different set of REITs: mortgage REITs. These REITs do not own physical properties but rather buy mortgage securities.

Mortgage REITs typically have much higher dividend yields than standard REITs, but this does not necessarily make them better investments.

For example, Orchid Island Capital (ORC) is a mortgage REIT with an extremely high dividend yield of more than 19%. Orchid Island pays dividends each month, which makes it a compelling combination of a high yield and monthly dividend payments.

You can download our full Excel spreadsheet of all monthly dividend stocks (along with metrics that matter, like dividend yield and payout ratio) by clicking on the link below:


Orchid Island has an exceptionally high dividend yield and is one of the highest-yielding stocks that we cover.

However, the outlook for mortgage REITs is challenged, and Orchid Island’s dividend yield may still not be sustainable even after multiple dividend cuts in the past several years.

This article will discuss why income investors should not be lured by Orchid Island’s extremely high dividend yield.

Business Overview

Whereas traditional REITs own a portfolio of properties, mortgage REITs are purely financial entities. Orchid Island is an externally managed specialty finance REIT That invests in residential mortgage-backed securities, either pass-through or structured agency RMBSs.

An RMBS is a debt instrument that collects cash flows, based on residential loans such as mortgages, home-equity loans, and subprime mortgages. Mortgage-backed securities are an investment product representing a basket of pooled loans.

As investors saw first-hand during the 2008 financial crisis, mortgage-backed securities can be highly volatile and risky. That said, mortgage REITs were among the biggest winners as interest rates fell during the Great Recession’s aftermath.

Growth Prospects

Mortgage REITs make money by borrowing at short-term rates, lending at long-term rates, and pocketing the difference, or the spread between the two.

When the spread between short-term rates and long-term rates compresses, profitability erodes. This is why mortgage REITs can be dangerous if short-term interest rates are about to increase.

Source: Investor Presentation

Orchid Island has not been able to produce meaningful growth in the past several years. The trust has experienced extreme earnings volatility over the past several years, with a net loss in several years in the past decade and multiple years in which the trust barely generated a profit.

Orchid Island’s inability to perform well with interest rates at zero makes it unlikely that the trust can regain its footing in the current higher interest rate environment.

On January 30th, 2025, the company reported a net income of $0.07 per share for Q4 2024. In 2024, the company faced $236 million in net interest expenses and $16.7 million in total expenses, or $0.26 per share.

However, Orchid’s net realized and unrealized gains on RMBS and derivative instruments last year were $49.1 million, or $0.75 per share.

The book value per share declined to $1.01, or 11%, to $8.09, and the total return was 4.73%. The company paid dividends of $1.44 per share in 2024, contributing to the decrease in book value during the quarter.

Despite these challenges, Orchid maintained strong liquidity, holding $353.6 million in cash and unpledged securities, equivalent to 53% of stockholders’ equity. Additionally, the company’s borrowing capacity was well above outstanding repurchase agreements spread across 25 lenders.

Management, led by CEO Robert Cauley, emphasized its commitment to providing stable dividends to shareholders while closely monitoring the interest rate environment and prepayment speeds to adjust its portfolio strategy accordingly.

Looking forward, Orchid continues to focus on managing interest rate risk and maintaining a diversified RMBS portfolio. As of the end of 2024, its portfolio was valued at approximately $4.2 billion. The company aims to optimize its asset selection and hedging strategies to navigate the evolving economic landscape and deliver attractive risk-adjusted returns to shareholders.

Dividend Analysis

Orchid Island’s eroding fundamentals have caused a significant drop in its dividend payments to shareholders in the past several years.

Orchid Island currently pays a monthly dividend of $0.12 per share, but this is still below the split-adjusted monthly dividend it paid before 2021.

Source: Investor Presentation

Looking back further, Orchid Island’s monthly dividend payout has been reduced multiple times since then.

The trust’s current dividend payout is $1.44 per share on an annualized basis. Based on its recent closing price, the stock offers a 19.3% dividend yield. This is a huge dividend yield, considering the average dividend yield of the S&P 500 Index is currently 1.3%.

However, there are too many red flags for Orchid Island to be considered an attractive investment, including the trust’s multiple dividend cuts over the past few years and inconsistent profitability in that time. With an expected payout ratio of 178% for 2025, the risk for further dividend cuts is high.

In addition, Orchid Island has issued shares rapidly in recent years. Its share count has skyrocketed since 2013, but this comes at a steep cost to shareholders in the form of heavy dilution.

With a volatile dividend history, Orchid Island is not an appealing choice for investors looking for steady dividend payouts from year to year.

Orchid Island stock appears to be the definition of a yield trap. The stock has badly lagged behind the S&P 500 Index, and we believe this underperformance will continue.

Final Thoughts

Sky-high dividend yields can be deceiving. Orchid Island’s 19.3% dividend yield is enticing, but this stock has all the makings of a yield trap.

The trust has a sizable amount of debt on the balance sheet and is issuing shares at an alarming pace. The outlook for mortgage REITs has deteriorated as the Federal Reserve continues to hold interest rates high. The trust’s most recent Q4 results show a significant decline in net interest income and per-share book value.

Orchid Island cut its dividend several times in the past few years due to poor fundamental performance. Investors should tread very carefully with mortgage REITs like Orchid Island. As a result, income investors would be better served by buying higher-quality dividend stocks with more sustainable payouts.

Don’t miss the resources below for more monthly dividend stock investing research.

And see the resources below for more compelling investment ideas for dividend growth stocks and/or high-yield investment securities.

Thanks for reading this article. Please send any feedback, corrections, or questions to [email protected].


Source link

What You Need to Know About Tariffs Before “Liberation Day” Tomorrow


Tantrum, hissy fit, meltdown… no matter what you call it, Wall Street had a very emotional reaction to the Trump 2.0 tariffs over the past few months.

The month of March capped off the worst month and worst quarter for the S&P 500 and NASDAQ since 2022. In the first quarter, the S&P 500 dropped 4.6%, while the NASDAQ plunged 10.4%. The Dow had a more muted fall, with a 1.3% decline in the first three months of the year.

Remember, the stock market is a manic crowd – it tends to react first and think later. So, the recent stock market correction was a gross overreaction to the Trump 2.0 tariffs and inflation fears.

I’ve actually been tracking the hysterical stories about how tariffs will cause inflation, and what I discovered is that the vast majority are from foreign sources. So, in today’s Market 360, we’re going to separate fact from fiction, and I’ll set the record straight about tariffs, inflation and slowing global growth. I’ll also share the stocks you can invest in confidently in this volatile market… and where you can find them.

Separating Fact From Fiction

Fact: The Trump 2.0 tariffs are meant to level the playing field.

President Trump has dubbed April 2 as “Liberation Day,” as reciprocal tariffs will be implemented to equalize U.S. tariffs. President Trump stated, “What they charge us, we charge them.”

The objective of the tariffs is to punish nations that have been serial abusers of using tariffs to protect their domestic industries and/or circumvent U.S. tariffs by using Mexico for subassembly. While President Trump did say on Sunday that the administration “would start with all countries,” he also noted that he “may give a lot of countries breaks.”

Now, two serial abusers are China and Mexico. It’s no secret that Mexico’s trade surplus has surged over the past several years. That’s because China has circumvented U.S. tariffs by doing subassembly in Mexico and importing goods under the cover of the North American Free Trade Agreement (NAFTA).

Another example is Vietnam. Vietnam has the third-largest trade surplus with the U.S., after China and Mexico. And in anticipation of the April 2 tariffs, Vietnam said it would cut tariffs on a few U.S. products like liquefied natural gas (LNG) and vehicles.

So, adjustments are happening, and new trade deals are being negotiated.

Fiction: Tariffs are inflationary.

While the foreign financial media has promoted the narrative that tariffs are inflationary, deflation has already emerged. In fact, China has reported widespread deflation in virtually all categories. Consumer prices fell into negative territory in February and wholesale prices have been stuck in negative territory for more than two years.

I should also add that the U.S.’s trade deficit has soared as goods were “dumped” in the U.S. to try to beat the impending tariffs. These excess goods are not expected to be discounted, and that could further spread the deflationary forces that have recently emerged.

So, the world economy is at risk of slipping into a deflationary spiral.

Meanwhile, inflation is cooling off here in the U.S. The Consumer Price Index (CPI) was unchanged in February and the Producer Price Index (PPI) declined. On the flip side, though, last Friday’s Personal Consumption Expenditures (PCE) index came in hotter than expected, mainly due to a more cautious consumer.

Headline PCE rose 0.3% in February and was up 2.5% in the past 12 months. Core PCE, which excludes food and energy, increased 0.4% last month and is up 2.8% in the past 12 months. Core PCE is the Federal Reserve’s favorite inflation indicator – and it clearly remains above the Fed’s 2% target. Economists’ estimates called for a 0.3% month-to-month rise and a 2.7% annual increase.

Also notable, consumer spending rose 0.4% in February, up from a decline in January. But that still fell short of expectations for a 0.5% increase. So, consumers remain cautious right now.

Overall, though, I don’t foresee the Trump 2.0 tariffs igniting inflation in the U.S.

Fact: The Trump 2.0 tariffs are set to encourage more onshoring.

President Trump has made it crystal clear that the German auto industry is welcome to move its manufacturing to the U.S. He’s noted that the U.S. offers cheaper electricity and labor costs, as well as less oppressive regulations.

Speaking of the latter, the European Union is still set to force the European auto industry to be 100% electric vehicles (EVs) by 2035. However, German auto manufacturers have not been able to make much money on EVs, so onshoring to the U.S. to make internal combustion engine (ICE) vehicles might be a strategic move for German automakers.

Interestingly, President Trump’s executive order last Wednesday to implement 25% tariffs on all imported vehicles, regardless of the country of origin, may push other automakers to explore expanding their U.S. manufacturing facilities.

In the meantime, $1.2 trillion in technology onshoring has already been announced. Apple Inc. (AAPL) and NVIDIA Corporation (NVDA) announced $500 billion and $100 billion, respectively, in onshoring projects in the U.S. And if more technology companies, as well as pharmaceutical and vehicle companies, onshore operations to the U.S., there could be several trillion in onshoring!

The reality is onshoring is the real goal of the Trump 2.0 tariffs – and you will not hear that from the hysterical foreign media.

Fiction: The U.S. is on the verge of recession.

As the recent earnings announcement season wound down and tariff mania took hold, the Atlanta Fed revised its Gross Domestic Product (GDP) forecast down. It now expects the U.S. economy to contract in the first quarter – and that rattled Wall Street.

The primary reason why GDP growth is forecast to be negative in the first quarter is due to a big trade deficit, which is because of all the dumping of imported goods and an increase in gold inventory. Speaking of the latter, gold surged 25% in February after soaring 43% in January, based on Comex stockpiles. The imports of gold from Switzerland have also soared to the highest level since 2012.

So, the trade deficit is now deducting a whopping 4% from first-quarter GDP growth. In other words, excluding the trade deficit, the U.S. economy is still growing.

I should also add that none of the economic tea leaves signal a recession. Both Treasury Secretary Scott Bessent and Federal Reserve Chair Jerome Powell recently stated that the U.S. economy is “healthy.”

The fact is there have been some positive economic reports recently: the strongest factory goods orders report in a year and a surprising jump in existing home sales. Furthermore, the Institute of Supply Management (ISM) posted positive readings for its manufacturing and service sector PMIs.

Also, as we just discussed, the Trump administration is soliciting trillions in onshoring. If successful, that should boost GDP growth. So, the U.S. is not at risk of falling into a recession.

Fact: More respectful trade talks have ensued.

One of the biggest trade agreements the U.S. has is the United States-Mexico-Canada Agreement (USMCA). This went into effect under Trump 1.0 in July 2020. The agreement is set to expire in 2026, and Trump 2.0 wants the USMCA to be the “fairest, most balanced and beneficial trade agreement we have ever signed into law.”

Interestingly, President Trump recently praised Mexican President Claudia Sheinbaum, which is a positive development. Another positive development is that Commerce Secretary Howard Lutnick has had some success negotiating with Ontario Premier Doug Ford, as he lifted the proposed 25% tariff on hydroelectric power.

The new Canadian Prime Minister, Mark Carney, also recently stated that Canada can only go so far in responding to the new import taxes imposed by the U.S., given the mismatch in size between their respective economies. So, Carney said, “We are not trying to organize coordinated retaliation.”

This is a positive sign that the tariff debate has moved behind closed doors, with Lutnick and other trade representatives sitting down to negotiate. In other words, cooler heads are prevailing, and new trade agreements are anticipated.

The Bottom Line

It’s not always easy to separate fact from fiction, especially when Wall Street reacts to every headline and stocks are spiraling lower. But I hope that our closer look at the Trump 2.0 tariffs and their impact on inflation and the U.S. economy helps set your mind at ease.

The reality is that the Trump 2.0 tariffs are largely about settling trade imbalances and pushing foreign corporations to increasingly onshore to the U.S. – all of which should ultimately boost the U.S. economy.

So, despite the continued tariff distractions, the U.S. is now in the midst of an economic renaissance. Economic optimism should steadily rise following “Liberation Day” tomorrow – and continue to rise in the upcoming months.

Positive economic optimism coupled with continued strong corporate earnings and lower interest rates should serve as a powerful one-two-three punch that propels economic growth dramatically higher. And that should also translate to higher stock prices.

So, I continue to encourage you to tune out the noise and focus on the facts. And don’t let the uncertainty or market volatility scare you out of the market either. I am confident that in the end, when all the dust settles, companies that have very strong sales and earnings will lead the market higher.

I expect my Growth Investor stocks to be among the leaders, as they remain backed by 22.4% average annual sales growth and 79.4% average annual sales growth. Plus, the analyst community has increased earnings estimates 4.4% higher for my average Growth Investor stock in the past three months. So, the analyst community remains very positive on my stocks.

In other words, those who follow my Growth Investor stocks can invest confidently. These are the stocks that exhibit tremendous relative strength and begin to rebound quicker than most.

If you’d like to view my Buy List stocks, join me at Growth Investor. You’ll also have full access to my Special Market Podcasts, special reports, and past Weekly Updates and Monthly Issues. I’ll be releasing a new Special Market Podcast tomorrow to review the tariffs and the market’s response. While I will cover Liberation Day in Thursday’s Market 360, if you want my first thoughts on Wednesday, sign up for Growth Investor today.

Sincerely,

An image of a cursive signature in black text.An image of a cursive signature in black text.

Louis Navellier

Editor, Market 360

P.S. Wall Street may be focused on tariffs right now, but we can’t forget what will really disrupt the market: artificial intelligence. For the past few years, my InvestorPlace colleagues, Eric Fry and Luke Lango, and I have been warning about a massive technological divide we call the “Technochasm” – and our predictions have proven alarmingly accurate.

Now, we’re sounding the alarm about an even more dramatic acceleration of this trend, driven by AI’s explosive growth. But if you position your portfolio correctly, you can not only protect yourself from this divide but potentially profit enormously from it.

We just issued urgent buys on six stocks that could surge in the coming weeks and months, as AI enters its destructive phase. You can learn more about how this will all play out in the markets and the names of these six stocks by watching this time-sensitive video. But please watch soon, because this video will be taken offline tomorrow at midnight. Click here to watch it now.

The Editor hereby discloses that as of the date of this email, the Editor, directly or indirectly, owns the following securities that are the subject of the commentary, analysis, opinions, advice, or recommendations in, or which are otherwise mentioned in, the essay set forth below:

NVIDIA Corporation (NVDA)


Source link

Defensive positioning going into tariff event – United States


Written by the Market Insights Team

Uncertainty likely to persist beyond Liberation Day

George Vessey – Lead FX & Macro Strategist

Global markets extended their decline on Monday as trade war concerns continued to dampen investor sentiment, while safe haven Gold saw another strong rally, with prices continuing their run to record highs. The US dollar index ended the month 3% lower, its worst month since November 2022, but started the week on the front foot thanks to some defensive positioning. With so-called “Liberation Day” looming, uncertainty is high, and the range of possible outcomes is wide, with the administration considering various factors, including tariff rates, non-tariff measures, and value-added taxes, which could affect the final outcome.

The US administration’s chaotic approach to economic and trade policy seems to be weighing more heavily on its domestic consumers and businesses relative to peers. This is evidenced by recent US survey data with uncertainty on main street near record highs and consumer confidence at multi-year lows as respondents remain hesitant about economic conditions amid ongoing policy developments. With inflation still stuck above the Fed’s 2% target, and uncertainty around how much tariffs may fuel a rise in prices for consumers and businesses, the central bank has so far in 2025 maintained its benchmark rate at the current level of 4.25% to 4.5%. While the reciprocal tariff announcement tomorrow should provide some incremental clarity on the countries and products impacted and the rates of the levies, these will likely be subject to continued negotiation.

As such, scope for a sustained rebound in risk appetite and therefore risky assets, like equities and pro-cyclical or commodity-linked currencies, appears limited in our view. If trade frictions worsen, a recession is a realistic risk across major economies. This is why hard economic data remains integral too, with eyes on US ISM manufacturing PMI and JOLTS job openings today.

Chart: Global equities turning lower into Liberation Day.

Euro held back by softer inflation

George Vessey – Lead FX & Macro Strategist

The euro stabilised around the $1.08 level at the start this week as investors assessed key inflation data while bracing for reciprocal US tariffs set to take effect on Wednesday. Expected volatility in EUR/USD remains subdued, reflecting trader complacency, with one-week swings estimated within 1.3% – a far cry from recent 1-week ranges. The currency pair staged a 1-week rise of 4.4% earlier this month – its second biggest rise since 2009.

On the data front, inflation for March brought some relief for the European Central Bank (ECB) yesterday. German headline inflation eased to 2.2% y/y – a 2-year low, while core inflation dipped to 2.5% from 2.6%. Germany’s import prices did surge 3.65% though, the highest since January 2023, while retail sales rose 0.8% m/m, marking the biggest increase in five months. Despite this resilience, Germany’s 10-year Bund yield fell to a four-week low as global borrowing costs declined amid escalating trade war fears. Still, the spread between US 10-year Treasury yields and German Bunds has narrowed by the sharpest margin since 2008 (excluding pandemic-related moves). This has coincided with the over 4% rise in EUR/USD this quarter – the strongest Q1 since 2016.

This mostly reflects Germany’s fiscal stimulus package, which aims to support growth. It also reflects the growing concern over inflation risks, potentially keeping ECB rate cutting at bay. But while trade tensions could temporarily lift inflation, a prolonged trade war might weaken growth, turning into a disinflationary force.

For now, euro traders remain on edge because if the US does opt for high tariffs on all EU products this week, EUR/USD could be driven back towards the 200-day moving average nearer $1.07. Conversely, there is a chance traders view this as riskier to the US economic outlook, in which case EUR/USD could move back above $1.09

EUR/USD volatility not far above historical average.

Lacking directional conviction

George Vessey – Lead FX & Macro Strategist

The British pound edged higher against the euro and slightly lower against the dollar on Monday, though the latter clocked its best month since November 2023. Nervousness about the scale and timeline of Trump’s proposed tariffs keeps direction relatively random, confirming a lack of conviction as to how the currency market should react to the announcements on Wednesday.

With focus on April seasonality and bets the UK economy may prove to be relatively shielded from US tariff announcements this week, the pound looks to be in a more favourable position relative to its peers. Because the UK is perceived to be relatively at little risk to US tariffs relative to major peers, sterling has at times found itself well supported around tariff announcements. Indeed, GBP/EUR has recorded three consecutive weekly advances against the euro, although upside momentum is far from strong and the pair is prone to mean reversion around €1.19. Plus, given the elevated focus on tariffs, anything short of immediate implementation could drive some relief for the euro in the short term.

On the data front, the Lloyds business optimism index was published yesterday. This is a strong leading indicator of economic activity in the UK and has rebounded back to levels seen only a handful of times since 2017. Final PMI figures for March are due this week, but will play second fiddle to the tariff chatter.

Chart: Leading indicator for UK GDP growth near highest since 2017.

Oil and gold near recent highs

Table: 7-day currency trends and trading ranges

7-day currency trends and trading ranges.

Key global risk events

Calendar: March 31- April 4

Key global risk events calendar.

All times are in BST

Have a question? [email protected] *The FX rates published are provided by Convera’s Market Insights team for research purposes only. The rates have a unique source and may not align to any live exchange rates quoted on other sites. They are not an indication of actual buy/sell rates


Source link

Copyright © 2023 | Powered by WordPress | Coin Market Theme by A WP Life