Construction equipment maker Caterpillar (CAT) on Wednesday reported a bigger first-quarter sales decline than analysts had forecast.
The company posted revenue that declined 10% year-over-year to $14.25 billion. Analysts had expected $14.65 billion. Adjusted earnings per share of $4.25 matched projections.
Revenue fell 19% in Caterpillar’s Construction Industries segment, while it declined 10% and 2% in its Resource Industries and Energy & Transportation units, respectively.
Caterpillar Presents Two Outlook Scenarios
Caterpillar presented two outlook scenarios for the full year, with and without the impact of tariffs.
Without tariffs, revenue is expected to be “about flat compared to 2024,” which would be better than previous forecasts of “down slightly.” Caterpillar said with tariffs, “before any additional mitigation actions, and with negative economic growth in the second half of 2025,” revenue is seen in line with the prior expectation of a slight decline.
For the current quarter, Caterpillar sees revenue similar to the second quarter of 2024, with an expected cost headwind of $250 million to $350 million due to tariffs.
Shares, which were little changed soon after Wednesday’s report, entered the day down roughly 15% since the start of the year, having been hard hit by the trade escalations that followed the Trump administration’s April 2 tariff announcement.
Earlier this month, the company announced a swap in its C-suite, with COO Joe Creed set to replace Jim Umpleby as CEO on Thursday. Umpleby, who has spent eight years as CEO, will become executive chairman of the board.
GE HealthCare Technologies (GEHC) on Wednesday posted first-quarter results that came in better than analysts had expected, but the former General Electric division lowered its full-year profit outlook because of tariffs.
The medical device maker reported adjusted earnings per share of $1.01 on revenue that increased 3% year-over-year to $4.78 billion. Analysts polled by Visible Alpha had forecast $0.92 and $4.66 billion, respectively.
Adjusted EPS Forecast Lowered Due to $0.85-Per-Share Tariff Impact
However, GE HealthCare lowered its full-year adjusted EPS forecast because of announced tariffs, which it said will have an impact of $0.85 per share. The company said it now expects adjusted EPS of $3.90 to $4.10, down from the prior range of $4.61 to $4.75. It still expects organic revenue growth of 2% to 3%.
“Regarding the current global trade environment, we are actively driving mitigation actions,” CEO Peter Arduini said. “We continue to see strong customer demand in many of the markets we serve and are well-positioned to drive long-term value as we invest in future innovation.”
Also on Wednesday, the company said its board has approved a stock buyback plan of up to $1 billion.
GE HealthCare shares rose 4% shortly after Wednesday’s report was released. Entering the day, they had lost about 13% of their value since the start of the year.
Last week, the firm’s former corporate brethren GE Vernova (GEV) and GE Aerospace (GE) topped Q1 estimates and affirmed their full-year outlooks.
President Donald Trump’s globe-spanning tariff policy has raised the prospect of rising inflation and even a recession.
The swirling economic uncertainty is leaving many Americans questioning where to keep their money right now.
CDs are excellent safe havens in this situation, injecting rock-solid predictability into what you can earn over the coming months or years.
Locked-in returns are always a feature of CDs, but today’s certificates are also paying historically high rates—as much as 4.50%.
But APYs like that won’t last forever, with possible Fed rate cuts likely to push CD rates lower. So it’s smart to lock in a top APY while you can.
The full article continues below these offers from our partners.
CDs Offer Predictability With Almost No Risk—And Pay Really Well Right Now
President Trump’s evolving worldwide tariff policy has triggered a wave of revisions to economic forecasts over the past month. Among the changing forecasts is an increased chance of the United States entering a recession, and the prospect of inflation rising instead of falling—leaving the Federal Reserve in a tricky spot on deciding 2025 interest rates.
Thankfully, not everything is uncertain. While stock market returns are down this month, and savings account rates can be reduced at any time, certificates of deposit (CDs) are one savings tool you can count on for a fixed and guaranteed return. Not only that, you can choose to lock that return in for a few months, for several years, or for virtually any duration that suits your personal timeline.
A predictable rate is nothing special if the return is subpar, of course. But today’s CDs are still near a historic peak. Having benefited from the Federal Reserve’s aggressive rate-hike campaign of 2022–2023, the best CD rates are still offering mid-4% returns across all of the major terms.
Today’s top rate is 4.50%, available for CD terms ranging from 3 to 18 months—which could guarantee your annual percentage yield (APY) into late 2026. Alternatively, you could opt to secure a rate of either 4.28% or 4.32% that you can enjoy until 2027, 2028, or even as long as 2030.
Whether you have liquid savings in the bank or are considering moving some of your investments into cash, you’re guaranteed to grow your balance with a CD. And because all of the options in our daily rankings of the best nationwide CDs are offered by FDIC-insured banks and NCUA-backed credit unions, your money is also federally protected (up to $250,000 per person and per institution).
How to Capitalize on CDs in Uncertain Times
CDs can boost what you earn over time by offering a fixed rate that the bank or credit union can’t lower. But there are certain smart strategies for making CDs work for you.
First, you’ll always want to keep some of your cash savings in a more liquid account, such as a high-yield savings account. That’s because CDs, in exchange for their guaranteed rate, require you to keep your funds on deposit until the CD matures. Cash out early and you’ll most likely be hit with an early withdrawal penalty. But by keeping some reserve funds in a savings account, you can tap that money first in an emergency and perhaps save yourself from cashing in a CD prematurely.
Don’t choose just any savings account for your reserve
Can’t commit to even a short-term CD? Though savings accounts don’t offer rate guarantees, you can earn an excellent return from the top options right now. Today’s best high-yield savings accounts pay as much as 5.00%, with more than a dozen options paying at least 4.40%.
Second, it’s absolutely critical you shop around if you want to earn a competitive rate. Across all FDIC banks, the national average for a 1-year CD is just 1.77%. But by shopping our daily rankings of the best CDs, you can find more than a dozen options in the 1-year range that pay 4.35% to 4.50%. That’s 2.5 times more than the national average.
Third, consider opening more than one CD, splitting your funds across multiple certificates of different durations. Even if you aren’t striving to create a full-fledged CD ladder, spreading your money out over more than one CD, with different terms, means you’ll have funds becoming available at various times—which can perhaps help you avoid withdrawing funds from a longer-term certificate before it matures.
Don’t Delay Since Future Rates Will Likely Be Worse
Our last piece of advice is to act soon. According to the CME Group’s FedWatch Tool at the time of this writing, financial markets are currently pricing in around 68% odds that we’ll see Fed rate cuts totaling a full percentage point—or even more—by the end of 2025. Time will tell if that comes to pass, but any reduction by the central bank will push savings accounts and CD rates lower. So it’s smart to lock in one of today’s stellar rates while they’re still available.
Daily Rankings of the Best CDs and Savings Accounts
We update these rankings every business day to give you the best deposit rates available:
Important
Note that the “top rates” quoted here are the highest nationally available rates Investopedia has identified in its daily rate research on hundreds of banks and credit unions. This is much different than the national average, which includes all banks offering a CD with that term, including many large banks that pay a pittance in interest. Thus, the national averages are always quite low, while the top rates you can unearth by shopping around are often 5, 10, or even 15 times higher.
How We Find the Best Savings and CD Rates
Every business day, Investopedia tracks the rate data of more than 200 banks and credit unions that offer CDs and savings accounts to customers nationwide and determines daily rankings of the top-paying accounts. To qualify for our lists, the institution must be federally insured (FDIC for banks, NCUA for credit unions), and the account’s minimum initial deposit must not exceed $25,000. It also cannot specify a maximum deposit amount that’s below $5,000.
Banks must be available in at least 40 states to qualify as nationally available. And while some credit unions require you to donate to a specific charity or association to become a member if you don’t meet other eligibility criteria (e.g., you don’t live in a certain area or work in a certain kind of job), we exclude credit unions whose donation requirement is $40 or more. For more about how we choose the best rates, read our full methodology.
Boeing shares closed slightly lower on Tuesday to put an end to a five-day winning streak during which the stock gained 14%.
Since forming a bullish piercing pattern earlier this month, the stock has continued to move higher, potentially forming a double bottom in the process.
Investors should watch overhead areas on Boeing’s chart around $187 and $215, while also tracking important support levels near $140 and $121.
Boeing (BA) shares closed slightly lower on Tuesday to put an end to a five-day winning streak during which the stock gained 14%.
The stock got a boost to start the week after analysts at Berstein upgraded the stock, pointing out that the jet maker’s narrower-than-expected first quarter loss posted last week indicates a turnaround toward growth. In addition, Spirit AeroSystems Holdings and Boeing rival Airbus agreed to a deal Monday, clearing the way for Boeing to reacquire the supplier as it works to improve its manufacturing quality
Boeing shares have gained 5% since the start of the year, after a turbulent 2024 that saw the stock lose a third of its value as a string of production mishaps and a crippling machinists strike weighed on investor sentiment. Boeing shares fell 0.2% to $182 on Tuesday.
Below, we break down the technicals on Boeing’s weekly chart and identify major price level worth putting on the radar.
Double Bottom Takes Shape
Since forming a bullish piercing pattern earlier this month, Boeing shares have continued to move higher, potentially forming a double bottom in the process.
It’s also worth noting that while this month’s low made a lower low, the relative strength index (RSI) made a comparatively shallower trough to create a bullish divergence, a technical occurrence pointing to weakening selling pressure.
Let’s identify two major overhead areas on Boeing’s chart that investors may be watching and also locate important support levels worth tracking during pullbacks.
Major Overhead Areas to Watch
The first overhead area to watch sits around $187. This level may provide resistance near the closely watched 200-week moving average and a horizontal line that connects a range of trading activity on the chart stretching back to late 2021.
Further buying enthusiasm could lift Boeing shares to the $215 level. Investors looking for profit-taking opportunities may decide to place sell orders near the upper range of a period of sideways drift on the chart between January and July 2023.
This location also sits in the neighborhood of a projected bars pattern target that takes the stock’s steep uptrend following a prior double bottom on the chart and repositions it from this month’s low, providing insight as to how a similar move higher may play out.
Important Support Levels to Track
A retracement in the stock could see the shares fall to around $140. This area on the chart would likely attract buying interest near last November’s prominent swing low, which also closely aligns with a brief period of consolidation in mid-2022.
Finally, a further descent in Boeing shares could see a drop to lower support at $121. Investors may view this as a potential buying level near the May and September 2022 swing lows that preceded the stock’s steep move higher in the fourth quarter of that year.
The comments, opinions, and analyses expressed on Investopedia are for informational purposes only. Read our warranty and liability disclaimer for more info.
As of the date this article was written, the author does not own any of the above securities.
Smithfield Foods, a Virginia-based company, said selling pork to customers in China isn’t feasible because of tariffs.
China is imposing a 125% tariff on goods from the U.S. in response to America’s 145% tax on imports from China.
Smithfield believes there will be demand for the pork that may have gone to China in other foreign markets, executives said.
Smithfield Foods, a Virginia-based pork producer, said selling meat in China is no longer viable due to the country’s tariffs on American exports.
Sales to Chinese customers accounted for about 3% of Smithfield’s (SFD) sales in 2024, CEO Shane Smith said on a earnings conference call Tuesday. Still, the company released an upbeat outlook for 2025 because it believes there will be demand for these exports in other markets. China imposed a 125% tariff on American products in April, a response to the White House announcing a 145% tax on goods imported from China.
“With China no longer essentially being available, we’ve really had to pivot our business,” Smith said, according to a transcript made available by AlphaSense. “While it’s important, we do believe we have other options.”
Smithfield executives expect there to be ample demand for pork that may have gone to China in the roughly 30 other markets where it exports. The company anticipates sales increasing year-over-year in the low- to mid-single digit percent range in 2025, CFO Mark Hall said.
Still, the company acknowledged the possibility that tariffs will have side effects. In its 2024 annual report, it said that tariffs on pork exports could lead to higher domestic supply levels that weigh on prices.
Besides focusing on other markets, Smithfield aims to bolster earnings by increasing its sales of its more profitable products, such as lunch meats and dry sausages, said Steven France, president of packaged meats.
Smithfield reported $3.8 billion in sales for the quarter ended March 30, up 9.5% from the same period last year, according to its earnings report. Net income attributable to Smithfield increased more than 40% year-over-year to $224 million, the filing said.
The stock rose nearly 9% on Tuesday, leaving it up about 3% this year despite a jagged run for the shares.
Super Micro Computer (SMCI) shares plunged in extended trading Tuesday after the company published preliminary quarterly results below its prior forecast.
The server maker and Nvidia (NVDA) partner said it now expects fiscal third-quarter revenue of $4.5 billion to $4.6 billion, well below its previous estimate of $5 billion to $6 billion. It projected adjusted earnings per share of 29 cents to 31 cents, down from 46 cents to 62 cents previously.
Shares of the beleaguered server maker tumbled more than 15% in after-hours trading. The stock was up 18% for 2025 through Tuesday’s close.
The downward revision comes after delayed consumer product decisions pushed sales into Supermicro’s fiscal fourth quarter, the company said.
Supermicro shares have seen significant volatility this year as concerns about the company’s accounting practices and delayed filings raised worries it could be delisted from the Nasdaq. The company ultimately met the exchange’s deadline to file its delayed reports in February, but still faces challenges, including uncertainty around the impact of tariffs.
The S&P 500 advanced 0.6% on Tuesday, April 29, notching a sixth straight winning session as the White House softened some tariffs on the auto industry.
SBA Communications shares gained ground as strength in domestic leasing underpinned solid quarterly sales results for the telecom infrastructure REIT.
Shares of NXP Semiconductors fell after the chipmaker said its top executive would step down and signaled tariff-related uncertainties.
The S&P 500 added 0.6%, securing its sixth consecutive day of gains. The Nasdaq also closed 0.6% higher, while the Dow was up 0.8%.
SBA Communications (SBAC), a real estate investment trust (REIT) focused on telecommunications infrastructure, posted better-than-expected first-quarter revenue, boosted by strength in its domestic leasing business. The firm also boosted its full-year outlook and announced a new $1.5 billion share repurchase plan, and several analysts lifted their price target on the stock, highlighting an improving growth outlook. Shares of SBAC advanced 6.8%, gaining the most of any S&P 500 stock on Tuesday.
Shares of computational software provider Cadence Design Systems (CDNS) climbed 5.8% following quarterly profit results that exceeded analysts’ forecasts. Cadence also lifted its full-year sales and profit guidance, anticipating robust demand from semiconductor firms for its chip design products as the proliferation of artificial intelligence (AI) technologies heats up. However, questions remain about the impact of tariffs on the company’s business in China.
Zebra Technologies (ZBRA), which makes barcode scanners and other devices designed to help businesses track their inventory, beat top- and bottom-line forecasts with its first-quarter result. Shares of Zebra Technologies were up 5.2% on Tuesday.
Sherwin-Williams (SHW) shares jumped 4.8% after the paint and coatings manufacturer topped earnings per share (EPS) estimates for the first quarter of 2025. Although revenue for the period fell short of expectations, pricing strength in the Paint Store Group, gross margin expansion, and successful cost-control measures helped drive profitability.
Although NXP Semiconductors (NXPI) edged out first-quarter sales and profit expectations, the company announced that its chief executive officer (CEO) would step down at the end of the year. The provider of chips for the automotive market and other industries also pointed to an uncertain environment given potential tariff impacts. NXP shares dropped 6.9% on Tuesday, suffering the heaviest losses in the S&P 500.
Regeneron Pharmaceuticals (REGN) shares also tumbled 6.9% after the biotech firm’s quarterly sales fell shy of estimates. Softness in revenue from Eylea, Regeneron’s treatment for a variety of eye conditions, underpinned the company’s overall sales miss.
Insurance brokerage Brown & Brown (BRO) missed expectations for organic revenue growth, and its shares slipped 6.0%. However, the risk management specialist’s adjusted profits came in ahead of consensus forecasts, boosted by gains in fees and commissions income.
Supermicro shares plummeted 15% in extended trading on Tuesday after the server maker posted preliminary quarterly results that came in well below its prior guidance.
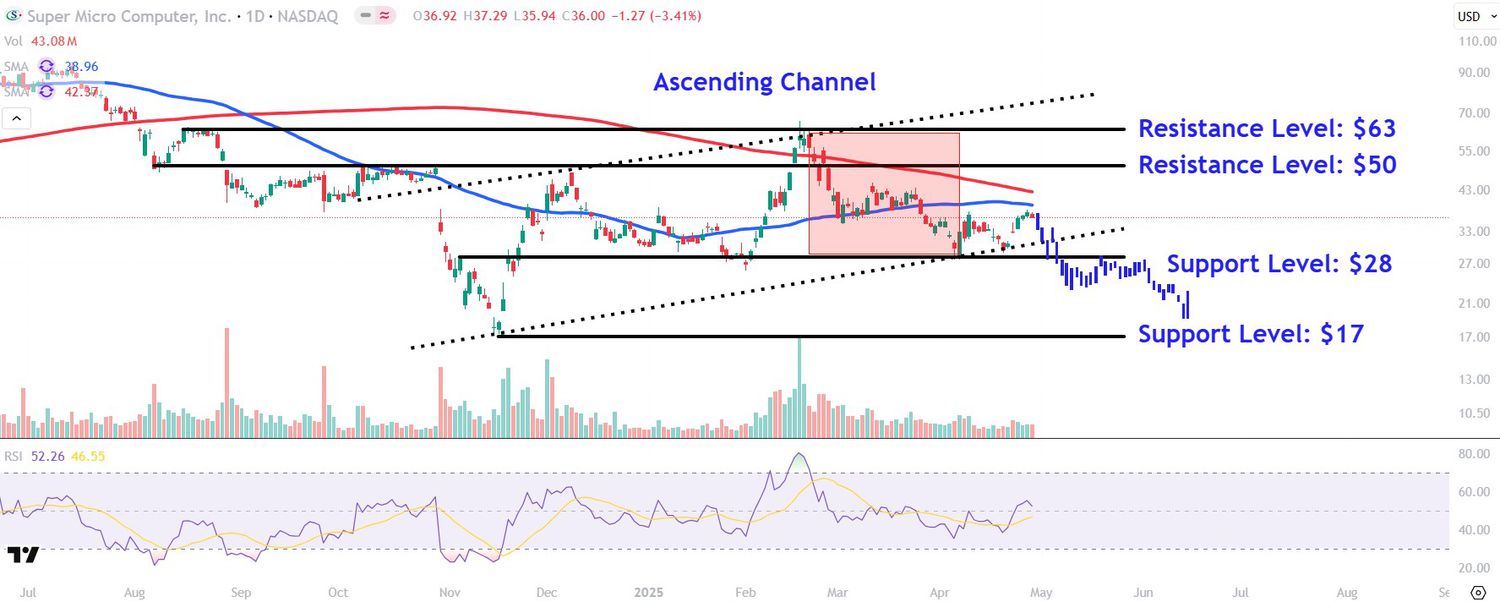
The stock has oscillated within an ascending channel since October last year, tagging the pattern’s upper and lower trendlines on several occasion over that time.
Investors should monitor support levels on Supermicro’s chart around $28 and $17, while also watching resistance levels near $50 and $63.
Super Micro Computer (SMCI) shares plummeted in extended trading on Tuesday after the server maker posted preliminary results for its fiscal third quarter that came in well below its prior guidance.
The company tied the downward revision to delayed consumer product decisions that pushed sales into the current quarter, amplifying broader concerns of a slowdown in spending amid uncertainty over the Trump administration’s sweeping tariffs.
Supermicro shares fell 15% to $30.60 in after-hours trading Tuesday.
Prior to today’s after-hours drop, Supermicro shares had gained 18% so far this year. The stock has, however, seen significant price swings as investors assess recent challenges relating to the company’s accounting and corporate governance practices amid a clouded demand outlook for AI infrastructure, such as servers used in data centers.
Below, we take a closer look at Supermicro’s chart and use technical analysis to identify crucial price levels worth monitoring.
Ascending Channel in Play
Supermicro shares have oscillated within an ascending channel since October last year, tagging the pattern’s upper and lower trendlines on several occasion over that time.
More recently, the stock has rallied from the channel’s lower trendline, though the price has remained below the respected 50- and 200-day moving averages to indicate a longer-term downtrend.
With Wednesday’s projected drop back toward the ascending channel’s lower trendline, let’s identify two crucial support levels worth monitoring and also point out resistance levels to watch during potential upswings.
Support Levels Worth Monitoring
The first support level to monitor sits at $28. This area on the chart, just below the ascending channel’s lower trendline, may attract buying interest near the April and February swing lows, which also closely align with a minor countertrend high during the stock’s sharp sell-off in early November last year.
The bulls’ inability to successfully defend this important technical level opens the door for a larger decline to around $17. Bargain hunters may seek entry points in this area near November’s prominent V-shaped swing low. Interestingly, this location also sits just below a projected downside target that takes the stock’s prior move lower within the ascending channel and repositions it from this week’s high, predicting how a new trend lower may look if price action rhymes.
Resistance Levels to Watch
During upswings, the first level of interest to watch lies at the psychological $50 level. Those who bought shares at lower prices may decide to lock in profits in this region near last year’s early-August trough and the upper range of a consolidation period that formed on the chart last October.
Finally, a more bullish move could see Supermicro shares revisit higher levels near $63. This area on the chart would likely provide resistance near a horizontal line that connects notable swing highs in August last year and February this year.
The comments, opinions, and analyses expressed on Investopedia are for informational purposes only. Read our warranty and liability disclaimer for more info.
As of the date this article was written, the author does not own any of the above securities.
The stock market hasn’t had a worse first 100 days of a presidency in half a century.
The S&P 500 fell more than 7% in the 100 calendar days—69 trading days, to be precise—since Trump’s inauguration on Jan. 20, which concluded Tuesday. That’s the worst post-inauguration performance for the index since Gerald Ford took office in August 1974, when stocks declined more than 11% after Nixon resigned amid a stagflation recession.
A president’s impact on the economy and the stock market isn’t always felt within their first 100 days in office—if it’s felt during their administration at all. But Trump has so far turned the US and global economies on their heads, raising U.S. tariffs to their highest level in about a century and threatening the independence of the Federal Reserve, contributing to upheaval in financial markets worldwide. Consumer confidence has plummeted, recession risks have risen, and business leaders are navigating a thick fog of uncertainty.
Trump entered the White House with the stock market sailing, buoyed by hopes for corporate tax cuts, deregulation, and a flurry of mergers and acquisitions. Stocks hit a record high days after Trump’s inauguration and hovered there for about a month before signs of cratering consumer sentiment set off alarm bells on Wall Street. The stock market has since suffered its worst rout in decades—and one of its biggest rallies in decades—as the president has continued to ratchet up the uncertainty.
The chaos has been more than some of the president’s supporters bargained for. Executives who welcomed Trump’s re-election, expecting four years of business and shareholder-friendly policies, have pushed back against the president’s tariffs. Optimism among small business owners has waned. And some of Trump’s most vocal backers on Wall Street, frustrated with the president’s tariffs, have criticized the administration on social media.
John Feigenbaum and Jeff Garrett greeted attendees and signed advance copies of Red Book 2026 on Friday of the Baltimore Spring Expo.
The Whitman Expos™ Baltimore Spring Expo, held March 27–29 at the Baltimore Convention Center, successfully debuted Whitman’s highly anticipated 2026 Red Book. Collectors and enthusiasts experienced first-hand the completely redesigned and reimagined 79th edition of the renowned numismatic reference during an exclusive pre-launch book signing.
Jeff Garrett and John Feigenbaum, editors of A Guide Book of United States Coins and hosts of the Red Book Podcast, greeted attendees and signed advance copies on Friday, drawing enthusiastic crowds eager to explore the publication’s new format and content enhancements.
The fully redesigned Red Book 2026 features a larger format, more than 2,000 full-color images, and over 32,500 updated market values in up to nine grades for more than 12,000 listings using the industry-standarrd Collector’s Price Guide (CPG®) Retail pricing.
Now available in more industry-standard 6×9” formats, including hardcover, perfect bound softcover, and spiral-bound, as well as large print spiral-bound, both in double-coil.
Notable enhancements include separated Circulation and Proof-strike charts, expanded coverage of Private and Territorial Gold, reorganized Commemoratives sections, and insightful new features like “Fun Fact” spotlights and the “Collector’s Notebook.”
John Feigenbaum, Publisher and President/CEO of Whitman Brands, highlighted the collaborative effort behind the book, stating, “The evolution of this edition represents an extraordinary team effort from editorial to distribution. Collector feedback so far has been tremendously positive, validating the choices made to significantly elevate this year’s Red Book.”
This year’s edition features a completely redesigned interior layout for easier use, market values for more than 12,000 listings using CPG® retail pricing, fun fact spotlights, updated research, the latest U.S. Mint data, and much more.
Dealers on the bourse floor reported robust activity throughout the weekend as public attendance increased, indicating strong enthusiasm and active trading among attendees. The event’s energy underscored the enduring appeal of numismatics within the community.
The Baltimore Spring Expo also featured live podcast recordings and engaging discussions throughout the weekend at the popular WEConnect booth. Esteemed industry experts, including John Feigenbaum, John Kraljevich, Jeff Garrett, and John Brush, captivated audiences with insights and lively conversations on numismatics’ rich history, current trends, and future directions. These discussions reached audiences far beyond the convention center, allowing enthusiasts worldwide to participate virtually.
“The Baltimore Spring Expo is always a vibrant gathering, but this year’s debut of the redesigned 2026 Red Book brought an extra layer of excitement,” said Lori Kraft, general manager of Whitman Expos. “Watching attendees connect with both the updated content and the industry experts at our WEConnect booth truly highlighted the Expo’s unique role as a community hub for numismatic education and networking.”
Collectors who missed the March Expo can mark their calendars for upcoming Expos in Baltimore to explore, learn, and engage with fellow collectors and experienced dealers.
2025 Expos
June 19-21, 2025, Baltimore Convention Center Halls A and B
November 6-8, 2025, Baltimore Convention Center Halls A, B, and C
2026 Expos
March 5-7, 2026, Hall E, Baltimore Convention Center (Note: Different location within the venue)
June 11-13, 2026, Halls A and B, Baltimore Convention Center
November 12-14, 2026, Halls A, B, and C, Baltimore Convention Center
About Whitman Expos™
Whitman Expos is a premier organizer of coin and collectible shows across the United States with a longstanding tradition of connecting numismatic enthusiasts, collectors, and the general public to the fascinating world of coin collecting. Founded on principles of education, community engagement, and passion for history, Whitman Expos offers a unique platform where novices and experts alike can buy, sell, and trade treasured pieces while also diving deep into the stories they tell. Each event, meticulously curated and hosted in major cities, features an array of activities, expert dealers, and rare collections, ensuring a comprehensive and enriching experience for all attendees.
Whitman Brands provides comprehensive resources for collectors, offering unparalleled coverage of collectibles, literature, cataloging, and pricing. Dedicated to celebrating the rich heritage of numismatics, Whitman enriches the lives of coin and paper-money enthusiasts across the globe.
As North America’s leader in coin and currency events, Whitman Expos further elevates the brand, hosting three premier shows annually in Baltimore and expanding the company’s national influence.