Archives April 2025

Gold Flashing Crisis Signal? Why Investors Shouldn’t Panic (Yet)


If you’re an investor looking for a glimmer of hope in this miserable market, you’ve found it with gold.

So far in 2025, gold prices have surged more than 30%, hitting new highs above $3,400 an ounce. It’s one of the sharpest, fastest rallies in gold’s history

Unfortunately, it’s also a strong warning sign.

Here’s the deal: 2025 has been ugly for stocks. In fact, through the first 74 trading days of the year, the S&P 500 is down more than 12%. That makes this the third-worst start to a year on record. The only years that were worse were two during the Great Depression – 1932 and ‘39. And the only years with comparably bad starts? 1941 and ’42 (mid-World War II), 2008 and ‘09 (great financial crisis), and 2020 (COVID-19 pandemic). 

When you’re brushing shoulders with those chapters of history, you know things aren’t going well.

But while stocks are getting steamrolled, gold is enjoying a ‘golden hour.’ Not just good – we’re talking parabolic, headline-dominating, all-time-highs kind of performance.

Technically speaking, it’s one of the most overbought gold markets we’ve ever seen; and that provides an important signal for stocks. 

How Overbought Is Gold in 2025? The RSI Tells a Warning Story

How extreme is this move?

Gold’s relative strength index (RSI) – a momentum indicator used to measure how overbought or oversold an asset is – just jumped above 85 on a monthly basis.

Let’s put that in context: any reading above 70 is considered overbought. So, above 85? That’s so hot it may as well be molten lava.

In the past 55 years, gold has only gotten this hot three times before:

  • In 1972, just after Nixon implemented price controls and strong-armed the Federal Reserve into cutting rates (and right before a decade of hyperinflation).
  • In December 1979, when then-Fed Board Chair Volcker began hiking rates aggressively to crush hyperinflation.
  • And in January 2008, as the U.S. housing market was imploding into the great financial crisis.

These weren’t minor market pullbacks. They were turning points in economic history.

Every Time Gold Surged Like This, Stocks Tanked…

Spoiler: Gold’s outperformance was like a kiss of death for stocks.

After the 1972 gold surge, the stock market fell ~40% over the next two years. After 1979’s peak, stocks went nowhere for three straight years. And following the early 2008 spike, stocks crashed 45% over the following 12 months.

Every time gold has reached this level of being technically overbought, stocks have gone into hibernation – or worse.

Gold gets this hot when fear rules the market. And when fear rules, it’s usually because something very real and very bad is brewing in the background.

So, gold ripping this hard is a signal… and not a positive one.


Source link

PepsiCo Cuts Full-Year Profit Outlook Over Tariffs


PepsiCo (PEP) shares slipped Thursday morning after the beverage and snack food giant lowered its full-year earnings outlook because of tariffs.

The company reported core, or adjusted, earnings per share (EPS) of $1.48 on sales of $17.92 billion. Analysts surveyed by Visible Alpha had expected $1.50 and $17.79 billion, respectively.

The company said it now expects core constant currency EPS to be roughly flat year-over-year, down from its previous outlook of a mid-single-digit increase. PepsiCo cited “expected higher supply chain costs related to tariffs, elevated macroeconomic volatility, and a subdued consumer backdrop” as reasons for the outlook cut.

“As we look ahead, we expect more volatility and uncertainty, particularly related to global trade developments, which we expect will increase our supply chain costs,” PepsiCo CEO Ramon Laguarta said. “At the same time, consumer conditions in many markets remain subdued and similarly have an uncertain outlook.”

Shares fell by 1.5% shortly after markets opened. Entering Thursday, they had declined about 6% since the start of the year.

On Tuesday, the Department of Health and Human Services and Food and Drug Administration said that they plan to phase out a number of food dyes. Some of the dyes are used in popular snack foods like Frito-Lay’s Cheetos products, making the change likely to impact PepsiCo’s manufacturing process and sales once the new rules are in effect.

UPDATE—This article has been updated with the latest share price information.


Source link

5 Things to Know Before the Stock Market Opens


U.S. stock futures are pointing lower as investors eye corporate earnings after a two-day markets rally; Google parent Alphabet (GOOGL) is set to report highly anticipated quarterly results after the close; IBM (IBM) shares are plunging in premarket trading as its CEO warns clients may take a “wait-and-see approach”; Tesla (TSLA)’s EU sales sink for a third straight month; and PepsiCo (PEP) lowers its full-year profit outlook. Here’s what investors need to know today.

1. US Stock Futures Point Lower After Two-Session Rally

U.S. stock futures are pointing lower following a two-day winning streak on optimism over President Donald Trump’s stances on the Federal Reserve Chair Jerome Powell and China tariffs. Dow Jones Industrial Average futures are 0.5% lower after the blue chip index gained 1.1% in the prior session, while Nasdaq and S&P 500 futures are down by smaller percentages. Bitcoin (BTCUSD) is dipping to around $92,500. Gold and oil futures are rising. Yields on the 10-year Treasury note are falling below 4.35%.

2. Alphabet to Report Results After Bell

Alphabet (GOOGL) shares are little changed in premarket trading ahead of the Google parent’s highly anticipated first-quarter report after markets close today. Alphabet is expected to report an 11% year-over-year increase in revenue with earnings per share rising to $2.01. Analysts are largely bullish on the tech giant’s ability to weather economic uncertainty. The search firm shares have lost about 18% of their value so far this year.

3. IBM Stock Drops on CEO Warning About Clients

IBM (IBM) shares are sinking 7% after a warning by its chief executive despite the firm’s stronger-than-expected quarterly results. “In the near term, uncertainty may cause clients to pause and take a wait-and-see approach,” IBM CEO Arvind Krishna said, according to a transcript provided by AlphaSense. Krishna added that IBM hasn’t yet seen any “material change in client buying behavior.” In its first-quarter report, the company reported adjusted EPS of $1.60 on revenue of $14.51 billion, both above Visible Alpha consensus.

4. Tesla Again Posts Weak EU Sales

Tesla’s (TSLA) sales in the European Union (EU) have plummeted for a third straight month. According to the European Automobile Manufacturers’ Association, Tesla’s EU new car registrations, which serve as a proxy for sales, plunged 36% year-over-year in March and have dropped 45% so far this year. They had plummeted 47% in February following a 50% drop in January. Meanwhile, battery-electric vehicle (BEV) registrations in the bloc jumped nearly 17% overall in March. Tesla stock is edging lower in premarket trading.

5. PepsiCo Lowers Full-Year Profit Outlook Amid Tariff Cost Concerns

Food and snack giant PepsiCo (PEP) lowered its full-year earnings outlook on concerns over tariffs. The company projected that core earnings per share (EPS) would be roughly flat throughout the year, down from its prior outlook of a mid-single-digit increase. PepsiCo cited “expected higher supply chain costs related to tariffs, elevated macroeconomic volatility, and a subdued consumer backdrop” as reasons for the outlook cut. PepsiCo’s sales of $17.92 billion came in ahead of analysts’ estimates but its core EPS of $1.48 was short of projections. Shares are little changed in premarket trading.


Source link

Risk rally sparks modest Dollar rebound – United States


Written by the Market Insights Team

Risk rally boosts Mexican Peso

Kevin Ford – FX & Macro Strategist

Mexican peso has benefited from recent risk rally in markets and renewed hopes that stiff tariffs against major trading partners might be negotiated away in the next few months. Discussions between President Sheinbaum and President Trump have been ramping up, although no agreement has been reached yet. Sheinbaum’s government has chosen not to impose retaliatory tariffs on the U.S., keeping tensions from escalating further.

A key issue for Sheinbaum—and Mexico’s economy overall—is the auto industry. When the tariffs took effect in early April, automakers like Stellantis NV Motor Corp had to halt some production in Mexico, while others reduced overtime. With the auto sector making up around 30% of Mexico’s exports, these tariffs could deal a significant blow to manufacturing.

In 2024, Mexico’s automotive industry set record highs in production and exports. The Automotive Industry Administrative Registry of Light Vehicles reported that the U.S. was the primary destination for light vehicle exports, accounting for 2,771,000 units, or nearly 80% of the total.

At the same time, funds and institutional investors have shifted their stance on the Mexican peso, moving from heavily short positions to a more neutral outlook.

Chart CFTC MXN peso

The USD/MXN pair has the 200-day simple moving average (SMA) at 19.95, the 100-day SMA at 20.3438, and the 50-day SMA at 20.2505. The peso is currently trading at its weakest level since October 2024, a level last seen before President Trump’s election as the 47th president of the United States. Year to date, the peso has gained more than 6% against the US dollar.

 Chart USDMXN

Tariff seesaw swings on

George Vessey – Lead FX & Macro Strategist

Volatility-inducing policy statements just keep rocking investors. US equities looked poised to build on the biggest gains in two weeks, with the S&P 500 rising over 3% at one point yesterday on hopes of de-escalating trade tensions. Optimism was swiftly reined in though after President Donald Trump reaffirmed his commitment on tariffs. With macroeconomic uncertainty and geopolitical risks still unresolved, volatility across financial markets remains elevated.

The U-turns keep coming as President Trump allayed fears that he plans to fire Fed Chair Jerome Powell after rattling markets with multiple attacks against the Fed’s policy making. Risk appetite improved and was supported further after the President suggested the US is considering lower levies for Chinese products. Then, Treasury Secretary Bessent said Trump had not offered to cut tariffs on China on a unilateral basis, as market participants were dealt a reality check on a timely resolution to the US-China trade war. The inconsistent messaging continues to keep investors on edge and reluctant to hold US assets as the dollar continues to hover close to 3-year lows. Despite the attempted recovery over the past two days, the US dollar index has fallen over 8% year-to-date – marking its third worst start to a year on record.

On the macro front, the US Composite PMI fell to 51.2 in April, marking the slowest private sector growth in 16 months. Services PMI dropped to 51.4, while manufacturing unexpectedly rose to 50.7. Business expectations hit pandemic-era lows, and prices surged sharply, especially for manufactured goods due to tariffs. The outlook for the US economy remains murky, but if data continues to soften, the US exceptionalism narrative will continue fading, which will weigh further on the already beleaguered dollar.

Chart of DXY YTD performances

Trumponomics isn’t a new play

Kevin Ford – FX & Macro Strategist

Trumponomics in 2025 centers on a few key pillars: tariffs and trade policies tied to strategic global bargaining, tax cuts and deregulation, and shifts in labor market and immigration policies.

Interestingly, Trumponomics isn’t a completely new play. Argentina has implemented similar measures since President Mile took office, focusing on fiscal austerity, deregulation, and cutting red tape. The results have been striking, with inflation dropping from triple digits and, perhaps more impressively, the elimination of a fiscal deficit for the first time in 123 years. However, comparisons between Argentina and the United States have their limits, particularly given the outsized role tariffs play in the U.S. context.

In the U.S., recent surveys show consumers cutting back on discretionary spending and growing increasingly concerned about job security, especially in export-dependent industries. Sentiment is declining, and inflation expectations are rising, both domestically and internationally. This raises a critical question: if Trumponomics seeks to emulate Argentina’s success, how do deregulation and the push for smaller government align with the use of tariffs? The “small yard, high fence” strategy highlights this contradiction. Tariffs are likely to drive up prices in the short term, fueling inflationary pressure and public dissatisfaction, while also risking a contraction in economic growth and broader instability. Policymaking aimed at bringing global players to the U.S. negotiating table has already had significant economic repercussions.

Although sentiment measures are not always reliable indicators of future economic activity, the uncertainty surrounding trade policies is likely to continue weighing on growth prospects in the coming quarters.

Chart IMF Growth 2025

Euro’s unwind has room to run

George Vessey – Lead FX & Macro Strategist

After hitting a more than 3-year high recently just shy of $1.16, EUR/USD has pulled back to near $1.13. The 21-day moving average located at $1.1136 could act as a magnet in the short term, but the common currency continues to act as an attractive liquid alternative to the dollar in times of heightened risk aversion. For now, the uptrend remains intact, but the pace of the euro’s rally does give rise to an extended pullback in the very near term.

The April PMI was the first key sentiment gauge for the Eurozone since Trump’s ‘Liberation Day.’ The Eurozone’s figures reflect mixed sentiment amid ongoing tariff threats. It dropped to 50.1, its lowest in four months, though manufacturing showed slight improvement at 48.7, while services weakened to 49.7. France and Germany’s composite PMIs fell below 50, signalling contraction. Price pressures eased, supporting the ECB’s rate cut and raising the likelihood of further easing.

For the euro, these developments heighten risks of disinflation and stagnation. Economic uncertainty weighs on optimism, which could lead to more downward pressure on the currency if data weakens further. Until fiscal measures in Germany and European defense spending boost activity, further euro gains may be limited in the short term, but longer-term dynamics appear favourable given the regime shift in global trade and reduced demand for US assets unfolding.

Chart of EURUSD

Struggling UK economy bodes ill for sterling

George Vessey – Lead FX & Macro Strategist

The cautious relief rally in financial markets this week allowed GBP/EUR to reclaim the €1.17 handle briefly, having dropped to a 17-month low earlier this month. But a downside bias remains intact for the pair in the short-term so long as it remains below its 21-day moving average located at €1.1743. Meanwhile, GBP/USD has matched the recent drawdown in EUR/USD – dropping over 1% from 7-month highs above $1.34.

The stronger performance of EUR/USD compared to GBP/USD this month has caused the GBP/EUR exchange rate to decline. Initially, the ‘sell America’ trend put pressure on GBP/EUR; however, the recent EUR/USD pullback has shifted dynamics. Meanwhile, data indicates that the UK economy may be more impacted by tariff uncertainty than Europe, challenging earlier assumptions. Britain’s private sector faced its sharpest downturn in over two years, as Trump’s tariffs led to a significant drop in overseas orders, stoking concerns of a potential recession. The UK’s composite PMI tumbled to 48.2 in April, down from 51.5 in March. This figure not only fell short of economists’ expectations of 50.4 but also dropped below the critical 50 mark, signalling a contraction in economic activity.

The survey highlights mounting pressures on the UK economy amid global trade uncertainties and when we overlay the PMI differential over GBP/EUR, the figures over the past few months don’t bode well for the pound’s medium-term outlook versus the euro.

Chart of PMIs
Chart of GBPEUR

Relief rally sees gold lower and stocks higher

Table: 7-day currency trends and trading ranges

Table Rates

Key global risk events

Calendar: April 21-25

Table Key events

All times are in ET

Have a question? [email protected]

*The FX rates published are provided by Convera’s Market Insights team for research purposes only. The rates have a unique source and may not align to any live exchange rates quoted on other sites. They are not an indication of actual buy/sell rates, or a financial offer.


Source link

Tesla’s EU Sales Sink Again


KEY TAKEAWAYS

  • Tesla’s sales in the European Union (EU) tumbled for a third consecutive month in March, even as overall new battery-electric vehicle registrations went up.
  • According to the European Automobile Manufacturers’ Association, Tesla’s EU new car registrations, which serve as a proxy for sales, plunged 36% year-over-year to 18,224 vehicles in March, a month after they plummeted 47%.
  • Tesla’s new vehicle registrations in the bloc have dropped 45% over the first three months of 2025.

Tesla’s (TSLA) sales in the European Union (EU) tumbled for a third consecutive month in March, even as overall new battery-electric vehicle registrations went up.

According to the European Automobile Manufacturers’ Association, Tesla’s EU new car registrations, which serve as a proxy for sales, plunged 36% year-over-year to 18,224 vehicles in March and have dropped 45% over the first three months of 2025. They had plummeted 47% in February following a 50% drop in January.

Meanwhile, battery-electric vehicle (BEV) registrations in the bloc jumped nearly 17.1% overall in March.

Shares of Tesla, whose percentage of new car registrations in the EU fell to 1.8% in March from 2.8% the same month last year, slipped 1% in premarket trading Thursday. They had rallied 5% Wednesday as its weaker-than-expected results were offset by a pledge by CEO Elon Musk to spend more time at the company and less working with the Trump administration.


Source link

Your 3% Dividend Yield Could be 9%: Here’s What You’re Missing


Many dividend-focused investors are getting modest yields when they could be considering higher-income investments. While the S&P 500 Index‘s average dividend yield languishes below 2%—”much lower than historical dividend yields,” Sahil Vakil, a financial advisor and founder of MYRA, told Investopedia—savvy income investors are often obtaining higher payouts elsewhere.

“The most common misconception about dividend yields is that a high yield is always a good thing and a sign of a strong investment,” Vakil said. “Investors often focus solely on the dividend yield percentage without considering the underlying reasons for it, such as a declining stock price or a company’s ability to sustain dividend payouts.”

The task, then, is to find higher-yield investments without investing your money in something that is unsustainable or carries excessive risk. We examine two higher-yielding options below.

Key Takeaways

  • While the S&P 500’s average dividend yield sits below 2%, investors seeking higher income can find yields of 9% or higher through specialized investments like BDCs, midstream energy companies, and closed-end funds—though none are without risk.
  • The highest-yielding investments typically require understanding specific market niches and tax implications.

Why Traditional Dividend Yields May Not Be Enough

While dividend investing remains a cornerstone strategy for many, the reality is stark: the S&P 500’s average dividend yield hovers below 2%. The decline is part of a fundamental shift in what companies do with their money, often favoring stock buybacks over dividends—in short, using the funds to increase their stock price over stockholder distributions.

For retirees or those approaching retirement, this yield gap presents a particular challenge, especially as yields can shift with broader economic changes. “Dividend growth investment strategy is impacted by many direct and indirect factors,” Vakil said. “Direct factors include interest rate movements by the Federal Reserve. For example, if the Federal Reserve eases monetary policy by decreasing interest rates, then high dividend stocks become more attractive as interest rates fall.” Indirect factors would be broad economic or sector-specific changes that affect earnings and thus dividend payouts.

For several decades, financial planners have suggested a 4% to 4.7% withdrawal rate from portfolios—a target that’s difficult to achieve through traditional dividend stocks alone without dipping into your principal.

Business Development Companies (8% to 15%)

Created by Congress to encourage investment in middle-market businesses, BDCs are publicly traded entities sometimes called “private equity for the common investor,” providing financing to companies too large for bank loans but not yet ready for public markets.

BDCs must distribute at least 90% of their taxable income as dividends, resulting in yields often ranging from 8% to 15%. Ares Capital (ARCC), the largest BDC with a $15 billion market cap, has a 9.5% yield (here and below, the last distribution as of April 2025) with a comparatively conservative portfolio primarily in senior secured loans. For higher potential returns, TriplePoint Venture Growth (TPVG) has a dividend yield above 20%, gained by financing growth-stage technology companies—thus, less likely to be stable.

However, these impressive yields come with significant risks. BDCs can borrow up to $2 for every $1 they own, which can amplify losses when things go wrong. They lend to smaller businesses that are more likely to default during tough times, so dividends are likely to drop when the economy slows.

Tip

Holding BDCs in tax-advantaged accounts, such as IRAs, can prove even more important than usual, as distributions are generally taxed as ordinary income rather than qualifying for preferred dividend tax rates.

Midstream Energy Infrastructure (4% to 8% Yields)

Midstream energy companies own and operate the pipelines, storage tanks, and processing facilities that move oil and natural gas from wells to refineries and then on to consumers. They’re like the toll roads of the energy industry, collecting their fees regardless of energy prices.

These companies are formed as master limited partnerships (MLPs), allowing them to gain the tax benefits of being a limited partnership while offering units (not shares) to the public. They yield between 4% and 8%. For example, Energy Transfer LP (ET) has a yield of 7.8%, while Enterprise Products Partners LP (EPD) has a yield of 7.1%.

To instantly diversify your money across different companies in the sector, consider exchange-traded funds (ETFs). For example, the Alerian MLP ETF (AMLP) is a $10 billion fund that tracks the Alerian MLP Infrastructure Index and has a dividend yield of 7.8%. The Global X MLP ETF (MLPA) has a yield of 7.3% while tracking the Solactive MLP Infrastructure Index.

What makes midstream companies attractive is their steady cash flow from long-term contracts with built-in inflation adjustments. However, economic downturns can reduce energy demand, some companies carry significant debt, and many MLPs issue complex tax forms that can make tax preparation more challenging. You can solve this last problem by just holding these MLPs through an ETF.

The Bottom Line

While traditional dividend stocks offer modest yields, there’s a world of higher-income prospects for investors willing to explore less familiar territory. BDCs and midstream energy infrastructure MLPs are just two options for investments that have often paid out higher dividends. However, they have specific risks and tax implications that must be carefully weighed against your financial goals and risk tolerance.


Source link

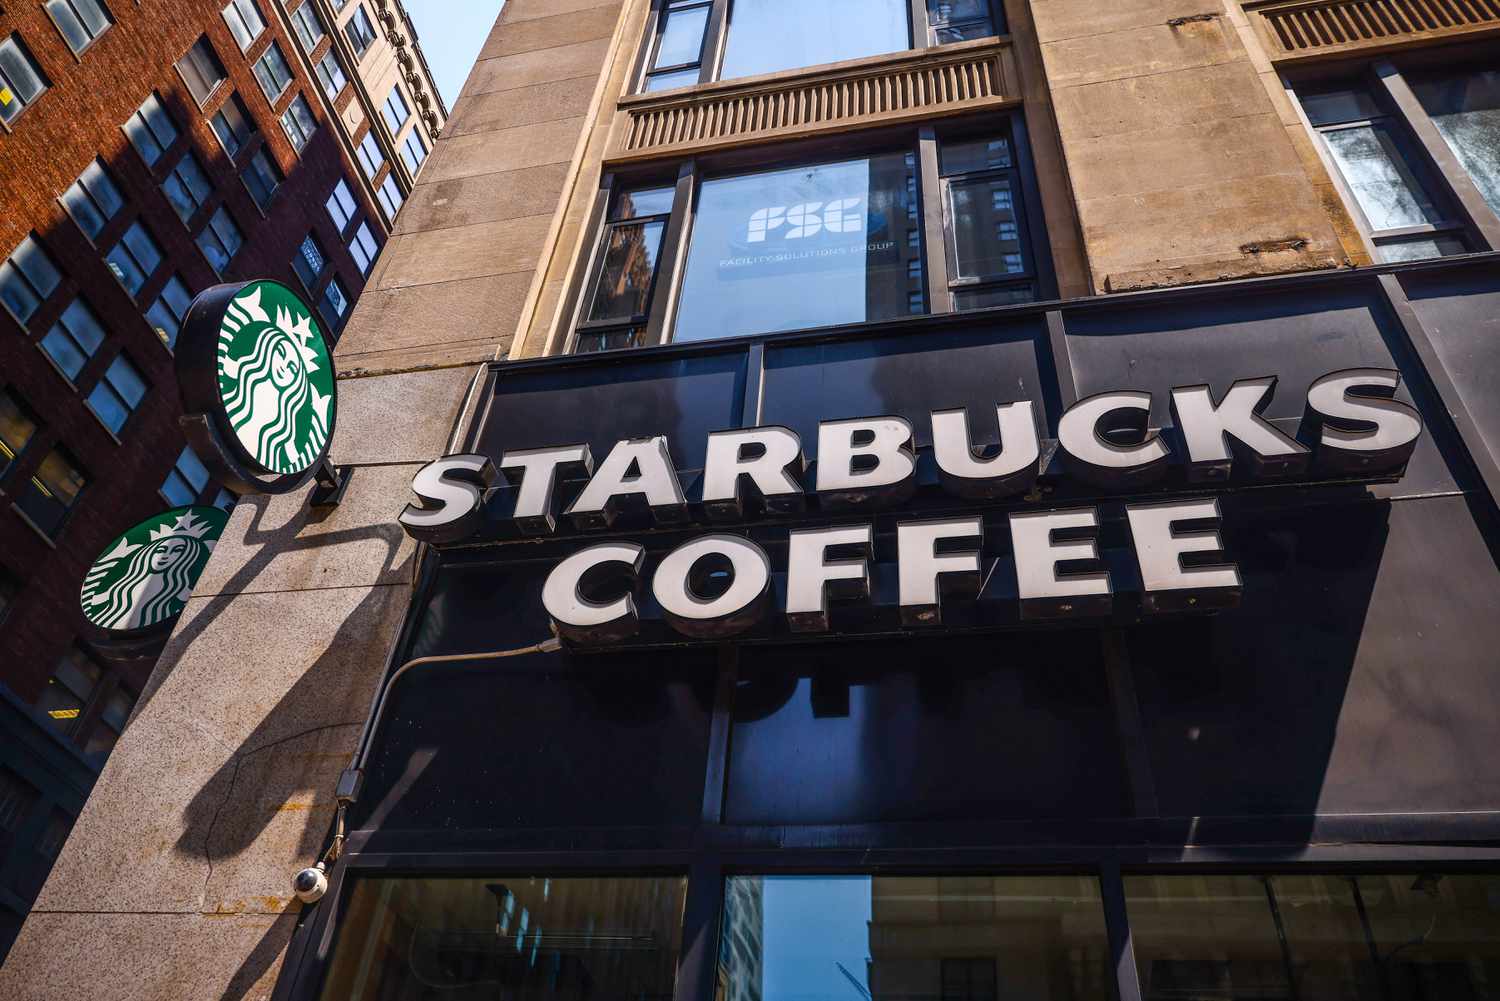
Dress-Code Changes and Handwritten Notes Are Some of Starbucks’ Latest Changes


Key Takeaways

  • Starbucks CEO Brian Niccol has been busy with a turnaround plan at the coffee chain since taking over last fall.
  • His changes include revamping cafes, prioritizing speed, bringing back handwritten messages on cups, and an updated dress code.
  • A recent Deutsche Bank survey suggested that price may be even more important to coffee drinkers. Starbucks is set to report its next quarterly earnings on Tuesday.

The Starbucks (SBUX) makeover continues, affecting both the shops and the people who staff them. We’ll learn more about how it’s going over with customers next week.

The company’s “Back to Starbucks” campaign, geared toward bringing customers back to the global coffee chain, is evolving as CEO Brian Niccol, who took over last fall, continues to make changes to the company’s appearance and operations. “Our problems are fixable,” Niccol said in October. “Most of what we need to do is in our control.”

The coffee chain is revamping its cafes in a bid to make them feel more cozy and welcoming, prioritizing efficiency and speed by making it a mission to get customers their orders within four minutes, and restoring its condiments bar.

Starbucks has also brought back something divisive: Sharpies.

Messages on To-Go Cups Make a Comeback

If your Starbucks order recently came to you with hearts or a smiley face on it, the barista probably wasn’t flirting with you. Workers were required to write messages or doodles on every to-go cup as of January. Starbucks did not immediately respond to Investopedia’s request for comment, but The Wall Street Journal recently reported that customer reactions are running the gamut from delighted, to confused— to indifferent.

The worker drawing your doodle might also dress a little differently. Earlier this month, the coffee chain earlier this month announced plans to update its dress code for a “more consistent coffeehouse experience” that bolsters the brand.

“We’re evolving our dress code in all stores to focus on simplified color options that allow our iconic green apron to shine and create a sense of familiarity for our customers, no matter which store they visit across North America,” said Starbucks. 

The updated look will require workers to pair their green apron with a company-branded shirt, two of which are provided gratis, or a solid black shirt with khaki, black, or blue denim bottoms. Previously, baristas could wear any color top or bottom with their apron.

The look of the cafes and workers isn’t what has kept customers away from Starbucks, though: It’s the price, according to a recent Deutsche Bank survey. Starbucks is expected to report its earnings next Tuesday, while shares are down about 9% this year.


Source link

Conflicting signals keep volatility elevated – United States


Written by the Market Insights Team

Tariff seesaw swings on

George Vessey – Lead FX & Macro Strategist

Volatility-inducing policy statements just keep rocking investors. US equities looked poised to build on the biggest gains in two weeks, with the S&P 500 rising over 3% at one point yesterday on hopes of de-escalating trade tensions. Optimism was swiftly reined in though after President Donald Trump reaffirmed his commitment on tariffs. With macroeconomic uncertainty and geopolitical risks still unresolved, volatility across financial markets remains elevated.

The U-turns keep coming as President Trump allayed fears that he plans to fire Fed Chair Jerome Powell after rattling markets with multiple attacks against the Fed’s policy making. Risk appetite improved and was supported further after the President suggested the US is considering lower levies for Chinese products. Then, Treasury Secretary Bessent said Trump had not offered to cut tariffs on China on a unilateral basis, as market participants were dealt a reality check on a timely resolution to the US-China trade war. The inconsistent messaging continues to keep investors on edge and reluctant to hold US assets as the dollar continues to hover close to 3-year lows. Despite the attempted recovery over the past two days, the US dollar index has fallen over 8% year-to-date – marking its third worst start to a year on record.

On the macro front, the US Composite PMI fell to 51.2 in April, marking the slowest private sector growth in 16 months. Services PMI dropped to 51.4, while manufacturing unexpectedly rose to 50.7. Business expectations hit pandemic-era lows, and prices surged sharply, especially for manufactured goods due to tariffs. The outlook for the US economy remains murky, but if data continues to soften, the US exceptionalism narrative will continue fading, which will weigh further on the already beleaguered dollar.

Chart of DXY YTD performances

Euro’s unwind has room to run

George Vessey – Lead FX & Macro Strategist

After hitting a more than 3-year high recently just shy of $1.16, EUR/USD has pulled back to near $1.13. The 21-day moving average located at $1.1136 could act as a magnet in the short term, but the common currency continues to act as an attractive liquid alternative to the dollar in times of heightened risk aversion. For now, the uptrend remains intact, but the pace of the euro’s rally does give rise to an extended pullback in the very near term.

The April PMI was the first key sentiment gauge for the Eurozone since Trump’s ‘Liberation Day.’ The Eurozone’s figures reflect mixed sentiment amid ongoing tariff threats. It dropped to 50.1, its lowest in four months, though manufacturing showed slight improvement at 48.7, while services weakened to 49.7. France and Germany’s composite PMIs fell below 50, signalling contraction. Price pressures eased, supporting the ECB’s rate cut and raising the likelihood of further easing.

For the euro, these developments heighten risks of disinflation and stagnation. Economic uncertainty weighs on optimism, which could lead to more downward pressure on the currency if data weakens further. Until fiscal measures in Germany and European defense spending boost activity, further euro gains may be limited in the short term, but longer-term dynamics appear favourable given the regime shift in global trade and reduced demand for US assets unfolding.

Chart of EURUSD

Struggling UK economy bodes ill for sterling

George Vessey – Lead FX & Macro Strategist

The cautious relief rally in financial markets this week allowed GBP/EUR to reclaim the €1.17 handle briefly, having dropped to a 17-month low earlier this month. But a downside bias remains intact for the pair in the short-term so long as it remains below its 21-day moving average located at €1.1743. Meanwhile, GBP/USD has matched the recent drawdown in EUR/USD – dropping over 1% from 7-month highs above $1.34.

The stronger performance of EUR/USD compared to GBP/USD this month has caused the GBP/EUR exchange rate to decline. Initially, the ‘sell America’ trend put pressure on GBP/EUR; however, the recent EUR/USD pullback has shifted dynamics. Meanwhile, data indicates that the UK economy may be more impacted by tariff uncertainty than Europe, challenging earlier assumptions. Britain’s private sector faced its sharpest downturn in over two years, as Trump’s tariffs led to a significant drop in overseas orders, stoking concerns of a potential recession. The UK’s composite PMI tumbled to 48.2 in April, down from 51.5 in March. This figure not only fell short of economists’ expectations of 50.4 but also dropped below the critical 50 mark, signalling a contraction in economic activity.

The survey highlights mounting pressures on the UK economy amid global trade uncertainties and when we overlay the PMI differential over GBP/EUR, the figures over the past few months don’t bode well for the pound’s medium-term outlook versus the euro.

Chart of PMIs
Chart of GBPEUR

Relief rally sees gold lower and stocks higher

Table: 7-day currency trends and trading ranges

Table of FX rates

Key global risk events

Calendar: April 21-25

Table of risk events

All times are in BST

Have a question? [email protected]

*The FX rates published are provided by Convera’s Market Insights team for research purposes only. The rates have a unique source and may not align to any live exchange rates quoted on other sites. They are not an indication of actual buy/sell rates, or a financial offer.


Source link

Watch These Bitcoin Price Levels as Key $100K Level Back in Striking Distance


Key Takeaways

  • Bitcoin rose again Wednesday to bring the closely watched $100,000 mark back into striking distance.
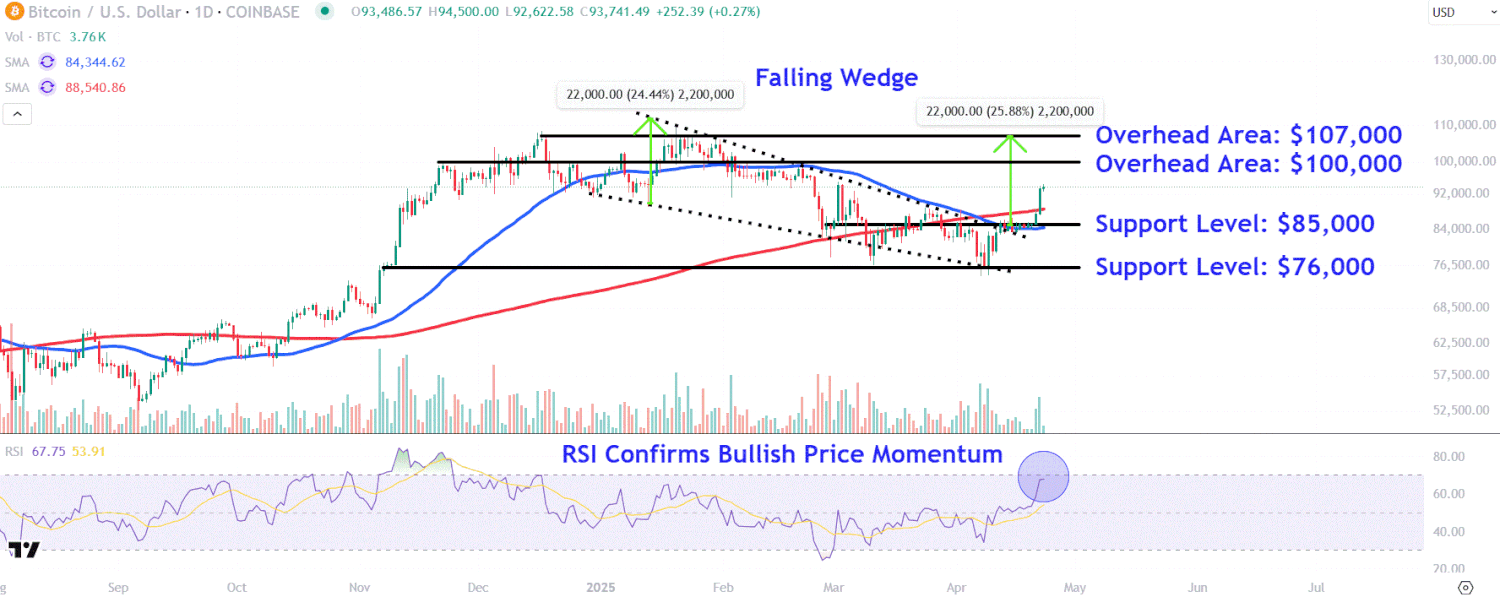
  • The cryptocurrency oscillated within a four-month falling wedge before breaking out above the pattern earlier this month.
  • Investors should watch major overhead areas on Bitcoin’s chart around $100,000 and $107,000, while also monitoring key support levels near $85,000 and $76,000.

Bitcoin (BTCUSD) rose again Wednesday to bring the closely watched $100,000 mark back into striking distance.

The pioneer cryptocurrency, along with other risk-on assets, have rallied the past few days amid optimism that the White House could scale back its plans on tariffs after President Trump said the levy on China will be “substantially” below its current 145% level. Sentiment also received a boost after the president walked back recent rhetoric about firing Fed Chair Jerome Powell, shoring up confidence across financial markets that the central bank will retain its independence.

While Bitcoin well below its record high of $109,000 set in January, it has risen about 25% from its 2025 low set in early April, as investors potentially turn to the cryptocurrency as an alternative to volatile stocks and a weakening U.S. dollar. Bitcoin was trading at $93,500 recently.

Below, we break down the technicals on Bitcoin’s chart and point out major price levels that investors will likely be eyeing.

Falling Wedge Breakout

Bitcoin oscillated within a four-month falling wedge before breaking out above the pattern earlier this month. Importantly, the price staged a decisive close above the closely watched 200-day moving average in Tuesday’s trading session, though volumes were lackluster.

Meanwhile, the relative strength index (RSI) confirms bullish momentum with a reading above the 50 threshold, but remains below overbought levels, giving the price sufficient room to explore higher levels.

Let’s identify two major overhead areas to watch amid the potential for further upside in bitcoin’s price and also point out key support levels worth monitoring during retracements.

Major Overhead Areas to Watch

Firstly, it’s worth keeping track of the psychological $100,000 area. Bitcoin’s price could experience selling pressure at this major level near a horizontal line that connects an array of price action on the chart between last November and late February.

However, a close above this region could see the price make a move to around $107,000. Investors who have bought the cryptocurrency’s recent breakout may decide to lock in profits in this area near the prominent December and January peaks.

This location also matches with a projected measured move price target that calculates the depth of falling wedge and adds that amount to the pattern’s breakout point. For example, adding $22,000 to $85,000 forecasts a target of $107,000.

Support Levels Worth Monitoring

Selling in the cryptocurrency could see an initial retracement to around $85,000. Investors may seek buying opportunities in this area near this month’s breakout point, which also closely aligns with a range of trading activity on the chart stretching back to late February.

Finally, a deeper pullback opens the door for a retest of lower support at $76,000. Investors may look to accumulate bitcoin in this area near a trendline that links April’s swing low with a series of prices following the cryptocurrency’s initial post-election pop in November last year.

The comments, opinions, and analyses expressed on Investopedia are for informational purposes only. Read our warranty and liability disclaimer for more info.

As of the date this article was written, the author does not own any of the above securities.


Source link

Markets Erupt on Positive News


Trump softens on Powell and China … tariff rates will be coming down … are investors finally seeing bitcoin as a hedge? … miners are popping … Jonathan Rose racks up another winner

As I write Wednesday mid-afternoon, all three major stocks indexes are up nicely after a flurry of good news this morning.

Let’s begin with Trump:

  1. The President said that he has “no intention” of firing Federal Reserve Chairman Jerome Powell
  2. He appears willing to take a less aggressive approach toward trade with China, saying that his administration’s tariff rate on China is “very high, and it won’t be that high. … No, it won’t be anywhere near that high. It’ll come down substantially. But it won’t be zero.”

Diving into this second point, this morning, The Wall Street Journal ran an exclusive story reporting that Trump is considering cutting tariffs by more than half.

From the WSJ:

President Trump hasn’t made a final determination, the people said, adding that the discussions remain fluid and several options are on the table.

One senior White House official said the China tariffs were likely to come down to between roughly 50% and 65%.

Adding to the good news, the plan could include a tiered tariff system along with a gradual phase-in of tariffs rather than an overnight “on” switch.

Back to the WSJ:

The administration is also considering a tiered approach similar to the one proposed by the House committee on China late last year: 35% levies for items the U.S. deems not a threat to national security, and at least 100% for items deemed as strategic to America’s interest, some of the people said.

The bill proposed phasing in those levies over five years.

Finally, in a keynote address to the Institute of International Finance, Treasury Secretary Scott Bessent outlined a plan to restore “equilibrium” to the global financial system.

He also said that “there is an opportunity for a big deal here” between the U.S. and China.

This comes after his conciliatory remarks yesterday, including, “No one thinks the current status quo [of current tariff rates] is sustainable.”

Bottom line: Outside of signed trade deals, this is what Wall Street and corporate America wanted – normalcy. Something steady that it can plug into its pro formas and use as the basis for capital allocation decisions.

Though stocks are off their highs from earlier in the session, it’s still a strong day in the market as I write. And even if the gains pull back further, we’re encouraged by today’s trade talk.

A key setup for another asset

Here in 2025, the U.S. dollar has been sliding fast.

Even though it’s rallying today on positive trade news, as you can see below, since mid-January, the dollar has lost 9%.

Chart showing even though it’s rallying today on positive trade news, as you can see below, since mid-January, the dollar has lost 9%.

Source: TradingView

Meanwhile, economic uncertainty has been spiking.

Below, we look at the “Economic Policy Uncertainty Index for United States” from the Federal Reserve.

Starting in 1985, today’s level clocks in at the highest reading outside of the Global Financial Crisis in 2008 and the Covid meltdown in 2020.

Chart showing the “Economic Policy Uncertainty Index for United States” from the Federal Reserve. Starting in 1985, today’s level clocks in at the highest reading outside of the Global Financial Crisis in 2008 and the Covid meltdown in 2020.

Source: Fed data

Finally, governments around the world are awash in debt.

According to the Institute of Internation Finance, the global debt-to-GDP ratio notched a record high of 328% in 2024. Behind it was a surge in global debt to $318 trillion. 

So, combine a crumbling dollar, soaring economic uncertainty, and surging global debt, and what do you get?

(Besides gold setting a string of new all-time highs recently…)

Bitcoin, finally showing signs of acting like an independent hedge!

As I write, Bitcoin has reclaimed $93,000

Although it’s tempting to attribute the gain to the “risk on” market sentiment that’s fueling stocks today, there’s more going on.

But first, let’s be clear – it’s too early to conclude that bitcoin has bottomed. It’s also too early to say that investor sentiment has suddenly shifted, and bitcoin is now considered a rock-solid safeguard of economic value…

But we’re inching in that direction.

First, showing that this is more than a “risk on” rally, below we look at bitcoin and the S&P 500 since April 9. Even with today’s market surge, the S&P is flat while bitcoin is up 12%.

Chart showing bitcoin and the S&P 500 since April 9. Even with today’s market surge, the S&P is flat while bitcoin is up 12%.

Source: TradingView

Why?

First, a weakening U.S. dollar erodes confidence in fiat currencies, especially for people looking to store long-term value. Bitcoin – volatile as it is – is a hard asset thanks to its capped supply (21 million coins), no central authority, and resistance to debasement.

Second, tied to the first point, bitcoin is a sort of “exit ramp” from a global system addicted to debt. The U.S. is hardly the only nation with soaring debt spending. Too much borrowing/spending weakens fiat currencies (not just the dollar) over time.

Third, during past periods of trade tensions (like the US/China spat in 2019), bitcoin spiked due to cross-border capital flight. Chinese and other emerging market investors were looking for non-sovereign stores of value. Crypto is borderless and doesn’t rely on the U.S. dollar or global trade frameworks.

Put it all together and it’s easy to see why investors are moving back into bitcoin…

The gains aren’t “in spite of global uncertainty,” they’re “because of global uncertainty.”

From a trading perspective, the granddaddy crypto appears ready to build on its recent gains

So says master trader Jeff Clark.

For newer Digest readers, Jeff is a legendary trader with more than four decades of experience. In his service, Jeff Clark Trader, he uses a suite of indicators and charting techniques to profitably trade the markets regardless of direction – up, down, or sideways.

From Jeff’s update yesterday:

The setup in bitcoin looks bullish.

After peaking above $105,000 in early February, bitcoin has been in a consistent downtrend – making a series of lower highs and lower lows.

But, as bitcoin approached $75,000 earlier this month, the momentum indicators at the bottom of the chart were making higher lows.

This sort of “positive divergence” is often an early warning sign of an impending rally.

For the past three weeks, bitcoin has been stuck in a tight trading range near the $85,000 level. This consolidating action has allowed all of the various moving averages to coil together and build up energy to fuel the next big move.

And, after [Monday’s] rally, it appears “the next big move” will be to the upside.

Jeff’s prediction is certainly playing out as I write Wednesday.

But if you want the biggest gains, Jeff recommends you look at bitcoin miners

As you’d expect, when bitcoin is doing well, bitcoin miners tend to follow. But Jeff notes that something unusual has been happening for the past few weeks:

While bitcoin has been chopping back and forth in a trading range between $76,000 and $86,000, the bitcoin miners have been declining to new lows.

The stock declines have been so severe the miners now trade at the lowest value ever relative to bitcoin…

That means one of two things must happen to bring it back into its historic range. Either bitcoin needs to fall, or the bitcoin miners have to rally – or some combination of the two.

While Jeff anticipates more gains from bitcoin climbing, he writes that miners will climb farther/faster:

Traders who are bullish on bitcoin can buy the cryptocurrency right here.

But the bigger gains will likely come from the bitcoin miners.

To his point, between yesterday and Wednesday as I write, bitcoin miners Marathon Digital Holdings (MARA), CleanSpark (CLSK), and Riot Platforms (RIOT) have surged, respectively, 18.5%, 21.4%, and 22.6%.

Trade accordingly.

We can’t mention “short-term trading gains” without a nod to our corporate partner TradeSmith and their cutting-edge An-E trading tool

Today is the final day to watch the free replay of last week’s trading breakthrough from Keith Kaplan, TradeSmith’s CEO, where he detailed TradeSmith’s AI algorithm – “An-E” (short for Analytical Engine).

This cutting-edge trading tool forecasts the share price of thousands of stocks, funds, and ETFs one month into the future along with the conviction level of that prediction.

Because the platform is rooted in quantitative analysis, its advanced predictive modeling isn’t guesswork. An-E analyzes millions of data points, learning patterns, pricing behavior, and momentum signals that most investors would never catch. 

Here’s Keith:

While human investors react with fear, delay, or overconfidence, a new breed of trading algorithm – like our cutting-edge system, An-E – is making precise, unemotional forecasts about where the market is heading next…

Unlike humans, AI doesn’t get emotional. It doesn’t chase headlines.  It doesn’t second-guess every move. Instead, it digests mountains of data and makes calculated projections – especially when things get messy. 

And in this turbulent market, messy is the new normal…

Again, this is the last day to check out Keith’s free replay. Here’s that link.

Finally, huge “congratulations” are due to subscribers of trading veteran Jonathan Rose, who just locked in a 100% trade war winner

For newer Digest readers, Jonathan is the analyst behind Masters in Trading Live.

He earned his stripes at the Chicago Board Options Exchange, going toe-to-toe with some of the world’s most aggressive and successful moneymakers in the business. He’s made more than $10 million over the course of his career, profiting from bull markets, bear markets, and everything in between.

During this market volatility, Jonathan and his subscribers have been winning again.

From his recent Masters in Trading Live update:

The markets can’t seem to find their footing after Liberation Day.

But for nimble traders, all this volatility is creating perfect trading opportunities – as long as we know where to find them.

This week, we scored one of our biggest wins yet after spotting a widening gap between Mexican and Brazilian stocks.

That triple-digit gain wasn’t mere luck… It came from spotting an opportunity to benefit from a key divergence forming between two major markets.

If you missed it, don’t worry – Jonathan writes that market divergences are happening everywhere right now.

He points toward the gold-to-oil ratio, sitting at an extreme 274.74 as an example. He’s also seeing significant gaps between crude oil and refined products.

If you want Jonathan to tip you off about these opportunities – for free – join him for his Masters in Trading Live broadcasts, every day the market is open at 11:00 am

It’s a fantastic way to learn more about trading volatile markets, while also giving you the tools to put a wad of cash in your pocket.

But there’s no pressure to trade either. You can simply tune in to watch, listen, and learn.

Here’s feedback from two of Jonathan’s followers:

Chart showing endorsements for MIT LiveChart showing endorsements for MIT Live

Here’s Jonathan, speaking to his subscribers wins, but also inviting new traders to join. I’ll let him take us out today:

Seeing you lock in profits on both sides of this trade is exactly why we focus on these market divergences in the first place.

With so many huge price dislocations and widening spreads in the stock market, our strategy is well-positioned to find even bigger opportunities for profit from here.

Join me for Masters in Trading LIVE, where I’ll show you the specific crack spread setups offering the best risk/reward in this volatile market environment.

Have a good evening,

Jeff Remsburg


Source link

Copyright © 2023 | Powered by WordPress | Coin Market Theme by A WP Life